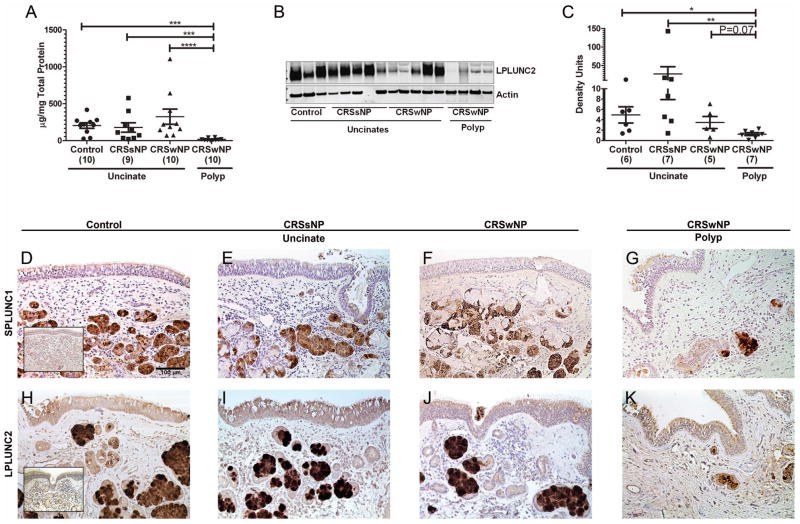
Figure 2. Evaluation of protein expression and localization of the two highly expressed PLUNC family members by ELISA (SPLUNC1), immunoblot (LPLUNC2) and immunohistochemistry.
Tissue extracts of uncinates from control subjects and patients with CRSsNP or CRSwNP, and polyps from patients with CRSwNP were used to analyze the concentration of SPLUNC1 protein by ELISA (A) and LPLUNC2 protein by immunoblot analysis (B and C). A representative immunoblot for LPLUNC2 (49 kDa) and Actin (42 kDa) (B). Densitometry analysis of LPLUNC2 immunoblots (C). Representative SPLUNC1 (D–G) and LPLUNC2 (H–K) immunostaining in uncinate of a control subject (D and H), a CRSsNP patient (E and I), a CRSwNP patient (F and J) and a polyp from a CRSwNP patient (G and K). Inset in D and H shows control IgG staining for SPLUNC1 and LPLUNC2 respectively. Representative of 7–10 donors per group shown as 200X. *P<0.05, **P<0.01, ***P<0.001

