

Abstract
Prediction of mortality in severely burned patients remains unreliable. Although clinical covariates and plasma protein abundance have been used with varying degrees of success, the triad of burn size, inhalation injury, and age remains the most reliable predictor. We investigated the effect of combining proteomics variables with these three clinical covariates on prediction of mortality in burned children. Serum samples were collected from 330 burned children (burns covering >25% of the total body surface area) between admission and the time of the first operation for clinical chemistry analyses and proteomic assays of cytokines. Principal component analysis revealed that serum protein abundance and the clinical covariates each provided independent information regarding patient survival. To determine whether combining proteomics with clinical variables improves prediction of patient mortality, we used multivariate adaptive regression splines, because the relationships between analytes and mortality were not linear. Combining these factors increased overall outcome prediction accuracy from 52% to 81% and area under the receiver operating characteristic curve from 0.82 to 0.95. Thus, the predictive accuracy of burns mortality is substantially improved by combining protein abundance information with clinical covariates in a multivariate adaptive regression splines classifier, a model currently being validated in a prospective study. Clin Trans Sci 2012; Volume #: 1–7
Keywords: mortality, stress, pediatrics, cytokines
Introduction
Severe burn injury is an extreme form of trauma, affecting more than two million people in the United States annually. 1 Severe burns trigger marked hypermetabolic and inflammatory responses, inducing dramatic protein degradation that compromises the function of multiple organ systems. Impaired organ function frequently results in multiorgan failure, the leading cause of mortality in burn patients. Advances in clinical care, including early burn wound excision, improvements in resuscitation, and refinement of antibiotic and antimycotic treatment protocols, have reduced mortality following severe burns. The next major advance in burn care will be the ability to predict the most likely outcome so that clinical therapies can be individualized to maximize patients’ chance of survival.
Currently, physicians rely on clinical variables such as burn size, age, and the presence of inhalation injury to identify patients with low chances of survival during hospitalization. Unfortunately, this approach has had limited success in predicting burn mortality. 2 Efforts to use individual genes or proteins to predict patient outcome have also met with limited success. Identifying biomarkers for predicting survival could greatly enhance clinical management of large burn injuries by allowing individualized treatment. An outcome‐related biosignature could also enable early identification of patients with a high probability of dying. Aggressive prophylactic measures beyond normal preventative treatment could then be instituted to decrease the likelihood of dying. Here, we investigated whether serum analyte abundance as a group can improve the accuracy of burn size, age, and the presence of inhalation injury in predicting burn patient mortality.
Methods
Study population
Three hundred thirty‐two children were enrolled in this study. All children had a total burn surface area (TBSA) exceeding 25%, were admitted and consented to an institutional review board‐approved experimental protocol between 1997 and 2008, and required at least one surgical intervention. The study was reviewed and approved by the Institutional Review Board of the University of Texas Medical Branch, Galveston, Texas. Before the study, each subject, parent, or legal guardian signed a written informed consent form.
Subjects were 19 years of age and admitted to Shriners Hospitals for Children®— Galveston (Galveston, TX, USA) within 7 days of injury. Serum was collected before the first operation and within 24 hours of admission. After admission, patients were treated according to the standard of burn care at our hospital. This treatment included excision and grafting of the burn wound within 24 hours of hospital admission as well as fluid and caloric resuscitation according to the Galveston formulas. 3 Patients were fed enterally with ¾ strength Vivonex T.E.N. (Nestle‐Novartis, Vevey, Switzerland) according to the formula 1,500 kcal/m2 body surface area + 1,500 kcal/m2 burned. 3 All patients underwent bronchoscopy within 24 hours of admission to diagnose inhalation injury. Demographic data, burn size, presence/absence of inhalation injury, and survival were recorded.
Serum protein analysis
Blood was drawn into a serum‐separator collection tube and centrifuged for 10 minutes at 1,320 rpm. The resulting serum was stored at −70°C until assayed. Serum hormones and acute phase proteins were measured using HPLC, nephelometry (BN II System plasma protein analyzer and Dimensions XBand, both from Siemens Healthcare Diagnostics, West Sacramento, CA, USA), and ELISA. 4
Glucose concentration was determined in our clinical laboratory using the hexokinase assay (Siemens Healthcare Diagnostics). Serum creatinine, bilirubin, alanine aminotransferase (ALT), aspartate aminotransferase (AST), alkaline phosphatase, albumin, blood urea nitrogen (BUN), chloride, γ‐glutamyltransferase, haptoglobin, alpha‐1 acid glycoprotein, apolipoprotein A1, Ca2+, K+, Mg2+, phosphorus, and total protein were determined using nephelometry. 5 Insulin, IGF‐1, and rhGH‐1 were measured by ELISA. Estradiol and IGFBP‐3 were measured by radioimmunoassay.
Cytokine assays
The Bio‐Plex® Human Cytokine 17‐Plex panel was used with the Bio‐Plex Suspension Array System (Bio‐Rad, Hercules, CA, USA) to simultaneously profile expression of 17 inflammatory mediators in serum samples. 6 , 7 , 8 The cytokines analyzed were IL‐1β, IL‐2, IL‐4, IL‐5, IL‐6, IL‐7, IL‐8, IL‐10, IL‐12p70, IL‐13, IL‐17, granulocyte colony‐stimulating factor (G‐CSF), granulocyte‐macrophage colony‐stimulating factor (GM‐CSF), interferon‐gamma, monocyte chemoattractant protein‐1 (MCP‐1), macrophage inflammatory protein‐1‐beta, and TNF. The assay was performed according to the manufacturer's instructions. In brief, serum samples were thawed, centrifuged at 4,500 rpm for 3 minutes at 4°C, and incubated for 30 minutes with microbeads labeled with antibodies against one of the aforementioned cytokines. After washing, the beads were incubated with the detection antibody cocktail, with each bead being specific to a single cytokine. After another wash step, the beads were incubated with streptavidin‐phycoerythrin for 10 minutes and washed. Cytokine concentrations were determined using an array reader. For each cytokine, a standard curve was generated using recombinant proteins to estimate protein concentration in the unknown sample.
Analysis
We used t‐tests to compare differences between the clinical characteristics of survivors and nonsurvivors; t‐tests were performed using SAS, version 9.1.3 (SAS, Inc., Cary, NC, USA) and SPSS, Release 11.0.1 (SPSS, Inc., Chicago, IL, USA). The values of p were adjusted using the Benjamini and Hochberg's false discovery rate method. 9
Principal component analysis (PCA) was used to assess whether proteomic assays of cytokines or other clinical chemistries provided independent information. PCA is a dimension reduction technique applied to complex data. In this method, a large number of highly correlated, and possibly nonorthogonal, experimental variables are replaced with a smaller number of uncorrelated, orthogonal variables called principal components, which are linear combinations of the original experimental variables. The PCA method calculates a covariance matrix of the predictors and produces an orthogonal transformation of ranked, independent eigenvectors. The elements of the eigenvectors describe the contribution of each experimental variable to the principal components, each of which corresponds to the monotonically decreasing eigenvalues of the covariance matrix. In practice, the first principal component describes the linear combination of experimental variables that accounts for the greatest amount of variability across the experimental space, the second principal component accounts for the next greatest amount of variability, and so on for all the principal components. Typically, only the first 2–5 principal components are actively investigated, as they usually account for most variability across the experimental space. This analysis was performed using SAS 9.2 procedure FACTOR and STATISTICA 8.
To test whether combining proteomics with clinical variables improves prediction of patient mortality, we used the generalized additive model (GAM). GAM uses a backfitting algorithm within a Newton–Raphson technique. GAMs are data‐driven modeling approaches used to identify nonlinear relationships between predictive features and clinical outcome when a large number of independent variables exists. 10 , 11 We used SAS 9.2 PROC GAM and STATISTICA 8.0 to fit the GAM fittings with binary logit link function, applying multiple types of smoothers with automatic selection of smoothing parameters.
Because the data contained mostly nonlinear relationships between variables, we used multivariate adaptive regression splines (MARS), which is a nonparametric method using piecewise linear spline functions (basis functions) as predictors. 12 The MARS model is constructed in two stages. In the first stage, basis functions are added until a prespecified number are included. In the second stage, basis functions are deleted starting with the basis function that contributes the least to the model until an optimum model is reached. By allowing the model to take on many forms as well as interactions, we can use MARS to track the very complex data structures that are of en present in high‐dimensional data. Cross‐validation techniques were used within MARS to avoid overfitting the classification model. The optimal model selected is the one with the lowest generalized cross‐validation score. Finally, to cross‐validate the results of the gold standard clinical predictor model (i.e., TBSA, presence of inhalation injury, and age), we used a maximum of nine basis functions, allowed up to two‐way interactions, and used 10‐fold cross‐validation. For the combined clinical predictor and proteomics feature model, we allowed for up to 30 basis functions, permitted up to two‐way interactions, and selected the optimal model by using 10‐fold cross‐validation (Salford Systems, Inc.).
Results
Patient characteristics
Of the 332 patients, 288 survived at 1 year after injury ( Table 1 ). Survivors were younger (8 ± 5 years vs. 9 ± 6 years of age; p≤ 0.05), less severely burned (59 ± 16% TBSA vs. 78 ± 14% TBSA, 47 ± 23% third degree vs. 70 ± 22% third degree; both p≤ 0.05), and predominantly male (71% vs. 52%; p≤ 0.05).
Table 1.
Clinical characteristics of the patient population.
| Characteristic | Survivors | Nonsurvivors | p Value |
|---|---|---|---|
| Total (n) | 288 | 44 | |
| Age (years) | 8 ± 5 | 9 ± 6 | ≤ 0.05 |
| Gender (% Male) | 71% | 52% | ≤ 0.05 |
| Burn to admit (days) | 2 ± 2 | 2 ± 2 | n.s. |
| TBSA (%) | 59 ± 16 | 78 ± 14 | ≤ 0.05 |
| Third‐degree burn (%) | 47 ± 23 | 70 ± 22 | ≤ 0.05 |
| Type of burn (%) | n.s. | ||
| Flame | 76% | 91% | |
| Scald | 16% | 5% | |
| Electrical | 5% | 2% | |
| Electrical/flame | 3% | 2% | |
| Length of stay (days; survivors) | 37 ± 24 | ||
| Time of death (days; nonsurvivors) | 41 ± 40 | ||
| Inhalation injury (%) | ≤ 0.05 | ||
| Yes | 52% | 89% | |
| No | 48% | 11% |
Data are expressed as mean ± S.D. TBSA = total burn surface area.
Serum analyte concentrations differ between survivors and nonsurvivors
Levels of six cytokines significantly differed between the two outcomes. IL‐4, IL‐12p70, and IL‐13 were higher in survivors than in nonsurvivors ( Table 2 ). The reverse was true for IL‐10, IL‐5, and MCP‐1. Both ALT and AST were higher in nonsurvivors, indicating that a component of liver injury adversely affects outcome. BUN and creatinine values were also higher in nonsurvivors, suggesting that these individuals have a slightly greater degree of intravascular fluid depletion.
Table 2.
Descriptive statistics for proteomics measurements.
| Proteomic measurement | Survivors (n= 288) | Nonsurvivors (n= 44) | p Value (FDR) | |
|---|---|---|---|---|
| Cytokines | ||||
| IL‐4 (pg/mL) | 19.2 ± 196 | 8.92 ± 21 | 0.03 | |
| IL‐10 (pg/mL) | 42 ± 149 | 215 ± 673 | 0.01 | |
| IL‐5 (pg/mL) | 2.2 ± 9 | 2.5 ± 4 | 0.04 | |
| IL‐12p70 (pg/mL) | 27 ± 375 | 10 ± 32 | 0.02 | |
| IL‐13 (pg/mL) | 8.8 ± 69 | 5.9 ± 11 | 0.03 | |
| MCP‐1 (pg/mL) | 379 ± 540 | 1295 ± 3330 | 0.04 | |
| Clinical chemistries | ||||
| ALT (U/L) | 51 ± 58 | 72 ± 80 | 0.04 | |
| AST (U/L) | 97 ± 142 | 177 ± 235 | <0.0001 | |
| ALP (U/L) | 90 ± 45 | 82 ± 70 | 0.03 | |
| BUN (mg/dL) | 14 ± 11 | 24 ± 17 | <0.0001 | |
| SERCRE (ng/dL) | 0.6 ± 0.4 | 1.2 ± 1.1 | <0.0001 | |
| totBIL (ng/dL) | 0.9 ± 0.8 | 1.3 ± 1.2 | 0.04 | |
| a2Macro (ng/dL) | 147.04 ± 62.8 | 121.12 ± 42.75 | 0.04 | |
| Hap (ng/mL) | 122 ± 83 | 86 ± 71 | 0.03 |
Cytokines and clinical chemistries (expressed as mean ± S.D.) were measured in serum samples collected upon entry into the study. Only those that significantly differed between groups are shown. Comparisons were performed on log2‐transformed data using a two‐tailed t‐test, with adjustment for false discovery rate (FDR). a2Macro =α‐2 macroglobulin; ALP = alkaline phosphatase; ALT = alanine aminotransferase; AST = aspartate aminotransferase; BUN = blood urea nitrogen; Hap = Haptoglobin; IL = interleukin; MCP‐1 = monocyte chemoattractant protein‐1; SERCRE = serum creatinine; totBIL = total bilirubin.
Proteomics measurements provide independent information on burn mortality
PCA was conducted, with the first two principal components b eing used to plot the dat a ( Figure 1 ). The corresponding loading values of the experimental variables are shown in Table 3 . Principal component 1 accounted for 27% of the variability across the experimental space and had heavy loadings (i.e., eigenvector elements ≥ 0.5) on IL‐2, IL‐4, IL‐6, IL‐10, GM‐CSF, IL‐12, and G‐CSF ( Table 3 ). Principal component 2 explained an additional 16% of the variability. Principal component 2 had heavy loadings on the percentage TBSA and percentage third‐degree burn ( Table 3 ). These data suggest that cytokine measurements provide significant additional information over that obtained using only the gold standard clinical variables.
Figure 1.
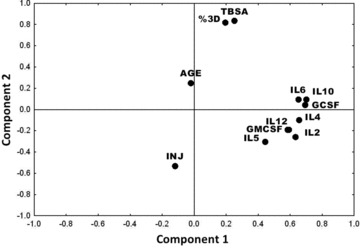
Principal component analysis. Loading of each variable on component 2 is plotted on the vertical dimension, whereas loading on component 1 is plotted on the horizontal dimension. Note that the two dimensions pass through two major clusters: proteomics variables and clinical variables [total burn surface area (TBSA), percentage third‐degree burn (percentage 3D), inhalation injury (INJ), and age].
Table 3.
Principal component analysis.
| Variable | Component 1 | Component 2 |
|---|---|---|
| TBSA (%) | 0.25 | 0.83 |
| Third‐degree burn (%) | 0.20 | 0.82 |
| Age | —0.02 | 0.25 |
| Inhalation injury | —0.12 | —0.53 |
| IL‐2 | 0.63 | —0.26 |
| IL‐4 | 0.66 | —0.1 |
| IL‐6 | 0.65 | 0.09 |
| IL‐10 | 0.70 | 0.10 |
| GM‐CSF | 0.58 | —0.19 |
| IL‐5 | 0.45 | —0.30 |
| IL‐12 | 0.60 | —0.19 |
| G‐CSF | 0.70 | 0.04 |
| Explained variance | 3.23 | 1.97 |
| Proportion | 27% | 16% |
The major loading values for each principle component are shown. Note that the cytokine values have significant loading values (> 0.5) for principle component 1, whereas percentage TBSA and third‐degree burn have signifi cant loading values for principle component 2. G‐CSF = granulocyte colony‐stimulating factor; GM‐CSF = granulocyte‐macrophage colony‐stimulating factor; IL = interleukin; TBSA = total burn surface area.
Proteomics feature analysis by data‐driven estimations
To determine which modeling method provides the best performance on these data, we analyzed the linear and spline components of the proteomics measurements by GAM. Mg2+ and AST have significant spline components, indicating that they do not satisfy classical assumptions for the use of linear modeling ( Table 4 ). Thus, modeling methods that assume global linear relationships, such as logistic regression, will not effectively capture information in the proteomics measurements. For this reason, we applied a nonparametric modeling approach, the MARS method.
Table 4.
Linear analysis versus nonparametric modeling.
| Variable | Linear (p Value) | Spline (p Value) |
|---|---|---|
| ALB | 0.1457 | 0.1008 |
| TBSA | <0.0001 | 0.5038 |
| Mg2+ | 0.2388 | 0.0072a |
| BUN | <0.0001 | 0.5757 |
| IL‐5 | 0.0476 | 0.2873 |
| MCP1 | 0.0063 | 0.0738 |
| IL‐4 | 0.0085 | 0.2174 |
| AST | 0.0008 | 0.0020a |
| a2Macro | 0.0107 | 0.0697 |
Shown are the linear and spline components of a GAM for each predictive variable. ALB = albumin. a p< 0.05 indicates the spline component is statistically significant.
MARS modeling of burns outcome
Two predictive models for burn mortality were evaluated using MARS: (1) the clinical gold standard, which includes values for age, percentage burn, and presence of inhalation injury and (2) a combination of proteomics measurements and the clinical gold standard. The best MARS results for the first model, as selected by the model with the lowest generalized cross‐validation score, produced an overall accuracy of 88% ( Table 5 ). Variable importance is a relative measurement of a variable's contribution to the overall model performance. The variable importance for the optimal model was percentage burn (100%), inhalation injury (71%), and age (46%). This result is consistent with earlier logistic regression models, which showed that percentage burn is a major predictor of nonsurvival. However, because nonsurvivors constituted only a small proportion of the data, this model was only 52% correct in its prediction of nonsurvivors ( Table 5 ). The calculated sensitivity for this test was 92.8%, and the specificity was 56.1%. The second MARS model, selected as that with the lowest generalized cross‐validation score, was significantly better than the first, producing an overall accuracy of 95%. For the small nonsurvivor group, this MARS model with the combined features produced 81% accuracy, a substantial gain over the first model ( Table 5 ). The calculated sensitivity for this test was 97.2%, and the specificity increased to 76.6%.
Table 5.
Accuracy of the gold standard clinical predictor model as well as the clinical and proteomic predictor model.
| Gold standard predictor model* | |||
|---|---|---|---|
| Class | Total | Prediction | |
| Survivor (n= 288) | Nonsurvivor (n= 13) | ||
| Survivor | 288 | 270 | 18 |
| Nonsurvivor | 44 | 21 | 23 |
| Total | 332 | Correct = 93.8% | Correct = 52.3% |
| Clinical and proteomic predictor model† | |||
| Class | Total | Prediction | |
| Survivor (n= 288) | Nonsurvivor (n= 13) | ||
| Survivor | 288 | 277 | 11 |
| Nonsurvivor | 44 | 8 | 36 |
| Total | 332 | Correct = 96% | Correct = 81% |
*The percentage TBSA, age, and the presence of inhalation injury were used as features in MARS. Model selection was by 10‐fold cross‐validation. The variable importance in the final model was percentage TBSA (100%), the presence of inhalation injury (71%), and age (46%). †The clinical gold standards (percentage TBSA, age, and the presence of inhalation injury) and proteomics measurements were used as features in MARS modeling. Model selection was by 10‐fold cross‐validation.
The performance of the two MARS models was compared using the area under the receiver operating characteristic (ROC) curve. For each model, the sensitivity versus 1‐specificity was calculated and plotted. In ROC analysis, a diagonal line starting at zero indicates that the output is a random guess. On the other hand, an ideal classifier with a high true positive rate and a low false positive rate will produce a positively oriented curve that bends strongly toward the upper lef quadrant of the plot. 13 The area under the curve (AUC) is a scalar value between 0.5 and 1.0, and it is equivalent to the probability that two cases, one chosen at random from each group, are correctly ordered by the classifier. 14 The ROC curve for the combined proteomics MARS model was significantly shifted up and to the lef of the ROC curve produced by the clinical data‐only MARS model ( Figure 2 ). The AUC for the clinical data‐only MARS model was 0.82, whereas that for the combined proteomics model was 0.95. Together, these data indicate that proteomics data significantly enhance model performance over that yielded by clinical assessments alone.
Figure 2.
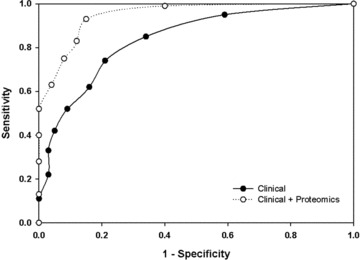
Receiver operating characteristic (ROC) analysis. ROC curves are shown for MARS modeling using clinical features (filled circle) and a combination of proteomics data and clinical features (open circles). Note that the ROC curve for the combined MARS model is shifted upward and toward the upper left quadrant.
Features predictive of burn mortality
The most informative features in the combined MARS model were identified by ranking the variable importance on a percentile scale. The six most significant features in the combined MARS model were percentage TBSA (100%), MCP‐1 (59.55%), presence of inhalation injury (56.83%), albumin (54.03%), Mg2+ (45.20%), and α2‐macroglobulin (51.46%; Table 6 ). Discriminant analysis was also used to identify features that related highly to outcome. This analysis showed that percentage TBSA, presence of inhalation injury, α2‐macroglobulin, and other variables were linearly related to outcome according to a chi‐square test, whereas the cytokine levels were not ( Table 6 ). The predictive features and their interactions that generated the MARS basis functions used in the combined proteomics model are shown in Table 7 .
Table 6.
Features important in the combined proteomics‐clinical assessment MARS model, as assessed by variable importance and discriminant analysis.
| Feature | Variable importance (MARS, %) | Discriminant analysis (χ2) |
|---|---|---|
| TBSA | 100 | ≤0.000001 |
| MCP‐1 | 60 | n.s. |
| Inhalation injury | 57 | ≤0.00001 |
| ALB | 54 | n.s. |
| a2Macro | 51 | ≤0.002 |
| Mg2+ | 45 | n.s. |
| BUN | 43 | ≤0.001 |
| Age | 41 | n.s. |
| AST | 33 | ≤0.0001 |
| Glu | 31 | n.s. |
| ALP | 31 | n.s. |
| IL‐5 | 30 | n.s. |
| IL‐4 | 27 | 0.02 |
| ALT | 22 | n.s. |
| SERCRE | 0 | ≤0.001 |
| alaG | 0 | ≤0.01 |
| totBIL | 0 | ≤0.01 |
| APOal | 0 | ≤0.04 |
| EST | 0 | ≤0.04 |
| IL‐13 | 0 | ≤0.02 |
| IL‐12 | 0 | ≤0.03 |
a1aG =α1‐acid glycoprotein; APOa1 = apolipoprotein A1; EST = estradiol; Glu = glucose.
Table 7.
Basis functions (BFs) for the MARS model.
| Bm | Definition | am | Clinical and proteomics variable descriptor |
|---|---|---|---|
| BF2 | (75 – TBSA)+ | −0.00 | % TBSA |
| BF3 | (INJ – 3.35E‐009)+*(TBSA – 75)+ | −0.05 | INJ –% TBSA |
| BF4 | (a2Macro – 5.49)+*(TBSA – 75)+ | −0.02 | a2Macro –% TBSA |
| BF5 | (ALB – 1.39)+*(TBSA – 75)+ | 0.12 | ALB –% TBSA |
| BF6 | (1.39 – ALB)+*(TBSA – 75)+ | 0.04 | ALB –% TBSA |
| BF7 | (MCP‐1 – 11.10)+ | 0.30 | MCP‐1 |
| BF9 | (BUN – 5.58)+*(11.11 – MCP‐1)+ | 0.51 | BUN – MCP‐1 |
| BF11 | (Age – 3.31)+* (TBSA – 75)+ | 0.00 | Age –% TBSA |
| BF13 | AST – 7.03)+* (TBSA – 75)+ | −0.04 | AST –% TBSA |
| BF15 | (Glu – 6.97)+* (TBSA – 75)+ | 0.05 | Glu –°/o TBSA |
| BF17 | (Mg2+– 1.07)+ | 1.57 | Mg2+ |
| BF19 | (ALP – 5.21)+*(1.07 – Mg2+)+ | −0.15 | ALP – Mg2+ |
| BF20 | (5.21 – ALP)+*(1.07 – Mg2+)+ | 2.18 | ALP – Mg2+ |
| BF21 | (ALP – 7.61)+*(11.11 – MCP‐1)+ | 0.10 | ALP – MCP‐1 |
| BF23 | (IL‐4 + 16.61)+*(TBSA – 75)+ | 0.00 | IL‐4 –% TBSA |
| BF24 | (ALT – 5.11)+*(TBSA – 75)+ | 0.03 | ALT –% TBSA |
| BF26 | (IL‐5 + 2) *(1.07 – Mg2+) | 0.09 | IL‐5 – Mg2+ |
| BF28 | (AST – 9.06)+ | 0.40 | AST |
| BF30 | (Age – 0.53)+*(Mg2+– 1.07)+ | −0.15 | Age – Mg2+ |
ALB = albumin; am= bas is function coefficient; Bm= basis function; INJ = inhalation injury; TBSA = total burn surface area; (y)+= max(0,y); *= basis function interaction.
Discussion
Multiple models have been created to better predict burn mortality. In the 1960s Professor Serge Baux devised the Baux score for predicting mortality postburn (Percent Mortality = Age + Percent body burned). Older patients tend to have poorer outcomes than younger patients with comparable injuries. Moreover, patients with larger burns tend to do worse than patients with smaller burns. Like age and burn size, inhalation injury is an independent risk factor for mortality. 15 , 16 Our group showed that outcome can be predicted in only 51% of patients using age, burn size, and presence of inhalation injury. 17 Models incorporating variables such as resuscitation, packed‐cell volume at admission, base deficit, serum osmolarity, sepsis, inotropic support, platelet count, creatinine, and ventilator dependency with age, burn size, and inhalation injury make it possible to predict survival in massive pediatric burns (>80% TBSA) with a high degree of accuracy. In adults, the FLAMES score (Fatality by Longevity, APACHE II score, Measured Extent of burn, and Sex) can better predict mortality than Smith's score (Age, TBSA, and presence of inhalation injury) or the Age‐Risk score (Age and TBSA) 18 by using age, APACHE II score, percentage partial thickness burn, percentage full thickness burn, and sex to determine hospital mortality risk. However this model is undermined by the absence of inhalation injury, which has been associated with an eightfold increase in mortality. 16 In recent years, attempts have been made to incorporate patient's coagulation and inflammatory parameters into standard clinical indices to better predict mortality. 19
Because multiorgan failure is associated with a systemic inflammatory reaction mediated by cytokines and acute phase proteins, we explored whether the relative abundance of these and other factors could be used to improve the accuracy of patient outcome prediction based on clinical correlates. We deliberately chose a clinically noisy dataset to identify factors indicative of survival that are applicable to either gender and are robust enough to overcome the variation inherent in a patient population covering a large age range, differences in postburn admission, and differences in burn size and severity. To achieve this, we did not match the two patient cohorts (survivor and nonsurvivor) by any variable (e.g., age, burn size, inhalation injury status). We only restricted the analyses to blood samples collected between the time of admission and of the first operation (typically within the first 24 hours of admission). The analytes selected for this study were measured using clinical laboratory tests that are typically performed as part of routine clinical care or in the case of the cytokines, analytes that can be easily measured using standard clinical laboratory equipment. All can be measured within 6 hours of serum isolation, allowing for rapid assessment of patient status.
Despite differences in the patient population (nonsurvivors were older, with a higher percentage of females, greater incidence of inhalation injury, and larger, more severe burns), we identified a series of analytes that significantly differed between survivors and nonsurvivors at admission. We then identified a set of analytes that improved prediction of patient outcome. AST, ALT, BUN, creatinine, IL‐4, IL‐12p70, IL‐13, IL‐10, IL‐5, and MCP‐1 signif cantly differed between surviving and nonsurviving patients ( Table 2 ). These differences reflect severe immune dysfunction, hypovolemia, and renal and/or liver dysfunction that occur as patients become septic or develop multiorgan failure, outcomes that result in death. The differences in the analytes were found early during the acute period and before the onset of sepsis or multiorgan failure, so they may actually be predictive of these events. Further studies are needed to address this possibility.
PCA is a linear transformation technique and an unsupervised clustering procedure. The total commonality of the principal components was only 47%, which explained only a small portion of total variation in PCA. The GAM and MARS techniques, however, are supervised transformation techniques that extend the nonlinear association between the predictor and response variables. The unexplained variability can be better estimated by the nonlinear portion using MARS modeling when the model performance is compared using ROC or the overall accuracy of the models. Heterogeneity can also be examined using a generalized additive linear mixed model to take into account the unexplained variability in the models. The nonlinear model fit was better than the linear model without a smoothing function, according to the models’ Akaiki Information Criterion.
Using MARS modeling with clinical variables as the sole independent variables, we found that the outcome prediction accuracy was 93.8% in surviving patients. However, prediction accuracy was only 52.3% for nonsurviving patients. Including serum analyte proteomics data in the MARS model markedly improved predictive capability, allowing for accurate classification of 96% of survivors and 81% of nonsurvivors. Importantly, the area under the ROC curve also showed significant improvement, increasing to 0.95. This indicates that the overall combined model performs much better than the clinical variables‐only model ( Figure 2 ).
Although biological rationalization of the elements within a MARS model is difficult, inspection of the ranked variable importance provides useful information about the features that contribute most to the model. Not surprisingly, percentage TBSA emerged as the single most important predictor ( Table 6 ). Of the cytokines and liver proteins, MCP‐1 and α2 macroglobulin contributed most significantly to model performance. Both proteins also significantly differed between survivors and nonsurvivors ( Table 2 ).
In addition to having superior performance on nonparametric data, MARS is able to capture feature interactions. Inspection of the MARS basis functions showed that TBSA had a significant interaction with the presence of inhalation injury, age, IL‐4, and measures of liver function including α2 macroglobulin, albumin, AST, and ALT ( Table 7 ). These data suggest that, in the group having the greatest percentage TBSA, the concomitant increase in age, liver injury, or IL‐4‐mediated inflammation produces a synergistic interaction that adversely affects outcome.
The goal of this study was to demonstrate that proteomics data could be used to improve upon the prediction model typically used to estimate whether a burn patient will survive. The fact that this new model was able to detect significant differences between nonsurvivors and survivors in our unique patient population should stimulate further testing of these findings. Independent validation of this model will be necessary before this biosignature is clinically implemented to predict patient outcome. As this study was performed in children, expanding the current findings to include adult burn patients is warranted given that postburn mortality significantly increases with age.
Acknowledgments
This work was supported, in part, by NIH grants [1U54RR02614 UTMB CTSA (A.R.B.), R01‐GM56687 (D.N.H.), P50‐GM60338 (D.N.H.), T32‐GM08256 (D.N.H.)], Shriners Hospitals for Children grants [8740 (C.C.F.), 8660 (M.G.J.), 8760 (D.N.H.), 71009 (D.N.H.), 84080 (D.N.H.)], and National Institute for Disabilities and Rehabilitation Research grants H133A070026 and H133A70019 (D.N.H.). C.C.F. is an ITS Career Development Scholar supported, in part, by NIH KL2RR029875 and NIH UL1RR029876 (A.R.B). We would like to thank the following research staff for their help and assistance: Deb Benjamin, Wes Benjamin, Joanna Huddleston, Lucy Robles, Sylvia Ojeda, Rosa Chapa, Guadalupe Jecker, Mary Kelly, Karen Henderson, Maria Magno, Liz Montemayor, Gabriela Kulp, and Maricela Pantoja. We also thank Kasie Cole‐Edwards for her critical review of this work and Eileen Figueroa and Steven Schuenke for their wonderful assistance in manuscript preparation.
References
- 1. Brigham PA, McLoughlin E. Burn incidence and medical care use in the United States: estimates, trends, and data sources. J Burn Care Rehabil. 1996; 17 (2): 95–107. [DOI] [PubMed] [Google Scholar]
- 2. Shirani KZ, Pruitt BA, Jr. , Mason AD Jr. The influence of inhalation injury and pneumonia on burn mortality. Ann Surg. 1987; 205 (1): 82–87. [DOI] [PMC free article] [PubMed] [Google Scholar]
- 3. Jeschke MG, Kulp GA, Kraft R, Finnerty CC, Mlcak R, Lee JO, Herndon DN. Intensive insulin therapy in severely burned pediatric patients: a prospective randomized trial. Am J Respir Crit Care Med. 2010; 182 (3): 351–359. [DOI] [PMC free article] [PubMed] [Google Scholar]
- 4. Jeschke MG, Gauglitz GG, Kulp GA, Finnerty CC, Williams FN, Kraft R, Suman OE, Mlcak RP, Herndon DN. Long‐term persistance of the pathophysiologic response to severe burn injury. PloS one 2011; 6 (7): e21245. [DOI] [PMC free article] [PubMed] [Google Scholar]
- 5. Jeschke MG, Chinkes DL, Finnerty CC, Kulp G, Suman OE, Norbury WB, Branski LK, Gauglitz GG, Mlcak RP, Herndon DN. Pathophysiologic response to severe burn injury. Ann Surg. 2008; 248 (3): 387–401. [DOI] [PMC free article] [PubMed] [Google Scholar]
- 6. Finnerty CC, Herndon DN, Chinkes DL, Jeschke MG. Serum cytokine differences in severely burned children with and without sepsis. Shock. 2007; 27 (1): 4–9. [DOI] [PubMed] [Google Scholar]
- 7. Finnerty CC, Herndon DN, Jeschke MG. Inhalation injury in severely burned children does not augment the systemic inflammatory response. Crit Care. 2007; 11 (1): R22. [DOI] [PMC free article] [PubMed] [Google Scholar]
- 8. Finnerty CC, Herndon DN, Przkora R, Pereira CT, Oliveira HM, Queiroz DM, Rocha AM, Jeschke MG. Cytokine expression profile over time in severely burned pediatric patients. Shock. 2006; 26 (1): 13–19. [DOI] [PubMed] [Google Scholar]
- 9. Benjamini YH, Y. Controlling the false discovery rate: a practical and powerful approach to multiple testing. J R Stat Soc Series B Stat Methodol. 1995; 57 (1): 289–300. [Google Scholar]
- 10. Austin P. A comparison of regression trees, logistic regression, generalized additive models, and multivariate adaptive regression splines for predicting AMI mortality. Stat Med. 2007; 26: 2937–2957. [DOI] [PubMed] [Google Scholar]
- 11. Hastie TT, Tibshirani R. Generalized additive models for medical research. Stat Methods Med Res. 1995; 4(3): 187–196. [DOI] [PubMed] [Google Scholar]
- 12. Friedman J. Multivariate adaptive regression splines. Ann Stat. 1991; 19 (1): 1–67. [Google Scholar]
- 13. Fawcett T. An introduction to ROC analysis. Pattern Recognit Lett. 2006; 27: 861–874. [Google Scholar]
- 14. Hanley JM, BJ. creceiver operating characteristic curve. Radiology 1982; 143 : 29–36. [DOI] [PubMed] [Google Scholar]
- 15. Lundgren RS, Kramer CB, Rivara FP, Wang J, Heimbach DM, Gibran NS, Klein MB. Influence of comorbidities and age on outcome following burn injury in older adults. J Burn Care Res. 2009; 30 (2): 307–314. [DOI] [PMC free article] [PubMed] [Google Scholar]
- 16. Smith DL, Cairns BA, Ramadan F, Dalston JS, Fakhry SM, Rutledge R, Meyer AA, Peterson HD. Effect of inhalation injury, burn size, and age on mortality: a study of 1447 consecutive burn patients. J Trauma. 1994; 37 (4): 655–659. [DOI] [PubMed] [Google Scholar]
- 17. Spies M, Herndon DN, Rosenblatt JI, Sanford AP, Wolf SE. Prediction of mortality from catastrophic burns in children. Lancet. 2003; 361 (9362): 989–994. [DOI] [PubMed] [Google Scholar]
- 18. Gomez M, Wong DT, Stewart TE, Redelmeier DA, Fish JS. The FLAMES score accurately predicts mortality risk in burn patients. J Trauma. 2008; 65 (3): 636–645. [DOI] [PubMed] [Google Scholar]
- 19. Park MS, Salinas J, Wade CE, Wang J, Martini W, Pusateri AE, Merrill GA, Chung K, Wolf SE, Hol‐comb JB. Combining early coagulation and inflammatory status improves prediction of mortality in burned and nonburned trauma patients. J Trauma. 2008; 64 (Suppl. 2): S188–S194. [DOI] [PubMed] [Google Scholar]