

Abstract
The genome-wide association studies (GWAS) designed for next-generation sequencing data involve testing association of genomic variants, including common, low frequency, and rare variants. The current strategies for association studies are well developed for identifying association of common variants with the common diseases, but may be ill-suited when large amounts of allelic heterogeneity are present in sequence data. Recently, group tests that analyze their collective frequency differences between cases and controls shift the current variant-by-variant analysis paradigm for GWAS of common variants to the collective test of multiple variants in the association analysis of rare variants. However, group tests ignore differences in genetic effects among SNPs at different genomic locations. As an alternative to group tests, we developed a novel genome-information content-based statistics for testing association of the entire allele frequency spectrum of genomic variation with the diseases. To evaluate the performance of the proposed statistics, we use large-scale simulations based on whole genome low coverage pilot data in the 1000 Genomes Project to calculate the type 1 error rates and power of seven alternative statistics: a genome-information content-based statistic, the generalized T2, collapsing method, multivariate and collapsing (CMC) method, individual χ2 test, weighted-sum statistic, and variable threshold statistic. Finally, we apply the seven statistics to published resequencing dataset from ANGPTL3, ANGPTL4, ANGPTL5, and ANGPTL6 genes in the Dallas Heart Study. We report that the genome-information content-based statistic has significantly improved type 1 error rates and higher power than the other six statistics in both simulated and empirical datasets.
Key words: genome, GWAS, rare variants, sequencing
Introduction
There is a consensus that common diseases are caused by an entire allele frequency spectrum of genetic variations, including common (MAF ≥5%), low frequency (1% < MAF ≤ 5%), and rare variants (MAF ≤ 1%). Scenarios in which genetic variants influence the development of diseases can be summarized as follows (Bansal et al., 2010; Bodmer and Bonilla, 2008; Ji et al., 2008; McClellan and King, 2010; Nejentsev et al., 2009; Pritchard and Cox, 2002; Schork et al., 2009): (1) one or multiple common variants in a genomic region are associated with a phenotype; (2) multiple rare variants in a region collectively play an important role in causing disease; and (3) rare variants and common variants jointly influence a phenotype. To systematically investigate the genetic architecture of common diseases requires full knowledge of the human DNA sequence variation across the full spectrum of allele frequencies and types of DNA alterations (Durbin et al., 2010; Manolio et al., 2009). Emerging “next-generation” sequencing technologies enable sequencing individual genomes and have the potential to discover the entire spectrum of sequence variations in a sample of well-phenotyped individuals (Collins, 2010; Kim et al., 2010; Kryukov et al., 2009; Li and Leal, 2008; Metzker, 2010; Nielsen, 2010; Shendure and Ji, 2008; Venter, 2010). Advances in sequencing technologies provide great opportunities to test for association of the entire spectrum of genetic variants with the disease. Despite their promise, however, these technologies have three defining features: identification of large numbers of rare variants, a high proportion of sequence errors, and large proportion of missing data. These features raise challenges for testing the association of entire spectrum of genetic variants with phenotypes of interest.
Traditional statistical methods for GWAS of common diseases have mainly focused on testing associations of a single common SNP with a disease one at a time (Purcell et al., 2007). Although substantial progress in GWAS of common diseases has been made, these methods are ill-suited for the large amounts of allelic heterogeneity present in sequence data. The critical barrier in association analysis of multiple rare variants in a defined genomic region or set of regions is as follows. First, although an individual rare variant may have a large genetic effect in causing disease, at the population level, their frequency difference between cases and controls is too small to detect (Bansal et al., 2010). Second, a gene may harbor multiple causal variants. They collectively have significant risk effects, but individually make only a small contribution to the development of the disease (McClellan and King, 2010). Third, new sequence technologies are highly error prone. Due to their large genotyping errors and low frequencies, the signal of rare alleles may be compatible with genotyping errors. Unless genotyping errors are properly taken into account, many multi-locus tests will be invalidated.
To overcome these limitations, several authors proposed group tests such as the collapsing methods, combined multivariate and collapsing (CMC) method, weighted sum statistics (WSS), variable-threshold (VT) approach, rare cover method, kernel-based adaptive cluster method, and regression and data-mining methods in which rare variants at different genomic positions are collapsed into multiple frequency bins, and we test their collective frequency differences between cases and controls (Bhatia et al., 2010; Li and Leal, 2008; Liu and Leal, 2010; Madsen and Browning, 2009; Morgenthaler and Thilly, 2007; Morris and Zeggini, 2010; Price et al., 2010). Although in many cases, group tests have higher power than the individual tests, they also suffer limitations. First, group tests ignore differences in genetic effects among SNPs at different genomic locations. Second, group tests do not leverage linkage disequilibrium (LD) in the data. Third, since sequence errors are cumulative when rare variants are grouped, group tests are sensitive to genotyping errors and missing data.
To overcome the limitations of group tests, we propose a genome continuum model for association studies. As Haldane (1919) and Fisher (1949) recognized in the last century, the genome can be modeled as a continuum. Specifically, the genome is not purely a collection of independent segregating sites. Rather, the genome is transmitted not in points, but in segments. Instead of modeling the genome as a few separated individual variant sites, modeling the genome as a whole will enrich information on genetic variation across the genome (Altshuler et al., 2008; Frazer et al., 2009; Guo, 1995). Viewing the genome as a continuum, a genetic variant profile of each individual in which the variants of the individual at different locations are recorded can be viewed as a realization of the stochastic process in the genome and modeled as a function of genomic location. Instead of testing association of SNP individually, we will develop methods for testing association of genome regions. The purpose of this report is to develop a novel genome information content-based statistic which employs enriched information on genetic variants in the genomic region and tests association of either common variants or rare variants or both common and rare variants by comparing difference in genome information content in the region between cases and controls. This will provide a unified statistic to test association of the entire allele frequency spectrum of genetic variants in a genomic region. To evaluate its performance, we use large-scale simulations based on a low coverage pilot dataset in the 1000 Genomes Project to compare type 1 error rates and power of the genome information content-based statistic with six other existing statistics for testing association of genetic variants. Further comparisons are carried out for empirical sequencing data from the Dallas Heart Study. A program for implementing the developed statistics can be downloaded from our website (www.sph.uth.tmc.edu/hgc/faculty/xiong/index.htm).
Methods
Genome information content
Let t be the position of a genetic variant along a chromosome or within a genomic region and T be the length of the genomic region being considered. For convenience, we rescale the region [0,T] to [0,1]. Because the density of genetic variants is high, we can view t as a continuous variable in the interval [0,1]. Assume that nA cases and nG controls are sampled and sequenced.
We define the genotype of the i-th case as
 |
(1) |
where M is a minor allele at the genomic position t. We can define a similar function 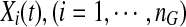 for the i-th control.
Next we define a haplotype profile. Assume that haplotypes of an individual in the genomic region are available. We define a haplotype function Yi(t) of the i-th case as
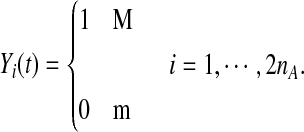 |
(2) |
We can similarly define a haplotype function Xi(t) for the i-th control.
The genotypic or haplotypic profiles Yi(t) and Xi(t) contain the information of the genetic variation and its relative genomic position, which influence the phenotypes. For convenience of discussion, Yi(t) and Xi(t) are referred to as the information content at the genomic position t. Their integral  summarizes the information content of the genome in the region. It is a useful measure of the genetic variability of a genome region. By stochastic calculus, we can obtain the variance of the integral of the genome information content:
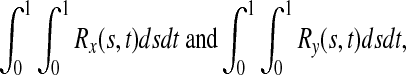 |
where Rx(s,t) and Ry(s,t) are the covariance functions for X(t) and Y(t) between two loci s and t, respectively. Suppose that at the genomic positions si and tj there are SNPs Mi and Mj. Then, Rx(si,tj) and Ry(si,tj) are the measure of linkage disequilibrium between Mi and Mj in controls and cases, respectively.
Test statistic
If a segment of the genome is associated with a disease, the genome information content in the region between cases and controls should be different. Similar to comparing the differences in allele or haplotype frequencies between cases and controls in the standard association tests, we compare the differences in genome information content between cases and controls. This motivates us to develop the following statistic to test for association of a genomic region with disease:
(i) for genotype
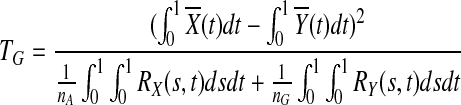 |
(3) |
(ii) for haplotype
 |
(4) |
where nA and nG are the number of sampled cases and controls, respectively,  and
and  are the average of the genomic information content in the controls and cases, respectively, RX(s,t) and RY(s,t) are covariance functions between two variant sites s and t in controls and cases, respectively. Under the null hypothesis of no association of a genomic region (or gene) with the disease, the statistics TG and TH are asymptotically distributed as a central
  distribution. This is intuitively reasoned as follows. For fixed t, by central limit theorem,
  and
and  are asymptotically distributed as a normal distribution. By definition,
  can be approximated by
 |
Since  is asymptotically normal distributed and Δ(tj) is a constant,
  is also normally distributed. Therefore, sum of normally distributed random variables
 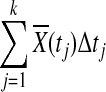 is also normally distributed. In the limit,
  is asymptotically normally distributed with mean
  and variance
  (Henderson and Plaschko, 2006). Similarly,
  is also asymptotically distributed as a normal variable with mean
  and variance
 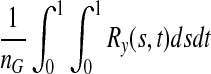 . Under the null hypothesis of no association,
  and
and  are equal. Therefore,
 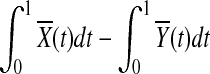 is asymptotically distributed as a normal variable with mean zero and variance
 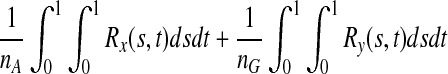 which implies that
 |
is asymptotically distributed as a standard normal variable. Thus, TG = u2 is asymptotically distributed as a central  distribution. Similarly, this will hold for TH.
In practice, the integrals in equations (3) and (4) are approximated by numerical integration. Consider a sequence of markers in the genomic region:  located at the genomic positions
  . Let
. Let  and
and  be the frequency of the minor allele at the marker locus Mi in cases and controls, respectively, DA(si,tj) and DG(si,tj) be the measure of linkage disequilibrium (LD) between the markers Mi and Mj located at the genomic positions Si and tj in cases and controls, respectively,
  and
and  be the age of occurrence of LD between the markers Mi and Mi+1 in cases and controls, respectively,
  and
and  be the measure of LD between the markers Mi and Mi+1 in cases and controls, respectively, and
  and
and  be their initial values. The genetic distance between the markers Mi and Mi+1 in cases and controls are denoted by
  and
and  , respectively. The statistic TH can be approximated by the numerical integration:
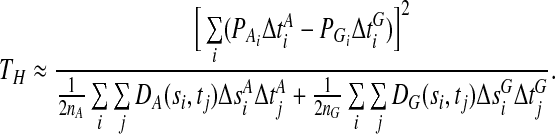 |
(5) |
The measure of LD between the markers is a function of the physical distance between the markers. Therefore, it can be shown that the genetic distance can be approximated by
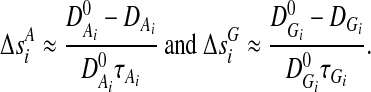 |
Therefore, TH is a nonlinear function of the allele frequencies and all pair-wise LD between SNPs within the region of interest. It is also true for TG, but with a more complicated expression than equation (5).
Results
Null distribution of test statistics for both rare and common variants
To examine the validity of the null distribution of the test statistics in testing the association of a set of rare variants in a genomic region, we performed a series of simulation studies. MS software (Hudson, 2002) was used to generate a population of 1,000,000 chromosomes with 100 loci under a neutrality model. Forty loci with minor allele frequencies (MAF) between 0.0001 and 0.05 were used to calculate the type 1 error rate. A number of individuals, ranging from 3,000 to 5,000, each consisting of two chromosomes, was sampled from the population and equally assigned to cases and controls. A total of 5,000 datasets were generated and the proposed test statistics were performed for each dataset. Table 1 summarizes the type 1 error rates of the genomic information content-based test statistics for testing association of a genomic region with rare variants. It shows that the estimated type 1 error rates of two statistics for both genotype and haplotype functions were not appreciably different from the nominal levels α = 0.05, α = 0.01, and α = 0.001.
Table 1.
Type 1 Error Rates of the Genome Content-Based Statistics for Testing the Association of the Rare Variants in a Genomic Region with the Disease
| Sample size | Statistic | α = 0.001 | α = 0.01 | α = 0.05 |
|---|---|---|---|---|
| 3,000 | TG | 0.0014 | 0.0106 | 0.0528 |
| TH | 0.0014 | 0.0108 | 0.0536 | |
| 3,500 | TG | 0.0006 | 0.0098 | 0.0476 |
| TH | 0.0006 | 0.0096 | 0.0486 | |
| 4,000 | TG | 0.0010 | 0.0114 | 0.0476 |
| TH | 0.0010 | 0.0110 | 0.0476 | |
| 4,500 | TG | 0.0016 | 0.0102 | 0.0526 |
| TH | 0.0016 | 0.0102 | 0.0528 | |
| 5,000 | TG | 0.0012 | 0.0098 | 0.0540 |
| TH | 0.0012 | 0.0106 | 0.0536 |
We also performed simulation studies to examine the validity of the null distribution of the test statistics in testing the association of a set of common variants in a genomic region. SNaP software (Nothnagel, 2002) was used to generate a population of 1,000,000 chromosomes with 40 SNPs. These loci all have a minor allele frequency (MAF) greater than 0.05. Two chromosomes were randomly sampled and assigned to one individual, yielding a population of 500,000 individuals. The number of individuals which were sampled for calculation of type 1 error rates ranged from 1,000 to 3,000, each with two chromosomes, and each individual was assigned equal probability to being a case or control. Datasets (n = 5,000) were generated, and the proposed genome information content-based test statistics were performed for each dataset. Table 2 summarizes the type 1 error rates of the test statistics for sample sizes 1,000, 1,500, 2,000 2,500 and 3,000. It shows that the estimated type 1 error rates of two statistics for both genotype and haplotype functions were not appreciably different from the nominal levels α = 0.05, α = 0.01, and α = 0.001.
Table 2.
Type 1 Error Rates of the Genome Information Content-Based Statistics for Testing the Association of Common Variants in a Genomic Region with the Disease
| Sample size | Statistic | α = 0.001 | α = 0.01 | α = 0.05 |
|---|---|---|---|---|
| 1,000 | TG | 0.0010 | 0.0126 | 0.0522 |
| TH | 0.0010 | 0.0128 | 0.0530 | |
| 1,500 | TG | 0.0010 | 0.0114 | 0.0530 |
| TH | 0.0008 | 0.0114 | 0.0526 | |
| 2,000 | TG | 0.0012 | 0.0106 | 0.0506 |
| TH | 0.0014 | 0.0104 | 0.0500 | |
| 2,500 | TG | 0.0008 | 0.0086 | 0.0490 |
| TH | 0.0008 | 0.0090 | 0.0486 | |
| 3,000 | TG | 0.0006 | 0.0104 | 0.0512 |
| TH | 0.0006 | 0.0100 | 0.0508 |
To further evaluate the performance of the genome information content-based statistics for testing association of a genomic region, we used large-scale simulations based on a low coverage pilot dataset with 60 individuals from a population of European ancestry in Utah (CEU) in the 1000 Genomes Project to compare its type 1 error rates with five other existing statistics for testing association of a genomic region. Specifically, the low coverage pilot data with whole genome sequencing of 60 individuals from the CEU in 1000 Genomes Project were used to generate a population of 1,000,000 chromosomes. To calculate type 1 error rates, we used a moving window of genomic regions along the genome, each region with 50 loci and 1% ≤MAF at each locus ≤5%, to simulate the data. A total of 3,000 individuals were sampled. Simulations were repeated 5,000 times. Figure 1 demonstrates the histogram of type 1 error rates of five statistics: the genome information-based statistic TG, the generalized T2, Collapsing method, CMC method, and the individual χ2 test for testing association of 11,200 genomic regions, with 1% ≤MAF at each locus <5% (low frequency variants), across the genome at significance level α = 0.05. Next we examine the type 1 error rates of the statistics for testing association of both common and rare variants. Since for the common variants, the percentage of individuals possessing any one of the variants in the collapsed set of variants could reach 100%, the collapsing method cannot be applied to testing association of both common and rare variants. Figure 2 shows the histogram of type 1 error rates of the genome information content-based statistic TG, the generalized T2, CMC method, and the individual χ2 test for testing association of the 45,600 genomic regions with both common and rare variants at significance level α = 0.05. The results for testing association of the genomic regions at significance level α = 0.01 are shown in Supplementary Figures 1 and 2 (Supplementary Material is available online at www.liebertonline.com/cmb). The genome information-based statistic TH has the similar results (data not shown). These results demonstrate that the estimated type 1 error rates of the statistic TG for testing association across 70% of genomes were not appreciably different from the nominal levels α = 0.05 and α = 0.01. However, the type 1 error rates of the other six statistics in a large proportion of the genomic regions were significantly deflated.
FIG. 1.

Histogram of type 1 error rates of the test statistics TG, T2, collapsing method, CMC method, and the individual χ2 test for testing association of all genomic regions (11,200 regions) across the genome, each region with 50 loci, 1% ≤MAF at each locus ≤5% (low frequency variants), at significance level α = 0.05. The red color indicates that type 1 error rates are within the range of nominal levels.
FIG. 2.

Histogram of type 1 error rates of the test statistics TG, T2, CMC method, and individual χ2 test for testing association of 45,600 genomic regions with both common and low frequency variants across the genome, each region with 50 loci, 1% ≤MAF at each locus ≤5%, at significance level α = 0.05. The red color indicates that type 1 error rates are within the range of nominal levels.
Power evaluation
To evaluate the performance of the genome information-based statistics for testing the association of a genomic region with disease, we used simulated data to estimate their power to detect a true association of a genomic region. Four disease models were considered: additive, dominant, recessive and multiplicative. To mimic the distribution of rare variants in a natural population and take the influence of LD structure among multiple genetic variants into account (Bansal et al., 2010), the low coverage pilot data with whole genome sequencing of 60 individuals from CEU in the 1000 Genomes Project were used to generate a population of 1,000,000 chromosomes (www.1000genomes.org/).
An individual's disease status was determined based on the individual's genotype and the penetrance for each locus. Let Ai be a risk allele at the i-th variant site. Let  be the genotypes aiai, Aiai, and AiAi, respectively, and fki be the penetrance of genotypes
  at the ith locus. The relative risk (RR) at the i-th variant site is defined as
  and
and  , where f0i is the baseline penetrance of the wild-type genotype at the i-th variant site. We assume that for the additive disease model, R2i =2R1i −1; for the dominant disease model, R2i=R1i; for the recessive disease model, R1i = 1; and for the multiplicative disease model,
  . The relative risks across all variant sites are assumed to be equal and the variants were assumed to influence disease susceptibility independently (i.e., no epistasis).
Each individual was assigned to the group of cases or controls depending on their disease status. The process for sampling individuals from the population of 1,000,000 haplotypes was repeated until the desired samples of 3,000 cases and 3,000 controls or 5,000 cases and 5,000 controls, or 10,000 cases and 10,000 controls were reached for each disease model. For each genomic region, simulations were repeated 5,000 times. Power is defined as the fraction of 5,000 simulations on which the test met the p-value cut-off. To select appropriate relative risk for power simulations we studied 1,256 disease susceptibility loci in the literature. The average value of relative risk for common diseases is 1.5. Thus, in our simulations, we assumed two relative risks: 1.5 and 2.0. A baseline penetrance was assumed to be equal to 0.01. A moving window approach was used to simulate the power. Since a genomic region with a fixed size may contain few rare variants, we do not use the length to define the genomic region. Instead, each genomic region was defined as the region which has 150 variants, 10% or 20% of which were assumed to be causal variants in the sense that a causal variant influences disease susceptibility. Since these studies are carried out on model free, unannotated data, the causal variants were randomly assigned across the genomic region.
Figure 3 plots the histogram of power of the genome information content-based statistic TG, the generalized T2, collapsing method, CMC method (variants with frequencies ≤0.01 were collapsed), weighted sum statistic (WSS), and variable threshold (VT) statistic for testing association of 11,200 genomic regions, each region with 150 variants and 1% ≤MAF for each variant ≤5%, 10% of which were randomly selected as risk increasing variants with relative risk of 2, and individual χ2 test for testing association of a single rare SNP under additive, dominant, multiplicative and recessive disease models, respectively, at a nominal p-value cut-off of 0.05, assuming that 5,000 cases and 5,000 controls were sampled. Throughout this article, the number d in x axis indicates that the power is in the interval [d, d+0.1]. To further compare the power of the seven statistics, we present Table 3 (Supplementary Tables 1–3) where the number in each cell represents the percentage of the genome regions in which the power of the statistic in the column is higher than that of statistic in the row under the dominant model (the additive, multiplicative, and recessive models). In the tables, we assume that the parameters are the same as in the Figure 3. These statistics are ranked in power by TG, VT, WSS, CMC, the generalized T2, collapsing method, and the individual χ2 test.
FIG. 3.

Histogram of power of the genome information content-based statistic TG, generalized T2, collapsing method, CMC method, WSS and VT statistics for testing association of 11,200 genomic regions, each region with 150 rare variant loci, and 1% ≤MAF for each variant ≤5%, 10% of which were randomly selected as risk increasing variants with relative risk of 2, and the individual χ2 test for testing association of a single low frequency SNP under additive, dominant, multiplicative, and recessive disease models at the significance level α = 0.05, assuming that 5,000 cases and 5,000 controls were sampled.
Table 3.
Pair-Wise Power Comparison of Seven Statistics for Testing Association of Rare Variants Under Dominant Model
| Test statistic | Collapsing | T2 | CMC | WSS | VT | TG |
|---|---|---|---|---|---|---|
| Chi square | 76.54 | 82.48 | 90.04 | 92.54 | 94.77 | 98.72 |
| Collapsing | 76.43 | 63.43 | 86.22 | 91.54 | 95.47 | |
| T2 | 57.48 | 81.46 | 86.92 | 92.64 | ||
| CMC | 71.68 | 76.55 | 84.36 | |||
| WSS | 66.31 | 79.83 | ||||
| VT | 76.54 |
The results for testing association of rare variants with relative risks of 1.5 and 5,000 cases and 5,000 controls, and relative risks of 2 and 3,000 cases and 3,000 controls are shown in Supplementary Figures 3 and 4, respectively. These results demonstrate that the power distribution of the genome information content-based statistic TG is shifted toward power of 1, which implies that in most genomic regions the statistic TG has higher power than that of other statistics (Table 3 and Supplementary Tables 1–3). From these figures, we also can see that the individual χ2 statistic, collapsing and CMC methods have little power to detect association in most genomic regions. However, the statistic TG can reach power greater than 50% in the majority region of the genome and even can reach more than 70% power in the half of the genome under the dominant model.
Now we assess the power of the tests at the genome-wide level. Since the total number of genomic regions for testing association of rare variants is 11,200, the p-value cut-off for declaring genome-wide significance after the Bonferroni correction is P < 4.5 × 10⁻⁶. The total number of rare variants is 1,680,000, and hence the p-value cut-off of the individual χ2 statistic for declaring genome-wide significance is 3 × 10⁻⁸. If we consider significance at the genome-wide level, then for most genomic regions the power of all test statistics was poor (Supplementary Figure 5). To increase the power of the tests, we assumed that 20% of the 150 rare variants were causal and increased the sample sizes to 10,000. The power of seven statistics for testing association of a genomic region at the genome-wide level is shown in Figure 4. Three features can be observed from these figures. First, the individual χ2 test, collapsing, and CMC methods have little power to detect association of low frequency variants at the genome-wide level of 0.05 in more than 95% of the genome. Second, the proportion of the genome in which the WSS and VT statistics have higher than 50% power to detect association of low frequency variants at the genome-wide level of 0.05 was less than 1%. Third, the genome information content-based statistic has 60% or higher power to detect association of low frequency variants at the genome-wide level of 0.05 in about 10% of the genome under the assumed conditions and sample sizes.
FIG. 4.

Histogram of power of the genome information content-based statistic TG, the generalized T2, collapsing method, CMC method, WSS and VT statistics for testing association of 11,200 genomic regions, each region with 150 rare variant loci, and 1% ≤MAF for each variant ≤5%, 20% of which were randomly selected as risk increasing variants with relative risk of 2, and the individual χ2 test for testing association of a single low frequency SNP under additive, dominant, multiplicative, and recessive disease models at the genome-wide level α = 0.05, assuming 10,000 cases and 10,000 controls.
Next we evaluate their power for testing association of both common and rare variants. Figure 5 shows the histogram of power of the genome information content-based statistic TG, the generalized T2, CMC method (variants with frequencies ≤0.05 were collapsed), WSS, and VT statistic for testing association of 45,600 genomic regions, each region has 150 variants without restriction on the MAF, 10% of which were randomly selected as risk increasing variants with relative risk of 1.5, and the individual χ2 test for testing the association of a single SNP under the additive, dominant, multiplicative, and recessive disease models, respectively, at the significance level α = 0.05, assuming that 5,000 cases and 5,000 controls were sampled. Similar to testing association of rare variants, to further compare the power of seven statistuics for testing association of both common and rare variants, we present Table 4 (Supplementary Tables 4–6) where the number in each cell represents the percentage of genome regions in which the power of the statistic in the column is higher than that of statistic in the row under dominant model (the additive, multiplicative, and recessive models), assuming the same parameters as that in Figure 5. These results clearly demonstrate that the genome information content-based statistics have the best performance, followed by VT and WSS statistics. There is a clear gain in power for all statistics when jointly testing association of the entire allele spectrum of genomic variants. The genome information content-based statistics can reach at least 80% power at the significance level of 0.05 in more than 15% of the genome for the recessive disease models, and in about 40% of the genome for the dominant and multiplicative models. The results for testing association of both common and rare variants with relative risks of 2 and 3,000 cases and 3,000 controls, and 5,000 cases and 5,000 controls are summarized in Supplementary Figures 6 and 7, respectively.
FIG. 5.

Histogram of power of the genome information content-based statistic, the generalized T2, collapsing method, CMC method, WSS and VT statistics for testing association of 45,600 genomic regions, each region with 150 variants with no restriction on the MAF, 10% of which were randomly selected as risk increasing variants with relative risk of 1.5, and the individual χ2 test for testing association of a single SNP with any MAF under additive, dominant, multiplicative and recessive disease models at the significance level α = 0.05, assuming 5,000 cases and 5,000 controls.
Table 4.
Pair-Wise Power Comparison of Seven Statistics for Testing Association of Both Common and Rare Variants Under Dominant Model
| Test statistic | T2 | CMC | VT | WSS | TG |
|---|---|---|---|---|---|
| Chi square | 76.54 | 86.2 | 87.72 | 89.31 | 93.23 |
| T2 | 58.95 | 83.92 | 87.46 | 88.64 | |
| CMC | 77.37 | 81.57 | 89.36 | ||
| VT | 59.69 | 80.51 | |||
| WSS | 84.83 |
Next we investigate the power of the previous six statistics for testing association of genomic variants with any MAF at the genome-wide significance level. The total number of genomic regions for testing association of all genomic variants with any MAF is 45,600. Hence, the p-value cut-off of the statistics except for the individual χ2 statistic for declaring genome-wide significance after the Bonferroni correction is P < 1.1 × 10⁻⁶. The total number of SNPs across the genome is 6,840,000. The p-value cut-off of the individual χ2 statistic for declaring genome-wide significance after the Bonferroni correction is P < 7.3 × 10⁻⁹. The power of the test at the genome-wide significance level of 0.05 is defined as the fraction of 5,000 simulations on which the test met the p-value cut-off. The power of six statistics for testing association of all variants in the genomic region at the genome-wide level of 0.05, assuming 10% of 150 variants with relative risk of 2 to be causal variants, and 5,000 cases and 5,000 controls, is plotted in Figure 6. Our results highlight several features. First, in general, the genome information content-based statistics outperform other statistics. Second, even at the genome-wide level of 0.05, the genome information content-based statistics can reach at least 60% power and 70% power in 40% of the genome for additive, multiplicative and recessive disease models and almost half of the genome for dominant models, respectively. Third, the difference in power between the genome information content-based statistic and several group tests is most noticeable when the disease model is dominant and power was in the interval [60%, 90%]. We can observe the similar power pattern for other parameters. The results for the variants with relative risk of 2, and 3,000 cases and 3,000 controls are shown in Supplementary Figure 8.
FIG. 6.

Histogram of power of the genome information content-based statistic, the generalized T2, collapsing method, CMC method, WSS and VT statistics for testing association of 45,600 genomic regions, each region with 150 variants with no restriction on the MAF, 10% of which were randomly selected as risk increasing variants with relative risk of 2, and the individual χ2 test for testing association of a single SNP with any MAF under additive, dominant, multiplicative, and recessive disease models at the genome-wide level α = 0.05, assuming 5,000 cases and 5,000 controls.
Application to a real data example
To further evaluate their performance the seven statistics were applied to the ANGPTL3, 4, 5, and 6 sequence and phenotype data from the Dallas Heart Study (Romeo et al., 2007; Romeo et al., 2009). The total numbers of low frequency and rare variants with a minor allele frequency below 0.05 in the ANGPTL3, 4, 5, and 6 genes which were identified from 3,553 individuals were 49, 83, 91, and 66, respectively. To examine the phenotypic effects of the low frequency and rare variants in the ANGPTL3, 4, 5, and 6 genes, two groups of individuals with the lowest and highest quartiles of the six traits related to lipid metabolism were selected. The individuals with plasma triglyceride (Trig) levels less than or equal to the 25th percentile were classified as the lowest quartiles of the Trig and the individuals with plasma Trig greater than or equal to the 75th percentile were grouped as the highest quartiles of the Trig. We can similarly classify the individuals as the lowest and highest quartiles of high density lipoprotein cholesterol (HDL), low density lipoprotein cholesterol (LDL), total cholesterol, very low density lipoprotein cholesterol (VLDL), and body mass index (BMI). The p-values from the seven statistics for testing association of low frequency and rare variants in the ANGPTL3, 4, 5, and 6 genes with the six traits are summarized in Table 5, where for the CMC method, variants with an allele frequency below 0.005 were collapsed and the 1010 permutations for WSS and VT were carried out. The p-values for the individual χ2 test to declare association of the variants in the ANGPTL3, 4, 5, and 6 genes after the Bonferroni correction for multiple tests were p < 0.001, p < 6.02 × 10⁻⁴, P < 5.49 × 10⁻⁴ and P < 7.60 × 10⁻⁴, respectively. Table 5 clearly shows that the strong association of the ANGPTL3 with Trig and VLDL levels, the ANGPTL4 with BMI, Trig, VLDL, LDL and HDL levels, the ANGPTL5 with LDL levels were identified by the statistics TG, CMC (except for association of ANGPTL5 with LDL levels), WSS, and VT. We also observed that the individual χ2 test and T2 test identified strong association of the ANGPTL4 with Trig, VLDL and LDL levels. However, the P-values for the statistic TG were smaller than that of the other six statistics for all scenarios. In addition, we observed that all three statistics: TG, WSS and VT identified weak association of the ANGPTL4 with cholesterol, the ANGPTL5 with BMI, Trig, and VLDL levels; the ANGPTL6 with Trig, VLDL and HDL levels; and that the CMC method detected weak association of the ANGPTL5 with Trig and VLDL levels; and the ANGPTL6 with HDL levels, but their p-values were in the same magnitude. The collapsing method failed to detect associations in most scenarios.
Table 5.
The p-Values of Statistics for Testing Association of Rare Variants in the ANGPTL3, 4, 5, and 6 Genes with Six Traits in the Dallas Heart Study
| |
|
Test statistics |
||||||
|---|---|---|---|---|---|---|---|---|
| Phenotype | Gene name | Chi-square | T2 | Collapsing | CMC | WSS | VT | TG |
| BMI | ANGPTL3 | 4.26E-02 | 2.16E-01 | 1.95E-01 | 1.80E-01 | 1.34E-01 | 2.12E-01 | 7.38E-02 |
| ANGPTL4 | 2.70E-03 | 7.30E-03 | 2.84E-01 | 1.31E-05 | 2.38E-06 | 1.87E-06 | 7.55E-08 | |
| ANGPTL5 | 1.65E-02 | 1.58E-02 | 3.47E-01 | 1.03E-01 | 5.90E-03 | 9.80E-03 | 5.30E-03 | |
| ANGPTL6 | 8.32E-02 | 2.88E-01 | 7.06E-01 | 5.94E-01 | 1.38E-01 | 7.58E-02 | 4.35E-01 | |
| Cholesterol | ANGPTL3 | 4.37E-02 | 3.07E-01 | 5.40E-03 | 1.28E-01 | 4.05E-01 | 2.76E-01 | 2.60E-01 |
| ANGPTL4 | 1.60E-04 | 9.43E-02 | 3.99E-02 | 3.73E-02 | 4.09E-02 | 2.31E-02 | 9.60E-03 | |
| ANGPTL5 | 8.00E-03 | 3.10E-03 | 7.77E-01 | 8.74E-02 | 6.92E-02 | 3.26E-01 | 3.05E-02 | |
| ANGPTL6 | 5.07E-02 | 2.70E-01 | 7.42E-01 | 8.32E-02 | 9.70E-02 | 1.48E-01 | 1.08E-01 | |
| Trig | ANGPTL3 | 5.18E-07 | 1.40E-03 | 1.10E-01 | 1.48E-05 | 4.00E-04 | 2.00E-05 | 2.65E-06 |
| ANGPTL4 | 4.65E-08 | 5.60E-11 | 1.12E-02 | 5.33E-12 | 8.82E-09 | 3.87E-09 | 1.11E-13 | |
| ANGPTL5 | 1.40E-03 | 6.73E-04 | 6.88E-01 | 1.27E-03 | 3.20E-04 | 4.00E-04 | 1.58E-04 | |
| ANGPTL6 | 3.01E-02 | 1.47E-01 | 4.83E-01 | 1.71E-01 | 7.00E-03 | 2.02E-02 | 1.15E-02 | |
| VLDL | ANGPTL3 | 6.21E-07 | 1.60E-03 | 1.13E-01 | 1.94E-05 | 5.00E-04 | 5.00E-05 | 3.45E-06 |
| ANGPTL4 | 1.32E-07 | 5.40E-10 | 9.83E-02 | 6.89E-14 | <1.0E-10 | <1.0E-10 | 1.11E-15 | |
| ANGPTL5 | 2.34E-04 | 5.10E-03 | 8.96E-01 | 8.65E-03 | 5.42E-04 | 5.06E-04 | 4.00E-03 | |
| ANGPTL6 | 4.08E-02 | 1.28E-01 | 6.90E-01 | 1.63E-01 | 8.40E-03 | 3.16E-02 | 1.84E-02 | |
| LDL | ANGPTL3 | 8.54E-02 | 6.17E-01 | 3.88E-01 | 4.61E-01 | 2.47E-01 | 2.47E-01 | 3.67E-01 |
| ANGPTL4 | 1.07E-07 | 2.96E-10 | 1.46E-01 | 3.79E-14 | <1.0E-10 | <1.0E-10 | 7.77E-16 | |
| ANGPTL5 | 7.30E-03 | 4.41E-02 | 1.85E-02 | 7.00E-03 | 2.60E-04 | 3.00E-04 | 7.39E-06 | |
| ANGPTL6 | 1.97E-02 | 5.21E-01 | 7.56E-01 | 3.32E-01 | 5.70E-02 | 9.06E-02 | 5.86E-02 | |
| HDL | ANGPTL3 | 7.80E-03 | 1.85E-01 | 9.40E-01 | 2.37E-02 | 2.37E-01 | 9.95E-02 | 6.22E-02 |
| ANGPTL4 | 6.43E-05 | 5.32E-04 | 5.90E-03 | 4.36E-06 | 2.00E-04 | 5.43E-06 | 3.63E-09 | |
| ANGPTL5 | 8.58E-04 | 1.44E-01 | 3.31E-01 | 9.30E-03 | 2.37E-01 | 3.31E-01 | 4.99E-02 | |
| ANGPTL6 | 3.90E-03 | 8.96E-02 | 3.45E-01 | 2.06E-02 | 7.00E-03 | 2.97E-02 | 2.35E-02 | |
Discussion
Common diseases are caused by entire allele-frequency spectrums. Bansal et al. (2010) summarized that the common diseases are caused by (1) common variants; (2) rare variants independently of one another; (3) rare variants and common variants jointly (additively or synergistically); and (4) a set of variants located in the functional elements. Most statistical methods except for the CMC method are designed to separately test association of either common variants or rare variants rather than to jointly test for association of both common and rare variants. The purpose of this report is to develop a unified statistical framework which allows one to jointly test the entire allele-frequency spectrum of variants.
Several published statistical methods for testing association of rare variants with common disease are based on the notion of collapsing multiple rare variants within and across genes into groups to overcome the power issues due to testing rare variants individually. The basic component for these methods is to test the collective frequency differences of the grouped rare variants between cases and controls. These methods have proven to be powerful for testing association of multiple rare variants. However, the group tests also have their limitations. In general, these tests do not consider the general sequence background within which genetic variants function (Bansal et al., 2010) and ignore LD among the variants. As an alternative to the collapsing approach, we proposed genome information content-based statistics which test association of the genomic region by comparing differences in genome information content between cases and controls and hence there is no need to collapse the variants into a group. These statistics have several merits.
First, the genome information content-based statistics explored difference in genomic information between cases and controls. The genomic information comprehensively characterizes the contribution of all genomic variants to disease. Therefore, the genome information content-based statistics can be used to jointly test association of both common and rare variants.
Second, the genome information content-based statistics are simple to calculate. These statistics have nice asymptotical properties and consequently there is no need to resort permutations to calculate p-values. Therefore, computation using the genome information content-based statistics for genome-wide sequence-based association studies is very rapid.
Third, to provide insight into the advantages and limitations of various methods for association analysis, we assessed their null distributions by large-scale simulations. To take into account the genetic background and LD structure among multiple common and rare variants within or across genes, our simulations are based on real sequence data obtained from low coverage pilot data in the 1000 Genomes Project. Our results showed that the type 1 error rates of the genome information content-based statistics for testing association of both common and rare variants were, in general, not appreciably different from the expected nominal levels. However, the type 1 error rates of the group test and individual χ2 statistic for testing association of rare variants in a large proportion of the genomic regions were significantly deviated from the nominal levels. These statistics were anticonservative. Their type 1 error rates were largely deflated.
Fourth, to further evaluate the performance of the genome information content-based statistics, we compared their power with several group tests by large-scale simulations. As Bansal et al. (2010) pointed out, the majority of published power studies simulated data by assuming population genetic models. However, many evolutionary forces shape the population history. It is unknown if such assumptions are appropriate. Therefore, we used the low coverage pilot data for the CEU from the 1000 Genomes Project to simulate power calculations. The power of group tests and individual χ2 statistic for testing association of rare variants, and both common and rare variants were extensively simulated against four disease models, two relative risks, and various sample sizes. Our results showed that the individual χ2 test has no power to detect association of low frequency and rare variants at the genome-wide level of 0.05 in more than 99% of the genome. We also observed that the collapsing and CMC methods have improved power to detect association of low frequency and rare variants, but their power improvement is still limited in more than 95% of the genome. Our results clearly demonstrated that the power of the genome information content-based statistics which can recognize information contained in the physical location of the genetic variants and their genetic context is much higher than that of several collapsing tests in most genome regions. Their application to empirical data also showed that the genome information content-based statistics outperform several group and single marker tests.
Fifth, the genome information content-based statistics have flexible strategies for testing association of genomic variants. We can use different quantities such as entropy to measure genome content. We can measure only the genome content of functional variants and ignore non-functional variants.
The genome information content-based statistics also have limitations. First, these statistics do not take into account the possible direction of the rare variant effects. Presence of opposite directions of the rare variant effect will compromise the power of the tests. The genome information content-based statistics that take the direction of genetic variant effects into account will be developed in the near future. Second, the genome information content-based statistics do not design device to filter sequence errors. Third, although in about 10% of the genome, the genome information content-based statistics have 60% or higher power to detect association of low frequency and rare variants, they still do not have enough power to detect association of low frequency and rare variants in the majority of the genomic regions. Therefore, detecting association of low frequency and rare variants across the genome remains a great challenge to us.
Sequencing technologies are evolving rapidly and will soon produce the entire spectrum of nucleotide and structural variation for an individual in a timely and cost-effective manner. Developing statistical methods for testing association of the entire allele frequency spectrum of the genetic variants is essential to dissect complex genetic structures of common diseases in future genetic studies. Although our results are preliminary due to limitations of available next-generation sequence data from large samples of well-phenotyped individuals, the concepts and methods described in this report are expected to emerge as an alternative analytic framework for genetic studies of complex diseases and should stimulate further discussions regarding challenges raised by novel sequencing technologies.
Web Resources
The URLs for data presented herein are as follows:
1000 Genomes Project: http://www.1000genomes.org/
GICT (Genome Information Content-Based Tests): http://www.sph.uth.tmc.edu/hgc/faculty/xiong/index.htm
Additional information is available Online at the Journal of Computational Biology website (www.liebertonline.com/cmb).
Supplementary Material
Acknowledgments
We thank Hoicheong Siu for downloading low coverage pilot data in 1000 Genomes Project. The project described was supported by the National Institutes of Health and NIAMS (grants 1R01HL106034-01, 1R01AR057120-01, 1U01HG005728-01, and P50 AR054144-01 CORT).
Disclosure Statement
No competing financial interests exist.
References
- Altshuler D. Daly M.J. Lander E.S. Genetic mapping in human disease. Science. 2008;322:881–888. doi: 10.1126/science.1156409. [DOI] [PMC free article] [PubMed] [Google Scholar]
- Bansal V. Libiger O. Torkamani A., et al. Statistical analysis strategies for association studies involving rare variants. Nat. Rev. Genet. 2010;11:773–785. doi: 10.1038/nrg2867. [DOI] [PMC free article] [PubMed] [Google Scholar]
- Bhatia G. Bansal V. Harismendy O., et al. A covering method for detecting genetic associations between rare variants and common phenotypes. PLoS Comput. Biol. 2010;6:e1000954. doi: 10.1371/journal.pcbi.1000954. [DOI] [PMC free article] [PubMed] [Google Scholar]
- Bodmer W. Bonilla C. Common and rare variants in multifactorial susceptibility to common diseases. Nat. Genet. 2008;40:695–701. doi: 10.1038/ng.f.136. [DOI] [PMC free article] [PubMed] [Google Scholar]
- Collins F. Has the revolution arrived? Nature. 2010;464:674–675. doi: 10.1038/464674a. [DOI] [PMC free article] [PubMed] [Google Scholar]
- Durbin R.M. Abecasis G.R. Altshuler D.L., et al. A map of human genome variation from population-scale sequencing. Nature. 2010;467:1061–1073. doi: 10.1038/nature09534. [DOI] [PMC free article] [PubMed] [Google Scholar]
- Fisher R.A. The Theory of Inbreeding. Edinburgh: Oliver and Boyd; 1949. [Google Scholar]
- Frazer K.A. Murray S.S. Schork N.J., et al. Human genetic variation and its contribution to complex traits. Nat. Rev. Genet. 2009;10:241–251. doi: 10.1038/nrg2554. [DOI] [PubMed] [Google Scholar]
- Guo S.W. Proportion of genome shared identical by descent by relatives: concept, computation, and applications. Am. J. Hum. Genet. 1995;56:1468–1476. [PMC free article] [PubMed] [Google Scholar]
- Haldane J.B.S. The combination of linkage values and the calculation of distance between the loci of linked factors. J. Genet. 1919;8:299–309. [Google Scholar]
- Henderson D. Plaschko P. Stochastic Differential Equations in Science and Engineering. World Scientific; Hackensack, NJ: 2006. [Google Scholar]
- Hudson R.R. Generating samples under a Wright-Fisher neutral model of genetic variation. Bioinformatics. 2002;18:337–338. doi: 10.1093/bioinformatics/18.2.337. [DOI] [PubMed] [Google Scholar]
- Ji W. Foo J.N. O'Roak B.J., et al. Rare independent mutations in renal salt handling genes contribute to blood pressure variation. Nat. Genet. 2008;40:592–599. doi: 10.1038/ng.118. [DOI] [PMC free article] [PubMed] [Google Scholar]
- Kim S.Y. Li Y. Guo Y., et al. Design of association studies with pooled or un-pooled next-generation sequencing data. Genet. Epidemiol. 2010;34:479–491. doi: 10.1002/gepi.20501. [DOI] [PMC free article] [PubMed] [Google Scholar]
- Kryukov G.V. Shpunt A. Stamatoyannopoulos J.A., et al. Power of deep, all-exon resequencing for discovery of human trait genes. Proc. Natl. Acad. Sci. USA. 2009;106:3871–3876. doi: 10.1073/pnas.0812824106. [DOI] [PMC free article] [PubMed] [Google Scholar]
- Li B. Leal S.M. Methods for detecting associations with rare variants for common diseases: application to analysis of sequence data. Am. J. Hum. Genet. 2008;83:311–321. doi: 10.1016/j.ajhg.2008.06.024. [DOI] [PMC free article] [PubMed] [Google Scholar]
- Liu D.J. Leal S.M. A novel adaptive method for the analysis of next-generation sequencing data to detect complex trait associations with rare variants due to gene main effects and interactions. PLoS Genet. 2010;6:e1001156. doi: 10.1371/journal.pgen.1001156. [DOI] [PMC free article] [PubMed] [Google Scholar]
- Madsen B.E. Browning S.R. A groupwise association test for rare mutations using a weighted sum statistic. PLoS Genet. 2009;5:e1000384. doi: 10.1371/journal.pgen.1000384. [DOI] [PMC free article] [PubMed] [Google Scholar]
- Manolio T.A. Collins F.S. Cox N.J., et al. Finding the missing heritability of complex diseases. Nature. 2009;461:747–753. doi: 10.1038/nature08494. [DOI] [PMC free article] [PubMed] [Google Scholar]
- McClellan J. King M.C. Genetic heterogeneity in human disease. Cell. 2010;141:210–217. doi: 10.1016/j.cell.2010.03.032. [DOI] [PubMed] [Google Scholar]
- Metzker M.L. Sequencing technologies—the next generation. Nat. Rev. Genet. 2010;11:31–46. doi: 10.1038/nrg2626. [DOI] [PubMed] [Google Scholar]
- Morgenthaler S. Thilly W.G. A strategy to discover genes that carry multi-allelic or mono-allelic risk for common diseases: a cohort allelic sums test (CAST) Mutat. Res. 2007;615:28–56. doi: 10.1016/j.mrfmmm.2006.09.003. [DOI] [PubMed] [Google Scholar]
- Morris A.P. Zeggini E. An evaluation of statistical approaches to rare variant analysis in genetic association studies. Genet. Epidemiol. 2010;34:188–193. doi: 10.1002/gepi.20450. [DOI] [PMC free article] [PubMed] [Google Scholar]
- Nejentsev S. Walker N. Riches D., et al. Rare variants of IFIH1, a gene implicated in antiviral responses, protect against type 1 diabetes. Science. 2009;324:387–389. doi: 10.1126/science.1167728. [DOI] [PMC free article] [PubMed] [Google Scholar]
- Nielsen R. Genomics: in search of rare human variants. Nature. 2010;467:1050–1051. doi: 10.1038/4671050a. [DOI] [PubMed] [Google Scholar]
- Nothnagel M. Simulation of LD block-structured SNP haplotype data and its use for the analysis of case-control data by supervised learning methods. Am. J. Hum. Genet. 2002;71(Suppl):A2363. [Google Scholar]
- Price A.L. Kryukov G.V. de Bakker P.I., et al. Pooled association tests for rare variants in exon-resequencing studies. Am. J. Hum. Genet. 2010;86:832–838. doi: 10.1016/j.ajhg.2010.04.005. [DOI] [PMC free article] [PubMed] [Google Scholar]
- Pritchard J.K. Cox N.J. The allelic architecture of human disease genes: common disease-common variant … or not? Hum. Mol. Genet. 2002;11:2417–2423. doi: 10.1093/hmg/11.20.2417. [DOI] [PubMed] [Google Scholar]
- Purcell S. Neale B. Todd-Brown K., et al. PLINK: a tool set for whole-genome association and population-based linkage analyses. Am. J. Hum. Genet. 2007;81:559–575. doi: 10.1086/519795. [DOI] [PMC free article] [PubMed] [Google Scholar]
- Romeo S. Pennacchio L.A. Fu Y., et al. Population-based resequencing of ANGPTL4 uncovers variations that reduce triglycerides and increase HDL. Nat. Genet. 2007;39:513–516. doi: 10.1038/ng1984. [DOI] [PMC free article] [PubMed] [Google Scholar]
- Romeo S. Yin W. Kozlitina J., et al. Rare loss-of-function mutations in ANGPTL family members contribute to plasma triglyceride levels in humans. J. Clin. Invest. 2009;119:70–79. doi: 10.1172/JCI37118. [DOI] [PMC free article] [PubMed] [Google Scholar]
- Schork N.J. Murray S.S. Frazer K.A., et al. Common vs. rare allele hypotheses for complex diseases. Curr. Opin. Genet. Dev. 2009;19:212–219. doi: 10.1016/j.gde.2009.04.010. [DOI] [PMC free article] [PubMed] [Google Scholar]
- Shendure J. Ji H. Next-generation DNA sequencing. Nat. Biotechnol. 2008;26:1135–1145. doi: 10.1038/nbt1486. [DOI] [PubMed] [Google Scholar]
- Venter J.C. Multiple personal genomes await. Nature. 2010;464:676–677. doi: 10.1038/464676a. [DOI] [PubMed] [Google Scholar]
Associated Data
This section collects any data citations, data availability statements, or supplementary materials included in this article.