Abstract
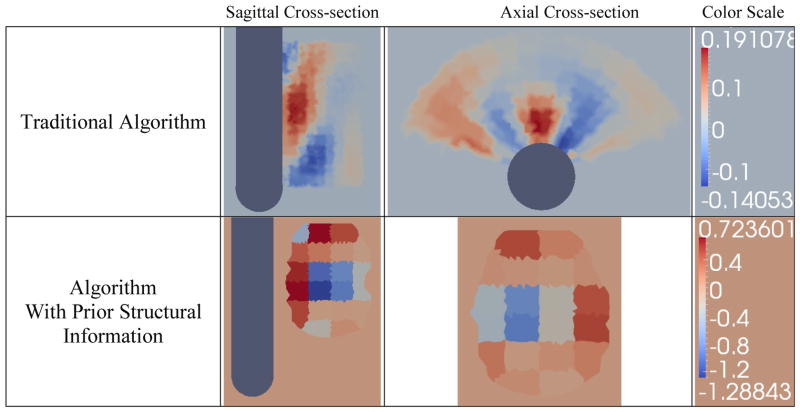
Current prostate biopsy procedures entail sampling tissues at template-based locations that are not patient specific. Ultrasound (US) coupled Transrectal Electrical Impedance Tomography (TREIT), featuring an endorectal US probe retrofitted with electrodes, has been developed for prostate imaging. This multi-modal imaging system aims to identify suspicious tumor regions based on their electrical properties and ultimately provide additional patient-specific locations where to take biopsy samples. Unfortunately, the open-domain geometry associated with TREIT results in a severely ill-posed problem due to the small number of measurements and unbounded imaging domain. Furthermore, reconstructing contrasts within the prostate volume is challenging because the conductivity differences between the prostate and surrounding tissues are much larger than the conductivity differences between benign and malignant tissues within the prostate. To help overcome these problems, anatomically accurate hard priors can be employed to limit estimation of the electrical property distribution to within the prostate volume; however, this requires the availability of structural information. Here, a method that extracts the prostate surface from US images and incorporates this surface into the image reconstruction algorithm has been developed to enable estimation of electrical parameters within the prostate volume. In this paper, the performance of this algorithm is evaluated against a more traditional EIT algorithm that does not use anatomically accurate structural information, in the context of numerical simulations and phantom experiments. The developed anatomically accurate hard-prior algorithm demonstrably identifies contrasts within the prostate volume while an algorithm that does not rely on anatomically accurate structural information is unable to localize these contrasts. While inclusions are identified in the correct locations, they are found to be smaller in size than the actual object due to the rapid decay in sensitivity at increasing distances from the probe surface. Despite this, identifying the size of the inclusion accurately may not be essential for biopsy guidance in a clinical setting; instead, knowledge of the general vicinity of a cancerous lesion may be sufficient for suggesting and guiding clinicians to extract additional biopsy cores.
1. Introduction
Transrectal Ultrasound (US) guided prostate biopsy procedures are the clinically established standard for prostate cancer diagnosis. During these procedures, US images provide purely anatomic information about the prostate and tissue core extraction sites are specified by systematic templates that are not patient specific. In the past two decades, significant research efforts have focused on establishing optimal templates which improve detection rates, malignant tumor localization, and negative predictive value of the biopsy procedure. There is opportunity to improve results by determining patient-specific sampling templates based on knowledge of the tumor location. Such templates could feature finer sampling in suspicious regions, for example, which would potentially lead to improvements in detection rates. Unfortunately, tumor location is generally not known prior to biopsy. To address this challenge, a novel multi-modal imaging system combining US and transrectal electrical impedance tomography (TREIT) (Wan et al 2010) has been constructed with the aim of identifying suspicious regions within the prostate based on well-established electrical property contrast between malignant and benign prostate (Halter et al 2009, Gabriel et al 1996). In this paper, a method that incorporates the US-based anatomic information extracted from this system into a reconstruction algorithm has been developed to enhance electrical property estimation for prostate imaging.
2. Background
2.1 System Description
The multi-modal imaging system features a commercial, 3D TRUS probe retrofitted with a rectangular array of thirty electrodes, as shown in Figure 1. The probe generates a stack of 2D US images by sampling along sagittal or axial planes of the prostate. A flexible array of electrodes are rigidly attached to the probe surface leaving open an acoustic window with a 140 ° aperture through which US images of the prostate can be recorded. The electrodes appear as reflections on the periphery of the ultrasound images and are used to co-register US and EIT images. The flexible circuit of electrodes is wired to a custom 32 channel data acquisition system controlled through a LabView programming environment; a complete description of the system can be found in Wan et al 2010 and Borsic et al 2010. The probe is mounted on a rigid, articulated arm that locks the probe in place to ensure stable positioning during data acquisition. A typical acquisition with the endorectal probe collects 61 axial US images at 1 mm intervals.
Figure 1.
Combined US and TREIT system. Column 1: Endorectal probe retrofitted with flex circuit of 30 electrodes. Column 2: System mounted on an articulated, rigid arm
The TREIT system is used to acquire tetrapolar impedance measurements; current is driven between a pair of electrodes while the remaining electrodes record single-ended voltages. Measurements are repeated for different combinations of current drive electrodes, known as tetrapolar measurement patterns; in a typical acquisition, 504 linearly independent patterns are recorded across a frequency range of 400 Hz to 102.4 kHz.
2.2 Open-Domain Imaging
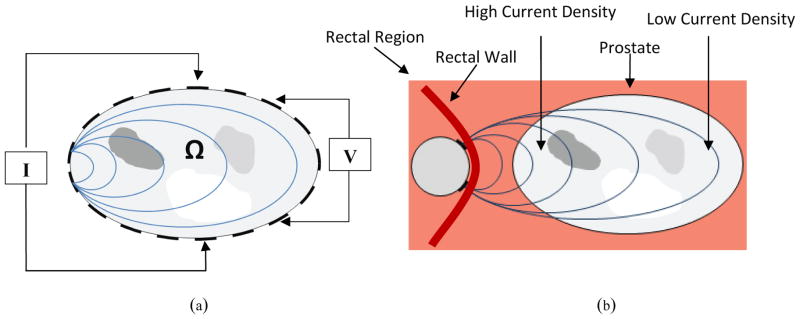
Electrical impedance tomography (EIT) estimates the electrical conductivity and permittivity distribution within a volume based on surface electrode measurements of voltage and current. In conventional closed-domain medical applications of EIT, exemplified in Figure 2a, a set of electrodes are applied to the skin, a pair of these electrodes injects and sinks an alternating current into the volume being imaged, and the resulting potentials are measured at other pairs of sensing electrodes; this procedure is repeated for different injection and sensing pairs. In a closed domain configuration injecting and sensing electrodes can be switched around the boundary of the object under investigation, and the resulting sensitivity is relatively uniform, decreasing from the boundary towards the center. Using these measurements, conductivity and permittivity images can be reconstructed.
Figure 2.
EIT setup for a body Ω, where I represents the current source and V represents the voltage source. (a) Closed-domain imaging – for this configuration the pair of electrodes injecting current and the pair of electrodes sensing voltages can be switched all around the boundary, resulting in a relatively uniform sensitivity that tends to diminish from the periphery towards the center of the object. (b) Open-domain imaging – in this configuration electrodes are mounted on the TRUS probe (shown in cross section) and cannot me switched around the prostate. The sensitivity is therefore relatively high on the side closed to the TREIT probe, and decreases very rapidly with distance from it.
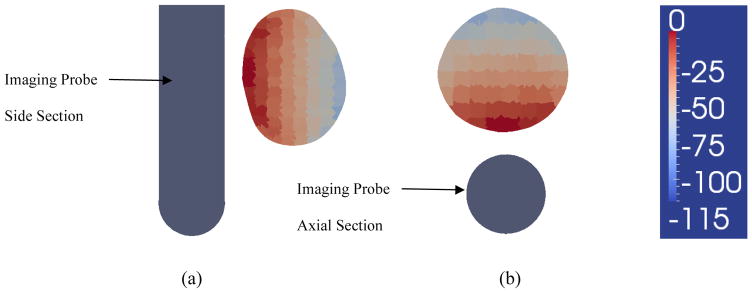
In TREIT, electrodes are retrofitted to the surface of a commercial, endorectal US probe (TargetScan Ultrasound System, Envisioneering Medical Technologies, St. Louis, MO) and the volume in front of the electrode array is imaged. This configuration represents an open-domain geometry (i.e. Figure 2b) in which electrodes are present on only one side of the imaging domain (prostate in this case). Therefore, current injection and voltage sensing occurs only from one side of the prostate and results in a particularly uneven distribution of sensitivity, which decays from the side of the prostate near the TREIT probe to the other side (as shown in logarithmic scale in Figure 14). The large decay of sensitivity results in a more severe than usual ill-posedness, and represents a challenge in image reconstruction. The specific application of TREIT to prostate imaging has the added difficulty that 1) prostate conductivity is much higher than its surrounding tissue (i.e. # ~0.1 S/m vs. ~0.02 S/m at 10 kHz) (surrounding tissue = adipose tissue extracted from Gabriel 1996) and 2) malignant prostate tissues have lower conductivity than other benign prostatic tissues (i.e. 0.109 S/m vs. 0.134 S/m at 10 kHz) (Halter et al 2009). These conductivity relationships suggest that a reconstruction algorithm must be able to both delineate the prostate from the lower conductivity tissue surrounding it and to identify low conductivity inclusions (i.e. tumors) within it (i.e. identify an inclusion within an inclusion). .
Figure 14.
Sensitivity analysis. Figure 14a shows a sagittal cross section of the prostate and of the imaging probe. Sensitivity was computed for 405 measurement patterns we typically use for imaging, and averaged across the different patterns. The image shows the average sensitivity, plotted in logarithmic scale (20*log10), and normalized to the maximum sensitivity, which occurs in pixels facing the probe. The illustration shows the significant decay of sensitivity at the distal end of the prostate, where it decays by 100dB, or 5 orders of magnitude. Figure 14b shows the sensitivity in decibels for the axial cross section of the prostate. Similarly a significant decay in sensitivity occurs at a distance from the probe.
2.1 Use of Prior Information
In this manuscript we demonstrate an effective method for improving image reconstruction in TREIT prostate imaging by incorporating prior information from ultrasound imaging. Prior information can be incorporated in algorithms in different ways. Methods are mainly categorized as hard priors or soft priors. Soft priors methods are typically used to incorporate information which might not be completely reliable. These methods tend to improve the image quality in case the prior information is correct, and they tend not to severely affect the image in case the prior information is not correct. One example of soft priors is that suggested by Kaipio et al 1999 and by Borsic et al 2002, where the regularization scheme used in image reconstruction is built ad-hoc, allowing faster spatial changes in the direction of the expected transitions. This scheme is generally known as anisotropic regularization, as the regularization strength depends on the direction of the change. A soft prior scheme for combining acoustic and electrical information has been proposed by Steiner et al 2008 for a dual bio-electromechanical imaging system which uses Ultrasound Reflection Tomography (URT) to identify acoustic impedance boundaries in an imaging volume and sets up the regularization matrix to allow steeper conductivity gradients at these boundaries. Specifically, the regularization contribution of each element is based on the intensity of the element in the URT image in such a way that brighter elements are assigned lower regularization weights, allowing larger conductivity gradients at impedance boundaries Hard priors are used when the prior information is thought to be reliable. These methods can provide superior performance when the prior information is correct, but might lead to severe artifacts when this is not the case. While soft priors are usually incorporated into the regularization of the inverse problems, “drawing” the solution towards the prior, hard priors are typically implemented by reducing the dimensionality of the problem, describing the possible conductivity profiles with a set of basis functions that span a space of expected profiles which is smaller than the original full space. If the true profile falls outside this restricted space obviously it cannot be reconstructed. On the other hand these methods increase robustness to noise and errors when the priors are correct. Vauhkonen et al 1997 proposed a method for hard priors based on forming an ensemble of expected conductivity profiles, and on deriving from this an appropriate set of basis functions. Zhu et al 2003 presents a reconstruction scheme using a combination of near-infrared and ultrasound data, where co-registered ultrasound measurements are used to segment a tissue volume into lesion and background regions. A fine grid is constructed for the lesion region and a coarser grid is constructed for the background region and used for image reconstruction of the near-infrared data.
In the specific context of our project we are interested in limiting the reconstruction of conductivity to the volume of the prostate. This has two advantages: 1) as the volume of interest is limited so is the range of values that sensitivity takes over this volume, reducing therefore the ill-posedness of the problem; 2) if conductivity is reconstructed only within the volume of the prostate, the reconstruction algorithm does not need to identify the boundary between the prostate and the surrounding tissues, which presents a relatively significant change in conductivity. If the reconstruction is not constrained to the interior of the prostate, the jump in conductivity at the boundary of the prostate becomes the principal feature of the image, and changes within the organ are hardly reconstructed. Focusing on reconstructing only the interior of the prostate eliminates this problem. In practice the surface of the prostate can be captured by ultrasound imaging, to an accuracy of 1 to 2 mm. As this structural information is quite accurate, particularly in comparison to the resolution of EIT, we consider using hard priors, in the form of constraining the volume which is reconstructed. This results in a better posed problem, increases robustness to noise, and results in images that highlight changes within the volume of the prostate, as we will show.
3. Image Reconstruction
Reconstruction for TREIT imaging of the prostate is based on a traditional nonlinear, least squares, Gauss Newton approach with Tikhonov Style regularization. Incorporation of US structural information is implemented by a meshing procedure which embeds the prostate surface into the forward modeling FEM mesh, and by building a coarse mesh for parameter estimation that spans this volume. In the following sub-sections we discuss briefly forward modeling, parameter estimation, and details of the meshing/reconstruction approach are discussed. A first approach to meshing/reconstruction, which was proposed in Borsic et al 2010 and which does not incorporate US information, is briefly introduced for comparison purposes, followed by the novel approach which is proposed in the present work.
3.1 Forward Modeling
The forward problem in EIT involves solving Laplace’s equation:
| (1) |
where σ is the conductivity or admittivity distribution in the imaging domain and u represents the electric potential.
Boundary conditions need to be applied to solve (1). A first observation regards the extent of the domain on which (1) is solved. In principle the currents injected and sinked by TREIT probe result in a current density that involves the whole body. In practice, as current is sourced and sinked by electrodes on the probe, current density significantly decreases with distance from the probe. We truncate the domain therefore on which we solve (1) to 10 cm from the surface of the probe, using a cylindrical model for the domain. Figure 3 shows a cross section of the domain and probe. The outer circle represents the boundary of the domain. The inner circle represents the boundary of the probe, which can be assimilated to a cylinder of approximately 2.5 cm of diameter. Truncating the domain to 10 cm from the probe results in negligible errors in our experience, as current density decays by more than 10 orders of magnitude at that distance. Neumann boundary conditions are used on the outer boundary, as currents are sourced and sinked by the electrodes, and no net current leaves the domain. Similarly no current flows in the probe which is built with a non-conducting material, with the exception of electrodes. At the interface of tissues and the probe therefore a Neumann boundary condition is used, imposing no electric flow. The interface of electrodes and tissues is instead modeled with the Complete Electrode Model (Somersalo et al 1992).
Figure 3.
Diagram illustrating a cross section of the cylindrical domain used for forward solving. At the center of the domain is present the TREIT probe which sources and sinks currents through electrodes. As the probe is an insulator (except for the electrodes) at the interface of the probe with tissues Neumann boundary conditions are applied imposing no current flow. The interface between electrodes and tissues is described with the Complete Electrode Model, and Neumann boundary conditions are applied to the outer boundary of the domain, as no current enters or leaves the domain.
In order to validate the forward model, simulated measured impedances where compared against a set of real measurements collected with EIT instrumentation. In this experiment the probe was submersed in a bath of saline solution of a conductivity of 0.1S/m, which represents a uniform conductor. A total of 405 linearly independent tetrapolar measurements were collected at frequency of 3.2KHz, using different electrode pairs for excitation and voltage sensing. The average resulting error between model-predicted and true measurements was of 1% (the typical measured impedances are 300 Ohms and the errors 3 Ohms). While this is in absolute terms a good level of agreement, it would be desirable to further reduce this error, as being the problem ill-posed small errors can have a significant effect on image quality. The instrumentation in use has an accuracy, when measured on high-precision resistors, of better than 0.2% at this frequency. We expect the differences between model and true data to arise possibly from nonuniform contact impedances at the electrodes, and further investigation is currently taking place on how to reconciliate model and true measurements to a further degree.
3.2 Parameter Estimation
Reconstructed conductivities, σrec, are estimated with a classic formulation:
| (2) |
where V(σ) is the forward operator, Vmeas the measured voltages, α the Tikhonov factor, L the regularization matrix, a discrete representation of the Laplacian operator, and σ* a reference initial distribution.
Equation (2) is solved iteratively with the Newton-Raphson method using the conductivity update:
| (3) |
where δσn is the conductivity update for iteration n and Jn is the Jacobian of the forward operator V(σ) calculated for σ =σn. Given the nonlinearity of the problem, a parabolic line search procedure is used (Nocedal and Wright 1996): (4)
| (4) |
where β is a scalar value determined by the line search process. Equations (3) and (4) are iterated to minimize the objective function in (2), until convergence. At present the Tikhonov factor is chosen manually, and given that the instrumentation we use is fixed, and therefore the level of noise, and that the contrasts we are imaging are in a defined range, we found empirically a value of this parameter that yields good results. Several methods exist though for the automatic selection of this parameter, including the L-Curve criterion and the Generalized Cross validation (GCV) method, Hansen 1998. Unfortunately as fairly large 3D models are used in this application, and as methods for choosing an optimal Tikhonov factor require exploring several inverse solutions, we have adopted for the time being a simple approach relying on a fixed value of this parameter. One objective of this work is to produce images in near real-time, as the information provided is intended to be used for guidance during surgical interventions. Current reconstructions require approximately 30 to 40 minutes of computing time. Work is under way to implement reconstruction on multiple Graphic Processing Units, where we expect to be able to reduce this overall time to less than 2 minutes (Borsic et al 2012). Reaching this goal would allow experimentation with methods for estimating the Tikhonov factor.
3.3 Meshing and Image Reconstruction
Both the novel algorithm proposed in this manuscript, which uses US information, and a previous algorithm, proposed in Borsic et al 2010, which we use as a reference, use a dual-mesh approach for image reconstruction; a fine mesh is used to solve the forward problem and a coarser representation of the mesh is used for the inverse step, reducing thus the number of parameters to be estimated. For forward solving, a fine mesh with 97,973 nodes and 541,604 tetrahedral elements (Borsic et al 2010) is used to represent the probe, the electrodes and a volume around it, as illustrated in Figure 3a.
Two different approaches to the generation of the coarse mesh are then used by the reference algorithm and by the novel algorithm using US information.
3.4 Reference Algorithm
As anticipated, we take as a reference the approach proposed in Borsic et al 2010, and we use this implementation for comparison of reconstruction performance on simulated and experimental data.
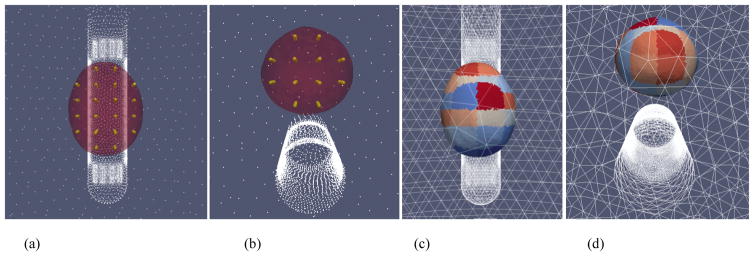
In the reference algorithm EIT imaging is constrained to an angular sector, or a “wedge”, in front of the array of electrodes. Electrodes cover only part of the circumference of the probe and are designed to generate a current flow in front of the probe, where the prostate is expected to be. This volume of higher current density in front of the imaging array is taken as the imaging volume. In order to produce a coarse mesh on which to estimate the conductivity, a set of nodes, called “seed-nodes”, is generated radially in this wedge volume, as illustrated in Figure 4b. Elements of the fine mesh are associated to the nearest seed-node, this allows lumping together elements of the fine mesh that are in the neighborhood of each seed-node. The lumped elements are constrained to have the same conductivity, reducing therefore the number of parameters to be estimated. This method allows therefore building a coarse mesh that derives by the aggregation of several elements on the fine mesh. Figure 4c shows in alternating red/green color elements of a coarse mesh used for reconstruction. Each colored element results from lumping together several elements on the fine mesh. In the illustration 10 seed-nodes are used radially, 14 in the angular direction, and 14 in the vertical direction, resulting in a wedge shaped coarse grid of 1960 elements.
Figure 4.
(a) FEM mesh of US probe and electrode array embedded inside a 24 cm cylinder representing the forward solve domain. (b) Visualization of the seed-points, in yellow color, generated within the imaging region, and the (c) coarse conductivity grid used for reconstruction.
The above procedure allows therefore to generate an imaging coarse grid in front electrode array, which will be used for estimating the electrical conductivity in a wedge shaped subdomain. No ultrasound structural information is used in this approach.
3.5 Anatomically Accurate Coarse Mesh – Prostatic subvolume algorithm
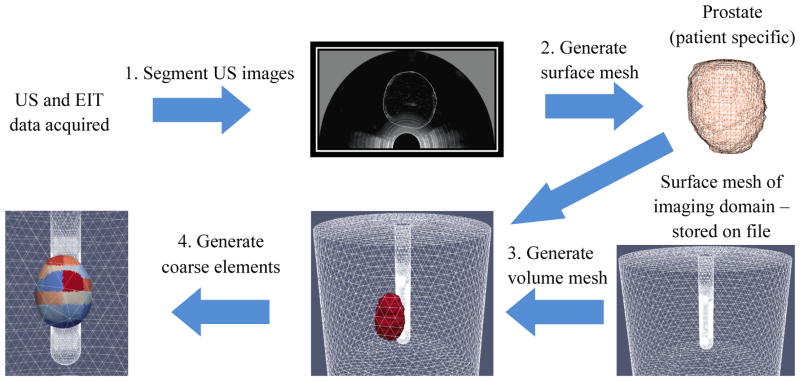
In the novel approach we propose for image reconstruction, meshes incorporate a surface which represents the patient specific anatomy, as captured by ultrasound imaging. The workflow of the developed anatomically accurate prostatic subvolume algorithm is shown in Figure 5. The process involves segmenting multiple axial US slices to identify the prostate boundary, generating a prostatic surface mesh based on these segmentations, generating a volumetric mesh of the union of this surface mesh and the base cylindrical mesh, and generating the coarse element representation of this volume mesh.
Figure 5.
Workflow diagram for the hard-priors reconstruction algorithm
3.5.1 Segmentation
Custom segmentation software was developed using Visualization ToolKit (VTK) functions and wxPython. The user-interface was optimized for a touch-screen monitor. The segmentation tool is based on the vtkContourWidget which was modified to allow users to draw contours on 2D US images by trailing their finger across the prostate boundary. As the user contours the images, a pixilated outline represented by Bézier curves appears in real-time (Figure 6b).
Figure 6.
Example 2D US slice of an agar phantom (a) before and (b) after segmentation (c) Binary mask of the segmentation. Surface mesh of the prostate (d) before and (e) after smoothing
2.1.1 Surface Mesh Generation
The stack of segmented images are converted into region-of-interest masks (Figure 6c) using the poly2mask function in MATLAB and input to a Marching Cubes (MC) algorithm (Wu and Sullivan 2003) which produces a surface mesh of the prostate (Figure 6d). The surface mesh is then decimated and smoothed, using vtkQuadraticDecimation and vtkSmoothPolyDataFilter, respectively, to generate a mesh with 2000 to 2800 surface elements (Figure 6e). This range of surface elements preserves the general shape of the prostate while maintaining relatively low computation time for the reconstruction.
2.1.2 Volume Mesh Generation
The surface representation of the prostate is embedded into the cylindrical volume used for image reconstruction. The volume mesh also includes the probe geometry and electrodes to properly model the flow of current within the domain. The smoothed surface mesh of the prostate is embedded into the FEM mesh of the imaging volume (Figure 4a) and a volume mesh of the consolidated surface is generated using the open-source software Tetgen (TetGen).
2.1.3 Generate Coarse Elements
A grid of ‘seed points’ are generated inside the prostate volume (Figure 7a and 7b). Elements inside the prostate volume that are close to the seed points are then grouped together to form the coarse elements on which parameters of the reconstruction are estimated; a visualization of the coarse elements is shown in Figure 7c and 7d. All elements outside of the prostate are then clustered into a single coarse element for which a single conductivity value is estimated. By setting up relatively large coarse elements in the prostate volume, the imaging sensitivity within the prostate is improved, since the sensitivity of an element is proportional to its size.
Figure 7.
Visualization of the (a) (b) ‘seed points’ inside the prostate; elements of the fine mesh are grouped together, based on proximity, to form (c) (d) coarse elements for the reconstruction.
3. Performance Evaluation of the Hard-Priors Reconstruction Algorithms
A number of numerical and experimental tests designed to compare images reconstructed with the wedge subvolume algorithm against those reconstructions with the prostatic subvolume algorithm were conducted. All images shown in this section were computed using a difference reconstruction algorithm which estimates impedance changes between two EIT datasets. In the experimental protocol, a reference dataset is collected by imaging a tank filled with saline and no phantom prostate and a second dataset is obtained by imaging the tank with a phantom prostate submerged within the saline bath; the impedance differences between the two datasets are then reconstructed.
4.1 Numerical Experiments
In this section, synthetic data is used to compare the performance of the prostatic subvolume algorithm against the wedge subvolume algorithm. The latter approach features a wedge that extends 6 cm from the surface of the probe to encompass the prostate (Figure 4c). The sub-volume spans 140° in the horizontal plane, extending 70° in each direction from the sagittal plane of the probe. Inside the imaging volume, a coarse grid of pixels is generated with 10 coarse elements along the radial direction, 14 elements along the angular direction and 14 elements along the vertical direction.
A volumetric mesh was created and synthetic data was generated to numerically evaluate the algorithm. Specifically, the mesh contained a simulated prostate (σ = 0.25 Sm-1), with a 2 cm spherical inclusion (σ = 0.0625 Sm−1), embedded in a homogeneous background (σ = 0.1 Sm−1) (see Figure 8). In the following two sections, simulated measurements were produced from the synthetic data and normally distributed noise was added to the measurements obtained from the forward solver to simulate actual experimental conditions.
Figure 8.
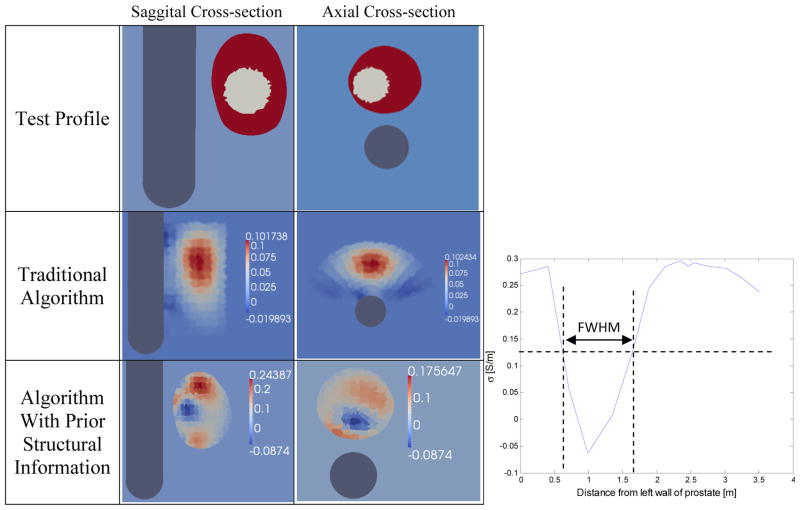
Difference reconstructions of synthetic data (row 1) without (2nd row) and with the use of structural information (3rd row). 4th column: The graph shows the reconstructed conductivities along a horizontal row of elements from the saggital cross-section of the reconstruction using the developed algorithm. The diameter of the reconstructed inclusion was estimated as the Full Width at Half Maximum (FWHM) of this conductivity profile.
4.1.1 Comparison between the developed algorithm and a simpler EIT reconstruction algorithm
Simulated data was generated with 0.1% additive noise and reconstructed with both algorithms using difference reconstructions; the reference measurements were obtained by computing the forward problem on a blank tank. This level of noise is particularly small, and representative of the best SNR that is practically achievable with state-of-the-art instrumentation. A noise level of 0.1%, although small, is challenging for this application, as the open-domain configuration of the electrodes represents a particularly ill-posed problem.
Difference reconstructions performed using the wedge subvolume algorithm (which does not use a priori information) were not able to identify contrasts within the prostate (Figure 8 – Second column). It is clear that the prostate was identified as a region of high conductivity but no discernible contrasts are visible within the prostate volume.
Difference reconstructions using the prostatic subvolume algorithm correctly identify and localize the inclusion (Figure 8 – Third column). These images report changes in conductivity with respect to a reference dataset collected from a 0.1 Sm−1 bath without the prostate; therefore, the absolute conductivity values are 0.1 Sm−1 higher than the values reported in Figure 8. For instance, the conductivity of prostate inclusion (i.e. simulated tumor) is lower than the background conductivity of 0.1 Sm−1 and appears as a negative conductivity (σ = −0.0874 S/m) in the image; however, the absolute conductivity of this recovered inclusion is positive (σ = 0.0126 S/m).
The diameter of the reconstructed inclusion was estimated as the Full Width Half Maximum (FWHM) of the conductivity profile of a single row of elements from the left wall of the prostate to the right wall, as illustrated in the plot of Figure 8; the diameter was found to be 1.037 cm which represents a relative error of 48.2% from the true value, 2 cm. By averaging conductivity values inside the reconstructed object and the prostate volume, the conductivity contrast between the inclusion and the prostate volume was found to be 15% versus the actual difference of 25%.
4.1.2 Performance of the prostatic subvolume algorithm at different noise levels
Synthetic data with additive noise of 0.05%, 0.075%, 0.1%, 0.15%, and 0.2% was generated and reconstructed using the developed algorithm. Because reconstructions are sensitive to the actual distribution of the additive noise, reconstructions at each noise level were repeated ten times with a different vector of additive noise and the worst-case reconstructions, where the inclusion was the least discernible, were used to evaluate the algorithm’s performance.
4.1.2.1 Simulated inclusion in the middle of the prostate
The inclusion was correctly identified at noise levels of 0.05%, 0.075% and 0.1%, while reconstructions for noise levels of 0.15% and 0.2% did not isolate the object through repeated simulations (Figure 9). Based on these simulations, the developed algorithm shows good localization for noise levels of up to 0.1% and reconstructions at higher noise levels may not be accurate. From the simulations conducted, the worst-case reconstruction from each noise level is shown in Figure 9. Using these images, the diameter of the recovered object was estimated as the FWHM using a single row of conductivity values sampled from the posterior wall to the anterior wall of the prostate; the size of localized inclusion for noise levels of 0.05%, 0.075% and 0.1% was found to be roughly the same (approximately 1cm; relative error of 50%).
Figure 9.
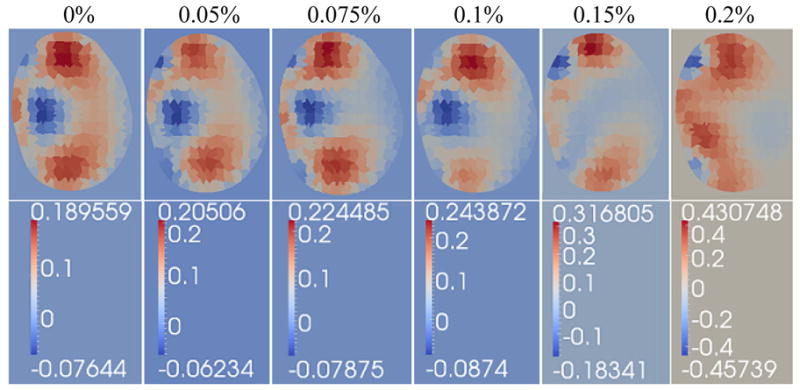
Performance of the prostatic subvolme algorithm on simulated data with additive Gaussian noise levels of 0%, 0.05%, 0.075%, 0.1%., 0.15% and 0.2%, respectively.
4.1.2.2 Effect of different conductivity contrasts on the reconstruction
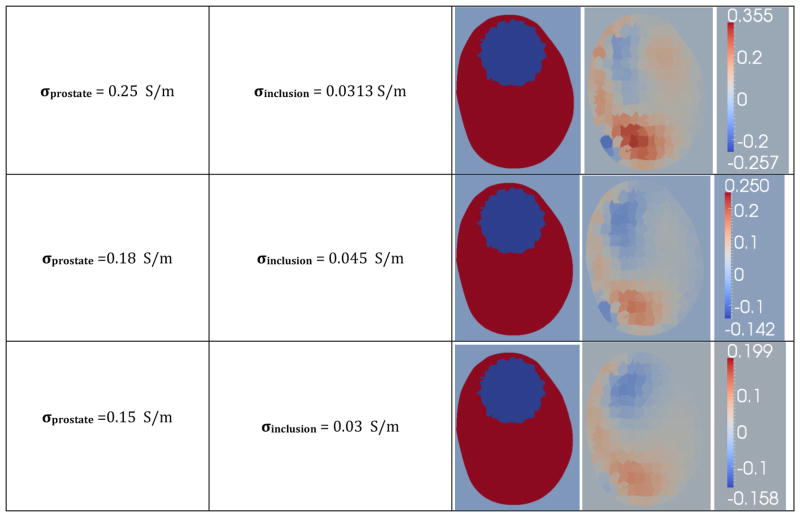
The effect of contrast on sensitivity was evaluated by reconstructing a prostate with an inclusion near the top, using synthetic data with no additive noise. Several configurations featuring different conductivities for the prostate and inclusion, in a homogeneous background of 0.1 Sm−1 were used to generate an ensemble of synthetic data. The reconstructions (Figure 10) clearly show that as the prostate’s conductivity is lowered, while maintaining a constant conductivity ratio between prostate and inclusion, the image quality improves significantly. The results show correct localization for conductivity contrasts between the prostate and background of up to 1.8, for prostates that are at least three times as conductive as the inclusion.
Figure 10.
Reconstructions of synthetic data, visualized in the third column, generated from simulated prostate phantoms with different conductivities for the prostate and inclusion, with a homogeneous background of 0.1 Sm−1.
4.1.2.3 Effect of radial inclusion position on the reconstruction
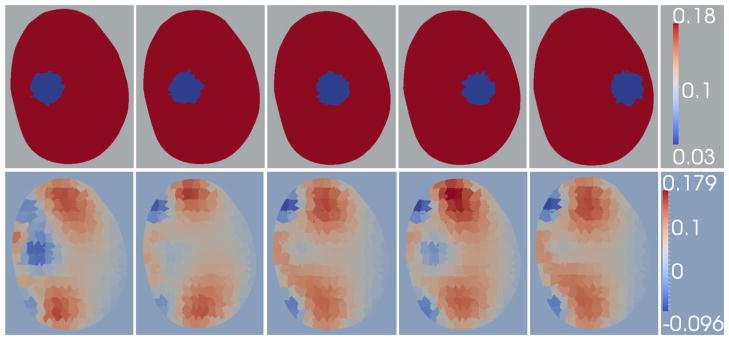
To evaluate the algorithm’s ability to discern inclusions far from the probes surface, five 0.18 Sm−1 prostate phantoms which feature 1 cm inclusions of conductivity 0.03 Sm−1 were simulated. The inclusion is axially centered, and positioned between the posterior and anterior wall of the prostate at steps of 0.5 cm. Reconstructions of the phantom data with 0.05% additive noise are shown in Figure 11; the positions are referred to as positions 1 through 5 where position 1 is the closest to the probe and position 5 is the farthest from the probe.
Figure 11.
Decreasing Radial Sensitivity: Reconstructions of simulated prostates using synthetic data with 0.05% noise: the phantoms feature a 1cm inclusion which is progressively moved from a high-sensitivity region to a low-sensitivity region. Row 1: Simulated phantom data. Row 2: Reconstructions of the simulated data shown in row 1.
The reconstructions show that the inclusion is not recovered correctly in positions 3, 4 and 5 and is recovered in the first two positions, albeit with low contrast in position 2. The EIT images of the three positions farthest from the probe reconstructed an artifact in a region close to the probe surface. These positions are far from the probe surface in regions where sensitivity decreases significantly. Furthermore, the algorithm appears to introduce artifacts near the probe surface to account for the small changes in measurements induced when an inclusion is present (even when positioned at far distances (> 1 cm) from the probe surface).
Phantom Studies
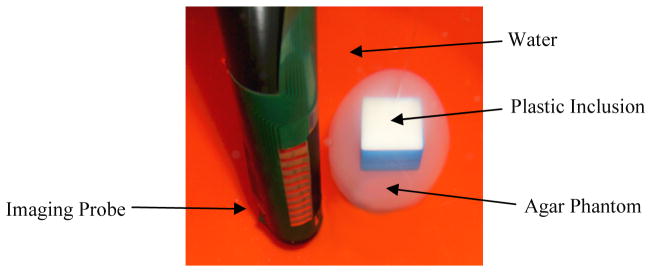
The method outlined in Sections 3.4, which uses structural information as “priors” for reconstruction, was applied to a phantom experiment to evaluate the performance of the developed algorithm. An egg-shaped, agar phantom with a plastic inclusion centered in the phantom (Figure 12), was suspended approximately 3 mm from the surface of the probe using thin nylon wire, and imaged using the TREIT system (Figure 12). The phantom had a conductivity of 0.25 Sm−1 and featured a plastic cube of dimensions 2 cm x 2 cm x 1.3 cm which was centered along the vertical axis of the phantom; the plastic inclusion is assumed to be a perfect insulator. The experiment was conducted in a cylindrical tank filled with 0.1 Sm−1 saline solution, which is 2.5 times lower than the agar conductivity. US and EIT data were acquired from the phantom using an in-house developed system described in Wan et al 2011. The system has 32 measuring channels, and is capable of acquiring tetrapolar impedance measurements at 5 different frequencies of 400Hz, 3,200Hz, 25,600Hz, and 102,400Hz. The system is calibrated for gain and offset errors against 0.1% precision resistors. We believe that the maximum experimental accuracy in phantom studies can be achieved at 3,200Hz, a frequency for which parasitic effects, like coupling between wires, are negligible, and where contact impedance is reduced, compared for example to the frequency of 400Hz. The estimated instrument precision at 3,200Hz is better than 0.2%. US images were acquired and segmented to produce a volume mesh for the reconstruction. Difference reconstructions were produced using the two algorithms in question. To evaluate the algorithms, difference imaging was employed instead of absolute imaging. This was purposely chosen to minimize any systematic or calibration hardware errors, and provide a more isolated means of assessing the performance of the two algorithms.
Figure 12.
Agar phantom of conductivity 0.25 Sm−1 with a plastic inclusion of dimensions 2cmx2cmx1.3cm centered along its vertical axis was suspended 3mm from the surface of the transrectal probe
The hard-priors reconstruction algorithm with a wedge sub-volume is able to identify the prostate but not the objects inside it (Figure 13). The algorithm does not correctly model the conductivity jump between the prostate and background tissue so recovering changes inside the prostate using this algorithm is challenging.
Figure 13.
Difference reconstructions of the EIT data collected for the setup shown in Figure 12, using the wedge subvolume algorithm and the prostatic subvolume algorithm
The prostatic subvolume algorithm successfully localized the object within the prostate (Figure 13). The agar phantom was identified as having higher conductivity (~ 0.5 – 0.8 S/m) than the inclusion (<0 S/m) and the background (~ 0 S/m), however, the magnitude of the reconstructed conductivities was much larger than the actual conductivity of the phantom (0.5 – 0.8 S/m versus 0.25 S/m). This over-shooting effect arises from insufficient measurement accuracy and the data-model mismatch term. Since regularization assumes a continuous distribution throughout the volume, the step change in conductivity at the interface between the inclusion and the prostate phantom cannot be accurately estimated, so the algorithm generates elements of higher conductivity around the inclusion.
The height of the recovered inclusion was estimated as the FWHM of a conductivity profile taken along the third column of pixels from the probe surface of the reconstructed image (see Figure 8). The height of the recovered object was found to be 1.7 cm; this represents a 31% relative error from the actual height of 1.3 cm. However, because the heights of the coarse elements ranged between 0.8 cm and 0.9 cm, the location and dimensions of the localized inclusion are within the error introduced by the chosen spatial resolution.
5. Discussion
For both numerical and experimental assessment, the wedge subvolume algorithm is able to identify the prostatic volume but not inclusions inside it (Figure 8 and 13, respectively). The prostate is a large volume whose conductivity is approximately five times higher than the background, while neoplasms in the prostate are smaller masses whose conductivities are only approximately 20% different from normal surrounding tissue (Halter et al 2009); the step change in conductivity at the prostate periphery has a significantly larger impact on the data-model mismatch than the electrical property differences of the various tissues within the prostate. While all elements outside the wedge subvolume are combined to form a single background element, there are still coarse elements within the wedge that represent peri-prostatic tissue. In addition, coarse elements within the wedge subvolume include both benign prostatic tissue and malignant prostatic tissue, which are the tissues of most clinical importance. Since the reconstruction has to fit the large step change in conductivity between the prostate and surrounding tissue within the wedge subvolume, conductivity differences within the prostate are not able to be accurately estimated since their effect on the boundary measurements are much smaller in comparison.
To overcome this problem, the prostatic subvolume algorithm groups together all tissues outside the prostate into a single coarse element for the reconstruction. As a result, the only tissues present within the subvolume are benign and malignant prostate. This implicitly limits the effect the background tissue has on the data-model mismatch term, and instead enables this term to be dominated by conductivity changes inside the prostate volume. Since a single background element can only account for some of the changes in the measurements, the reconstruction must account for these changes by driving the conductivity distribution inside the prostate volume towards a more optimal solution. Furthermore, by estimating a single conductivity value for the tissues surrounding the prostate, the number of parameters being estimated is reduced which improves the condition number of the inversion and decreases the ill-posedness of the problem.
The developed algorithm is able to identify the prostate and inclusion in cases where the inclusion is near the middle of the prostate. In phantom experiments, the dimensions and location of the recovered object were within the error introduced by the spatial resolution of the reconstruction. In simulated prostates, the recovered inclusion was smaller in size than the actual object (approximately 52% of the actual size for a 2cm spherical inclusion) and was shifted in space from its true location. Accurately determining the position of a contrast in EIT is difficult as the conductivity profile inside a volume is estimated based on boundary measurements. This problem is worsened in the case of TREIT imaging as the electrodes are used to image in an open domain and sensitivity decays rapidly with distance from the probe. The algorithm presents poorer localization in reconstructions of simulated phantoms that features inclusions near the longitudinal boundaries as the top (and bottom) of the prostate suffer from lower sensitivity than the middle of the prostate (i.e. Figure 10).
This decreased sensitivity can be assessed through analyses employing the Jacobian of the system. Specifically, the Jacobian employed to reconstruct the images displayed in Figure 13 can be used to compute the sensitivity of each coarse element. Figure 14a shows these sensitivity values along a vertical plane; as expected, the region of highest sensitivity is observed to be close to the probe surface. Based on this particular imaging geometry, the sensitivity at the top and bottom of the phantom are found to be only 81% and 76% of the sensitivity values computed at the middle of the phantom, respectively. The reduced sensitivity in these regions makes it difficult to accurately identify inclusions near the base and apex of the prostate.
Despite this, it is worth noting that the ratio between the largest and smallest sensitivities observed in the prostate is approximately 39. The problem is much better posed than the typical EIT inverse problems that do not use prior information; in these cases, sensitivities across the imaging domain can span 20 orders of magnitude (Borsic et al 2009).
Furthermore, analyzing the singular value decomposition (SVD) of the Jacobian, J, provides additional insights into the reconstruction. The SVD of J can be written as:
| (7) |
The columns of the matrix, V (n × n) form n basis images ordered according to decreasing size of eigenvalues (Zadehkoochak et al 1991). The matrix, U, assigns a weight to each basis image and Σ is a diagonal matrix of the singular values where the magnitude of each singular value indicates how much the basis image will be affected by noise.
The lower basis images represents structures that are very close to the periphery; as the basis image index increases, finer structures occurring closer to the center are represented in the images. Therefore, smaller singular values correspond to finer structures, particularly near the image center. In other words, the lower eigenvalues in the image represent lower spatial frequencies while higher eigenvalues model faster spatial variations in the images. However, as the problem is ill-posed, smaller eigenvalues correspond to high-frequency conductivity distributions which produce little change in the measurements.
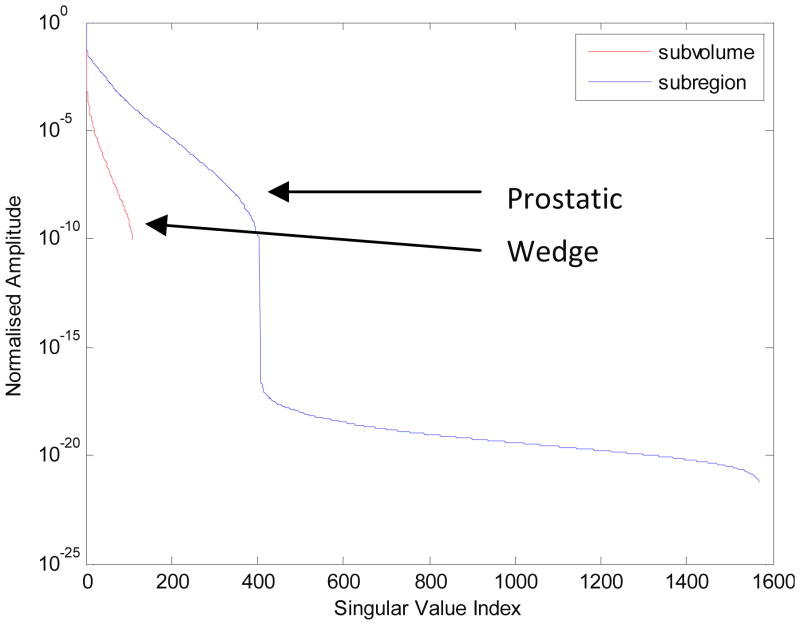
Using more eigenvalues in the reconstruction improves the resolution of the image at the cost of introducing further noise into the image. With Tikhonov regularization, the number of eigenvalues to include in the solution is implicitly controlled by the Tikhonov factor, α. Lower values of α introduce more eigenvalues into the reconstruction and place more emphasis on fitting the measurements to the model at the risk of introducing additional noise into the image. Higher values of α reduce the number of eigenvalues used in the reconstruction, which imposes smoothing on the image and reduces the amount of high-frequency noise in the image. Analyzing the distribution of the singular values of the Jacobians for the wedge subvolume algorithm and the prostatic subvolume algorithm provides useful information about the performance of the algorithms. The Jacobians of the two algorithms were decomposed using the SVD technique and the normalized singular values were plotted on a log scale, as shown in Figure 14b. The prostatic subvolume algorithm clearly has fewer singular values than the wedge subvolume algorithm since fewer parameters are being estimated. Based on the graph, the condition number of the problem is greatly improved with the prostatic subvolume algorithm in comparison to the wedge subvolume algorithm (10−22 versus 10−10). Limiting the reconstruction to the prostate volume reduces the number of parameters being estimated which improves the conditioning of the problem.
The conductivity difference between the prostate and its surrounding tissue is much larger than the conductivity contrast between benign tissues and lesions in the prostate. Estimating values in a subvolume that encompasses the prostate forces the reconstruction to compute the step-change in conductivities between the prostate and background tissues; this can overshadow conductivity differences within the prostate volume since their effect on the measurements is much smaller in comparison. However, by adopting an anatomically accurate volume over which to estimate electrical properties, the step-change in conductivity at the prostate-background interface no longer needs to be computed; therefore, the reconstruction is forced to reduce the data-model mismatch by fitting changes within the prostate volume. Furthermore, as the reconstruction is limited to the prostate volume which is smaller than the imaging domain, fewer parameters are being estimated resulting in a better-posed and conditioned problem. The culmination of these factors is responsible for the improvements in the images presented.
5 Conclusions
The problem of reconstructing TREIT images is highly ill-posed due to the open-geometry nature of the problem. Furthermore, the inherently large difference in conductivity between the prostate and its surrounding tissue makes it difficult to identify contrasts within the prostate volume without the use of prior information. In this paper, a reconstruction scheme based on hard priors is introduced that restricts the estimation of electrical parameters to an anatomically accurate representation of the prostate volume. Manual segmentations of US images are used to generate a surface representation of the prostate, which is then incorporated into a FEM-based reconstruction mesh. The presented reconstruction algorithm, based on using prior information, for imaging of the prostate shows promise for recovering contrasts within the prostate volume in the context of numerical simulations and phantom studies. Numerical and phantom studies both demonstrate significant improvements in identifying inclusions within the prostate when the anatomically accurate prostatic subvolume algorithm is used. Numerical studies demonstrated more inaccuracies in identifying inclusions near the top or bottom of the phantom due to the reduced sensitivity in these regions. One technique for mitigating this difficulty might be to incorporate variably sized coarse elements in different regions of the prostate, where sizing is based on the sensitivity of the regions. Element sizes can be controlled by using non-uniform spacing between seed points in the prostate volume
From the algorithmic point of view few further improvements can be considered. One possible improvement would be the use of edge-preserving techniques, like for example Total Variation Regularization, which allows reconstructing sharper contrasts, and would be appropriate in the context of this project, where the aim is to detect a localized conductivity change represented by cancer. Such techniques have been proposed in EIT in the context Bayesian methods by Kaipio et al 2000, and in the context of deterministic methods by Borsic et al 2010. Both approaches are more computationally expensive than a plain least squares reconstruction and have been for this reason out of the scope of the present project. Formulation of the reconstruction from a Bayesian point of view, for example like in Kaipio et al 2000, would allow incorporating indicators of uncertainty on measurements into image reconstruction and to produce a statistical quantification of reconstructed values, in terms of mean value and variance, which would be a desirable feature in terms of taking clinical decisions based on this data. As these approaches are usually computationally intensive, we did not consider them in the present work, which aims at producing an image in near real-time (1 to 2 minutes). In modeling the prostate and the imaging probe we use high density 3D meshes with 500,000 elements, which result in reconstruction times of 30 to 40 minutes. With the aim of reducing computing times, basic blocks of the algorithm, like forward solving and Jacobian computation, are being implemented on Graphic Processing Units, which allow significant speed gains. Once this transition is fully made we hope it will be possible to explore other advanced reconstruction approaches, which will be possible to base on fast underlying routines running on GPUs.
Besides the potential further improvements discussed above, this study demonstrates the value of using anatomically accurate prior information in reconstruction algorithms for EIT. Particularly for the case of TREIT imaging, this technique provides a way of recovering contrasts inside the prostate volume. Imaging using this technique provides a more feasible and efficacious approach for clinical deployment and further in vivo studies are warranted for assessing the potential clinical utility of TREIT for guiding prostate biopsy procedures.
Figure 15.
Normalized amplitudes of the singular values of the Jacobian matrix for the prostatic subvolume algorithm and for the wedge subvolume algorithm, respectively. The first algorithm results in better conditioning, as reconstruction is constrained to a smaller volume, over which the variation in sensitivity is smaller, resulting in a smaller ratio between maximum and minimum singular value of the Jacobian matrix.
Acknowledgments
We would like to acknowledge support from the NIH grant, NIBIB # RC1EB011000.
Contributor Information
A Borsic, Email: andrea.borsic@dartmouth.edu.
RJ Halter, Email: ryan.j.halter@dartmouth.edu.
BIBLIOGRAPHY
- Borsic A, Halter R, Wan Y, Hartov A, Paulsen K. Sensitivity study and optimization of a 3D electric impedance tomography prostate probe. Physiol Meas. 2009;30:S1–18. doi: 10.1088/0967-3334/30/6/S01. [DOI] [PMC free article] [PubMed] [Google Scholar]
- Borsic A, Halter R, Wan Y, Hartov A, Paulsen K. Electrical impedance tomography reconstruction for three-dimensional imaging of the prostate Physiol. Meas. 2010;31:S1–16. doi: 10.1088/0967-3334/31/8/S01. [DOI] [PMC free article] [PubMed] [Google Scholar]
- Borsic A, Lionheart WRB, McLeod CN. Generation of anisotropic-smoothness regularization filters for EIT IEEE Trans. Med Imaging. 2002;21:579–87. doi: 10.1109/TMI.2002.800611. [DOI] [PubMed] [Google Scholar]
- Borsic A, Graham BM, Adler A, Lionheart WRB. In Vivo Impedance Imaging With Total Variation Regularization. IEEE Transactions on Medical Imaging. 2010;29:44–54. doi: 10.1109/TMI.2009.2022540. [DOI] [PubMed] [Google Scholar]
- Borsic A, Attardo AE, Halter RJ. Multi-GPU Jacobian accelerated computing for soft field tomography. 2012 doi: 10.1088/0967-3334/33/10/1703. Submitted to Physiological Measurement. (THIS IS A SUBMISSION TO THE PRESENT SPECIAL ISSUE) [DOI] [PMC free article] [PubMed] [Google Scholar]
- Gabriel S, Lau RW, Gabriel C. The dielectric properties of biological tissues: II. Measurements in the frequency range 10 Hz to 20 GHz. Phys Med Biol. 1996;41:2251–2269. doi: 10.1088/0031-9155/41/11/002. [DOI] [PubMed] [Google Scholar]
- Halter R, Schned A, Heaney J, Hartov A, Paulsen K. Electrical properties of prostatic tissues: I. Single frequency admittivity properties. J Urol. 2009;182:1600–7. doi: 10.1016/j.juro.2009.06.007. [DOI] [PMC free article] [PubMed] [Google Scholar]
- Halter R, Schned A, Heaney J, Hartov A, Paulsen K. Electrical properties of prostatic tissues: II. Spectral admittivity properties. J Urol. 2009;182:1608. doi: 10.1016/j.juro.2009.06.013. [DOI] [PMC free article] [PubMed] [Google Scholar]
- Hansen PC. SIAM. 1998. Rank-deficient and Discrete ill-posed problems. [Google Scholar]
- Kaipio JP, Kolehmainen V, Vauhkonen M, Somersalo E. Inverse problems with structural prior information. Inverse Problems. 1999;15:713–30. [Google Scholar]
- Kaipio JP, Kolehmainen1 V, Somersalo S, Vauhkonen M. Statistical inversion and Monte Carlo sampling methods in electrical impedance tomography. Inverse Problems. 2000;16:1487–1522. [Google Scholar]
- Nocedal J, Wright SJ. Numerical Optimization. Berlin: Springer; 1999. [Google Scholar]
- Steiner G, Soleimani M, Watzenig D. A bio-electromechanical imaging technique with combined electrical impedance and ultrasound tomography. Physiol Meas. 2008;29:S63. doi: 10.1088/0967-3334/29/6/S06. [DOI] [PubMed] [Google Scholar]
- TetGen 1.4.3. http://tetgen.berlios.de/
- Vauhkonen M, Vadasz D, Karjalainen PA, Kaipio JP. Subspace regularization method for electrical impedance tomography. Proc 1st Int Conf Bioelectromagn. 1996;165 [Google Scholar]
- Wan Y, Halter R, Borsic A, Manwaring P, Hartov A, Paulsen K. Sensitivity study of an ultrasound coupled transrectal electrical impedance tomography system for prostate imaging. Physiol Meas. 2010;31:S17–29. doi: 10.1088/0967-3334/31/8/S02. [DOI] [PMC free article] [PubMed] [Google Scholar]
- Wu Z, Sullivan JM. Multiple material marching cubes algorithm. Int J Numer Meth Eng. 2003;58:189. [Google Scholar]
- Zadehkoochak M, Blott BH, Hames TK, George RF. Spectral expansion analysis in electrical impedance tomography. J Phys D: Appl Phys. 1991;24:1911–16. doi: 10.1088/0143-0815/12/a/019. [DOI] [PubMed] [Google Scholar]
- Zhu Q, Chen N, Kurtzman SH. Imaging tumor angiogenesis by use of combined near-infrared diffusive light and ultrasound. Opt Lett. 2003;28:337. doi: 10.1364/ol.28.000337. [DOI] [PMC free article] [PubMed] [Google Scholar]


