

Abstract
Folded RNA molecules are shaped by an astonishing variety of highly conserved noncanonical molecular interactions and backbone topologies. The dinucleotide platform is a widespread recurrent RNA modular building submotif formed by the side-by-side pairing of bases from two consecutive nucleotides within a single strand, with highly specific sequence preferences. This unique arrangement of bases is cemented by an intricate network of noncanonical hydrogen bonds and facilitated by a distinctive backbone topology. The present study investigates the gas-phase intrinsic stabilities of the three most common RNA dinucleotide platforms — 5′-GpU-3′, ApA, and UpC — via state-of-the-art quantum-chemical (QM) techniques. The mean stability of base-base interactions decreases with sequence in the order GpU > ApA > UpC. Bader’s atoms-in-molecules analysis reveals that the N2(G)…O4(U) hydrogen bond of the GpU platform is stronger than the corresponding hydrogen bonds in the other two platforms. The mixed-pucker sugar-phosphate backbone conformation found in most GpU platforms, in which the 5′-ribose sugar (G) is in the C2′-endo form and the 3′-sugar (U) in the C3′-endo form, is intrinsically more stable than the standard A-RNA backbone arrangement, partially as a result of a favorable O2′…O2P intra-platform interaction. Our results thus validate the hypothesis of Lu et al. (Lu Xiang-Jun, et al. Nucleic Acids Res. 2010, 38, 4868-4876), that the superior stability of GpU platforms is partially mediated by the strong O2′…O2P hydrogen bond. In contrast, ApA and especially UpC platform-compatible backbone conformations are rather diverse and do not display any characteristic structural features. The average stabilities of ApA and UpC derived backbone conformers are also lower than those of GpU platforms. Thus, the observed structural and evolutionary patterns of the dinucleotide platforms can be accounted for, to a large extent, by their intrinsic properties as described by modern QM calculations. In contrast, we show that the dinucleotide platform is not properly described in the course of atomistic explicit-solvent simulations. Our work also gives methodological insights into QM calculations of experimental RNA backbone geometries. Such calculations are inherently complicated by rather large data and refinement uncertainties in the available RNA experimental structures, which often preclude reliable energy computations.
Keywords: RNA structure, QM calculations, dinucleotide platforms, GpU, ApA, UpC, RNA backbone, RNA submotif, O2′…O2P
INTRODUCTION
Nucleic acids (NA) are polymeric biomacromolecules that play vital roles in cellular life. The primary and most essential function of 2′-deoxyribonucleic acid (DNA) is to preserve the genetic information in the cell. Conversely the pool of functions for which ribonucleic acid (RNA) is accountable is much larger and by far still not exhaustively explored and fully comprehended. While less than 2% of the human genomic DNA directly encodes protein sequences, over 80% of the genome is actually transcribed into RNA. Thus, the vast majority of the genome encodes non-protein coding RNAs (ncRNAs) with numerous known as well as hitherto unknown functions.
The ability of RNA molecules to execute miscellaneous tasks has its origin in the tremendous variability of complexly organized structures, which are made possible by the 2′-hydroxyl group attached to the C2′ atom of the sugar moiety (Figure 1). The easily accessible 2′-hydroxyl group features a hydrogen bond (H-bond) with both acceptor and donor capabilities, which allow it to interact and stabilize complex tertiary structures and modular motifs indispensable to RNA organization and inherently inaccessible to DNA. The 2′-hydroxyl group also represents one of the crucial components of the so-called Sugar edge of a ribonucleotide. RNA molecules create a wide variety of base pairs by systematically combining the three edges of the constituent ribonucleotides, i.e., the Sugar edge, the Watson-Crick edge and the Hoogsteen edge1-3. Such interactions define the shape and conservation patterns of folded, non-helical regions of RNA4.
Figure 1.

The sugar moieties of DNA (2′-deoxyribose, left) and RNA (ribose, right). The 2′-hydroxyl group of ribose is a powerful donor and acceptor of hydrogen bonds. The illustrated puckering of the sugar rings corresponds to the forms that prevail in B-DNA (C2′-endo, left) and A-RNA (C3′-endo, right) structures. Oxygen is depicted in red, carbon in grey, and nitrogen in blue. The “NB” label denotes the nitrogen atom, either N9 (purine) or N1 (pyrimidine), via which the nucleobase is linked to the anomeric C1′ atom of the sugar. Hydrogens are omitted for the sake of clarity.
The complexity of RNA interactions, however, is even greater than that suggested by the combination of three nucleotide edges used in standard RNA base-pairing classifications1-4. For example, many base-base, base-sugar, and sugar-sugar H-bonds occur in concert with highly conserved base-phosphate H-bonds, a classification of which has been proposed by combining RNA structural bioinformatics and QM approaches5,6. The preference of the 2′-hydroxyl group for particular H-bond acceptors — such as the phosphodiester bridging oxygens (O3′(n) and O5′(n+1), where “n” denotes the residue number in the 5′ → 3′ direction of the RNA chain), the anionic phosphate oxygens (O1P and O2P of the (n+1)-th residue), or the adjacent sugar ring oxygen (O4′(n+1)) — is strongly modulated by the sugar-phosphate backbone conformation and vice versa. Thus the 2′-hydroxyl group affects the conformation of both the backbone and the sugar ring. This coupling of structural variables makes description of the RNA sugar-phosphate backbone potential energy surface a more challenging task than that of double-helical DNA. Whereas QM studies of base stacking and base pairing are relatively easy and thus abundant in the literature, including investigations specifically devoted to RNA interactions7-17, there are rather few QM studies that deal with the stabilizing features and basic conformational properties of the sugar-phosphate backbone18-30. Moreover, most of the published studies deal with the DNA backbone, partially because the 2′-OH of ribose complicates QM computations, i.e., the hydroxyl group tends to form spurious biochemically irrelevant H-bonds in model computations. At the same time, QM studies of the NA backbone are needed, since adequate description of the sugar-phosphate backbone is a notorious weakness of molecular simulation force fields. Subtle imbalances in the description of the nucleic acid backbone can lead to entire degradation of simulated nucleic acid systems30-32. In addition, description of the backbone is challenging experimentally. For example, the sugar atoms are much less visible than the nucleobases and phosphates in crystallographically derived electron densities. Inherent flexibility of the backbone often precludes unambiguous refinement of the nucleotide conformation from such data.
An understanding of the principles of RNA folding is essential to resolution of the mechanisms that underlie the multitude of functions that RNA molecules execute. RNA structures often assemble in a modular fashion and make use of evolutionarily conserved sequences and three-dimensional (3D) patterns to perform various tasks. Therefore, knowledge of the stabilities of the structural modules provides a rationale for their evolutionary conservation and may elucidate why selected nucleotides at the primary informational level are critical for module performance.
The present paper investigates one of the most interesting RNA 3D structural submotifs known as a dinucleotide platform. By submotif we mean a characteristic non-canonical RNA 3D element that does not fold independently and that requires auxiliary structural elements to form an autonomous 3D building block. The intrastrand dinucleotide platforms are modules formed by two adjacent nucleotides 5′-XpY-3′ with side-by-side XY paired nucleobases. In other words, the unique backbone topology of the dinucleotide platform places the two consecutive bases in a common plane (Figure 2). Examples of dinucleotide platforms have been experimentally identified in a variety of atomic-resolution structures, including (i) GpU platforms in the complex of a small fragment of Escherichia coli 23S rRNA with the ribosomal L11 protein34, the sarcin/ricin domain of the large ribosomal subunit (Figure 3)35,36, the hammerhead ribozyme37, and other parts of the large ribosomal subunit38, (ii) ApA platforms in the P4-P6 domain of a Group I intron39 and the large ribosomal subunit38, (iii) UpC platforms in the genomic ribozyme precursor of the hepatitis delta virus40 and the cysteinyl-tRNA synthetase binary complex with tRNACys 41, etc. The resolution of the experimental structures ranges between 0.97 and 2.40 Å. Note that majority of the listed experimental structures were determined at resolution lower than 1.5 Å. Despite being satisfactory for many purposes, such resolution does not guarantee to unambiguously provide fine structural details of the sugar-phosphate backbone of the individual platforms QM computations are highly sensitive to.
Figure 2.

Two views of a dinucleotide platform submotif (here 5′-GpU-3′). The blue slabs depict the planes of the adjacent nucleobases. The approximate coplanarity of the bases is a distinctive feature of all dinucleotide platforms. The green solid lines denote the interbase side-by-side pairing and the green dashed lines symbolize the O2′…O2P H-bond typical of GpU33.
Figure 3.

Image of the sarcin/ricin domain in the ultra high-resolution (1.00 Å) structure of Escherichia coli 23S rRNA36 (PDB ID: 3dvz). The highly conserved asymmetric GpUpA/GpA miniduplex is depicted at the atomic level using a stick representation. Left, view along the duplex helix axis; right, side view. The GpU dinucleotide platform (G2655pU2656) is colored in red and its two key N2(G)…O4(U) and O2′(G)…O2P(U) H-bonds are depicted by green dashed lines. For the sake of clarity, the remainder of the domain is represented by a backbone trace and numerous other H-bonds stabilizing the GpUpA/GpA miniduplex are not depicted (see Figure 2 of Ref. 33 for details). Among them, interactions of A2665 (green) from the opposite strand with the GpU platform (red) form a characteristic in-plane nucleobase triad. The GpU…A2665 in-plane arrangement is stabilized by U…A interbase H-bonding (trans Watson-Crick/Hoogsteen pattern1,2) and G…A base-phosphate interaction (4BPh class,5 see below). Note that the G2655 base of the GpU platform is bulged out of the noncanonical RNA double helix. The remaining two bases, G2664 (blue) and A2657 (magenta), form a sheared GA base pair that stacks on the triad and completes the miniduplex motif.
The GpU platforms constitute over half of the identified dinucleotide platforms33. Analysis of the experimental geometries strongly suggests that their widespread presence may reflect a favorable interaction between the 2′-hydroxyl group of the 5′-residue (G) and the anionic phosphate group oxygen (O2P) of the following 3′-nucleotide (U) (cf. Figure 2). The apparent intrinsic stability of the GpU platform correlates with the highly conserved and naturally stiff sugar-phosphate backbone conformation33, which enables formation of the O2′…O2P H-bond.
Our aim is to gain a better understanding of the clear prevalence of the GpU platform compared to the ApA and UpC platforms (the 2nd and 3rd most frequent platforms) in known high-resolution structures by means of modern QM calculations. More specifically, we want to determine whether the frequency of occurrence of the different dinucleotide platforms stems from their intrinsic stabilities and electronic structures. Indeed, we show that the GpU platform is intrinsically more stable than the ApA and UpC analogs, and that this stability is captured by advanced electronic structure computations even in a small model system in the gas-phase. The predominance of the GpU and ApA platforms in RNA molecules is clear-cut33. The frequency of occurrence of the 3rd most frequent platform (UpC), however, does not differ noticeably from that of ApC, CpA, and GpG (see Table 1 of Ref. 33). As we are primarily interested in platform stabilization characteristics rather than stability assessments of each possible platform type, we restrict the present calculations to only one of the less frequent platforms, UpC. The number of examples of UpC platforms in better-resolved structures also exceeds the numbers for the excluded platforms (see below). As shown below, even for the UpC platform the available experimental structural data preclude reliable QM analysis (see Results and Discussion).
MODEL SYSTEMS
The different atomic compositions of the various dinucleotide platforms preclude direct comparison of their stabilities in terms of the total electronic energies. Thus, we divide the dinucleotide platform into two parts: the common sugar-phosphate backbone fragment, which can be easily compared for all studied dinucleotides, and the adjacent nucleobases alone. The stabilization contribution due to interbase interaction is estimated via a standard interaction energy computation. Note that, unlike the electronic energy, the interaction energy is a size-independent quantity and thus well suited for comparison of base…base stabilization contributions. Hence it is possible to compare the interaction energies of base pairs of arbitrary atomic compositions directly. It, however, should be stressed that this partition neglects the potential coupling effects between the two parts of the dinucleotide. In particular, the ApA platform might be stabilized via the O2′…N7(n+1) interaction, which is lost upon division of the system into subsystems.
The selection of dinucleotide platforms is based on a non-redundant data set of experimentally determined structures of 2.5-Å or better resolution characterized using the 3DNA software package42,43 (see Supporting Information for Ref. 33, Table S2). The set contains a total of 72 dinucleotide platforms, including 43 5′-GpU-3′, 15 ApA, 6 UpC, 2 ApC and 2 CpA platforms, but only single occurrences of CpC, GpA, GpG, and UpA platforms. Of the 43 listed GpU platforms we have selected all (12) platforms resolved at 1.9-Å or better resolution and 17 random platforms from the remaining examples. We have further supplemented the GpU set with three additional platforms, not included in the above data set, from recent ultra high-resolution structures of the sarcin/ricin domain from Escherichia coli 23S rRNA36 (PDB IDs: 3dvz, 3dw4, and 3dw6), corresponding to a total of 32 (12+17+3) GpU platforms. We also analyzed all but one of the ApA platforms, which is a DNA dinucleotide platform, and five of the six UpC platforms. Although some of the 43 detected GpU platforms were not taken into account, particularly the less well-resolved ones, the principal limitation of the current study is the deficiency in the number of ApA and UpC structures. Therefore the somewhat arbitrary selection of the 17 poorer resolution GpU platforms has no effect on the conclusions of this study.
The initial geometries of the GpU, ApA, and UpC intrastrand dinucleotide platforms were extracted from the relevant dinucleotide steps in known X-ray structures (Supporting Information, Table S1) and subsequently subjected to a manual two-step chemical modification. First, the chain was terminated with methyl groups and the appropriate atoms were saturated with hydrogens. Specifically, the phosphate group of the n-th residue was replaced with a methoxy group (-O-CH3) and the O3′ of the (n+1)-th nucleotide was capped with a methyl group (-CH3). The presence of the methyl groups, rather than hydrogen atoms, at the ends of the backbone chain normally precludes the formation of spurious intramolecular H-bonds that may bias the energetics. The 2′-hydroxyl groups of both β-D-ribose groups were initially oriented so that the C3′-C2′-O2′-H2′ dihedral angle was equal to 0°, and the CMet- O5′/O3′ bond length of both 5′- and 3′-ends was set to 1.4 Å. Our unpublished data show that this arbitrary initial orientation guarantees the most energetically favorable orientation after gradient optimization. The initial values of the C-H, N-H and O-H distances were set to 1.09 Å, 1.00 Å, and 1.00 Å, respectively.
Figure 4 shows the three model systems used in the present study. The left image shows the full dinucleotide platform model with methyl-capped ends while the center image shows a model system, abbreviated as rSPSOM (ribonucleic-version of the Sugar-Phosphate-Sugar model with capping -O-Methyl groups), that mimics the backbone segment of the dinucleotide. The rSPSOM model originates from the SPSOM model system, which has been extensively used to study the DNA backbone18,19. The rightmost model captures the base…base interaction that is missing from the rSPSOM representation but found in the full dinucleotide model.
Figure 4.

Model systems used to treat platform energetics: (left) full dinucleotide platform (here 5′-GpU-3′); (center) rSPSOM; (right) base-to-base (here GU). Phosphorus is depicted in orange, oxygen in red, nitrogen in blue, and carbon in grey. Hydrogens are omitted for the sake of clarity. The 5′ → 3′ progression of the RNA chain is from left to right.
The rSPSOM model system (Figure 4, center) has been used to study the intrinsic stability of the platform backbone. The starting structure of the sugar-phosphate fragment in the reduced backbone model is identical to that in the full starting dinucleotide. The starting structures for the base-pair calculations were taken from optimized (i.e., partially relaxed, see below) dinucleotide model geometries.
We have studied two sets of structures: (i) structures taken directly from experiment and (ii) structures based on the idealized backbone conformations44 of those backbone families occurring in the dinucleotide platforms. We utilized the Suitename 0.3 (categorization) Kinemage and Dangle 0.63 (backbone torsion angle determination) software to group the extracted rSPSOMs of the dinucleotide platforms into known conformational categories — see http://kinamage.biochem.duke.edu44. Although the conformations of some of the backbone units could not be assigned (13 instances), the majority of structures fell into one of four known categories (out of 46) labeled herein using Roman numerals I-IV: one with the homogeneous C3′-endo sugar puckering and gauche−, gauche− phosphodiester conformation typical of A RNA (I, one instance), two with mixed C2′-endo/C3′-endo sugar puckering and concomitant rearrangement of the phosphodiester linkage to a trans, gauche− state (categories II and III with 24 and 6 instances, respectively), and the last with the same mixed puckering and an all-trans phosphodiester arrangement (IV, 7 instances). Note that each of the four I-IV categories coincides with a respective RNA backbone family determined by clustering analysis by Richardson et al., see Ref. 44 and Table 1. The computations on the idealized structures are based on these four groupings, i.e., generated from the average backbone torsions listed in Table 1. Since the conformational groupings are based on a sugar-to-sugar unit (defined by the 5′ → 3′ sequence of torsions starting with θ for the first nucleotide and terminating with θ for the last), the γ torsion of the first nucleotide in the rSPSOM model was taken from an appropriate experimental structure (Table 1). The commonly used nomenclature of the six sugar-phosphate backbone torsion angles (labeled as α, β, γ, θ, ε, and ζ) and the glycosidic torsion (χ) describing the relative orientation of a nucleobase with respect to the attached sugar ring is described in Figure 5.
Table 1.
Comparison of the RNA sugar-phosphate backbone torsion angles (degrees) of the four idealized conformational categories found in dinucleotide platform structures with those in standard A-RNA steps. For the backbone torsion angles nomenclature, see Figure 5.
| Conformational Classa |
Labelb | Average sugar-phosphate torsion anglesd | |||||||
|---|---|---|---|---|---|---|---|---|---|
| γ c | δ | ε | ζ | α+1 | β+1 | γ+1 | δ+1 | ||
| I | &a | 56 | 82 | −169 | −95 | −64 | −178 | 51 | 82 |
| II | #a | 164 | 148 | −168 | 146 | −71 | 151 | 42 | 85 |
| III | 0a | 53 | 149 | −137 | 139 | −75 | 158 | 48 | 84 |
| IV | 4g | 48 | 148 | −103 | 165 | −155 | 165 | 49 | 83 |
| A-RNA | 1a | 54 | 80 | −150 | −73 | −65 | 173 | 54 | 80 |
Conformational classes based on distinguishing torsional features of the sugar-phosphate-sugar unit: I - A-like homogeneous C3′ -endo puckered sugars, gauche−, gauche− phosphodiester; II and III - mixed C2′-endo/C3′-endo puckering, trans, gauche− phosphodiester; IV - mixed C2′-endo/C3′-endo puckering, trans, trans phosphodiester.
Respective RNA family labels according to the Richardson et al. nomenclature44.
γ values for classes I-IV taken respectively from appropriate experimental examples (PDB ID/Nucleotide/Chain): 1hq1/163/B46; 1s72/137147, 1s72/26547, and 1hr2/226/A48. The idealized A-RNA structure is periodic and thus γ is identical to γ+1.
Average backbone torsions found by Richardson et al. (categories I-IV) and Schneider et al. (A-RNA). For more details see Refs. 44 and 45.
Figure 5.
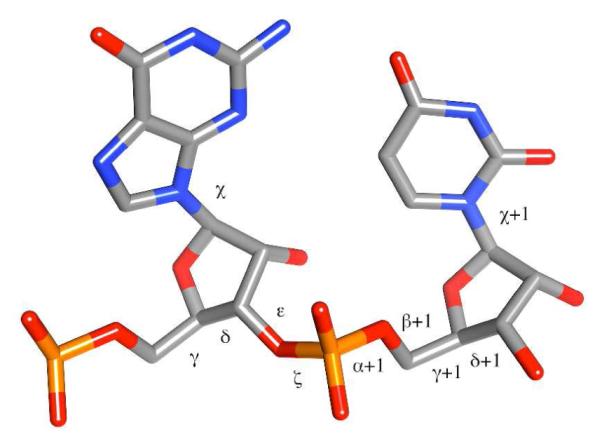
Standard labeling of the sugar-phosphate backbone (α-ζ) and glycosidic (χ) torsion angles of a dinucleotide unit (5′-GpU-3′). The “+1” next to a Greek letter denotes a respective backbone torsion of the adjacent nucleotide in the 5′ → 3′ direction (from left to right in this figure).
The torsion angles of the canonical A-RNA structure used in this paper differ slightly, at most by 2° (Table 1), from those of the reference state of the same name used in the backbone classification software, i.e., we use the older data of Schneider et al.45, which have no effect on the energetics. In view of the periodicity of the A-RNA conformational substate, the γ torsion of the first nucleotide was set to that of the second nucleotide (54°). The values of the quasi-β torsion at the 5′-end (the quasi prefix indicates that the actual β torsion, defined as P-O5′-C5′-C4′, differs from the quasi-β, where the phosphate group is swapped with a methoxy group) and the quasi-ε+1 torsion at the 3′-end were similarly adjusted to coincide with the β and ε+1 dihedrals in the sugar-to-sugar unit. The main reason why we need to define the quasi torsions is the minimization protocol issue discussed into more depth in the Supporting Information in the A-RNA optimization constraints paragraph.
Different sequences presumably place distinct restrictions on the sugar-phosphate backbone geometry in order to form a platform structure in which adjacent bases interact via side-by-side hydrogen bonding. Hence in additional calculations we combined the three studied base sequences (GU, AA, UC) with the four identified conformational classes (I-IV), in order to find compatible combinations capable of forming a platform submotif. The fusion was performed by attachment of the selected nucleobases to the C1′ atoms of the sugar residues of the idealized optimized rSPSOM model system for each conformational type. The two glycosidic torsions, i.e., χ and χ+1, were adjusted manually so that the resulting dinucleotide resembled a platform-like geometry. The arranged dinucleotide system was then subjected to a constrained geometry optimization with backbone torsions kept frozen at the initial values, i.e., at the respective class averages listed in Table 1. The compatibility of the base composition and backbone family to form a dinucleotide platform was assessed visually.
COMPUTATIONAL METHODS
The geometries of the dinucleotide and rSPSOM model systems were pre-optimized with constrained backbone torsions using the hybrid meta-GGA Minnesota M06 functional49 and the 6-31+G(d,p) basis set. The systems were then re-optimized with all previously applied backbone constraints at a higher level using the dispersion-corrected DFT-D approach. We used the meta-GGA TPSS functional50 with an entirely local exchange-correlation description augmented with the Jurečka’s empirical dispersion B-0.96-27 type term (the abbreviation TPSS-D thus marks a particular form of DFT-D method)51 and combined with the 6-311++G(3df,3pd) set of atomic orbitals, hereafter labeled as LP (according to the ‘Large Pople’s basis set’). As we have previously shown18, to keep the systems in biologically meaningful conformations, we had to fix the backbone torsions at their experimentally determined values via application of constraints on all the backbone dihedrals (from γ up to θ+1 following the 5′ → 3′ direction). The same set of angles as listed in Table 1 was constrained for experimental as well as idealized structures. In the case of dinucleotide platforms the two additional glycosidic angles (Figure 5), χ and χ+1, were constrained at their initial values as well. Some additional constraints on the quasi-torsions were applied in relaxation of canonical A-RNA structure. As these calculations are not essential for our study, the A-RNA constraints are described in Supporting Information.
The TPSS-D/LP gradients were calculated with Turbomole 5.1052 using the resolution of identity (RI) approximation53-55. The empirical dispersion corrections were obtained with an in-house Fortran code and then added to the pure DFT energy upon the gradient calculation run. To take advantage of the efficient and robust optimization algorithms of the Gaussian03 software package56 and the superior scalability of the Turbomole code, we developed a scheme whereby the electronic energy gradients calculated by Turbomole are passed to Gaussian03 to execute the energetically downhill geometry alteration. The modified geometry is then passed back to Turbomole and serves as a new input structure for the next cycle. This iterative procedure repeats until convergence criteria imposed on the energy and the density matrix are met.
The single-point energies of the rSPSOM model systems were calculated at the RI-MP2/aug-cc-pVDZ and aug-cc-pVTZ57,58 levels of theory. We also estimated the energies at the complete basis set limit (RI-MP2/CBS) according to Halkier et al. extrapolation scheme59,60. The extrapolation to CBS effectively eliminates intramolecular basis set superposition (BSSE) and incompleteness (BSIE) errors, both of which bias the results. Our preceding experience indicates that the aug-cc-pVDZ → aug-cc-pVTZ (D→T) based extrapolation provides results that more likely approach the MP2/aug-cc-pVQZ level rather than true MP2/CBS behavior. Thus some residual BSSE/BSIE errors are likely to remain51. As shown elsewhere, CCSD(T) corrections are not necessary for the backbone computations18. The extrapolated Hartree-Fock (HF) and the MP2 correlation contributions are evaluated as follows:
where X is the cardinal angular momentum quantum number of the respective basis set (X = 2 for aug-cc-pVDZ, X = 3 for aug-cc-pVTZ, etc.) and parameter θ = 1.43, value of which is optimized for the D→T variant of extrapolation. The system-unique coefficients A and B along with and , the correlation and the HF components of the total electronic energy extrapolated to CBS, respectively, need to be determined via solving listed equations, linear in all unknowns. and terms representing the same components obtained using the aug-cc-pVXZ set of basis functions need to be inserted in the given equations.
The geometries of the methyl groups, which were added to the N1/N9 atoms of nucleobases after their detachment from the TPSS-D/LP optimized dinucleotides, were relaxed using the M06 functional along with the 6-31+G(d,p) basis set. The interaction energies of the base pairs (see Figure 4, base-to-base model) were calculated at the MP2 level of theory with a sufficiently large aug-cc-pVDZ basis set and the density fitting approximation (DF)61. We did not employ CCSD(T) to include higher order correlation effects, as they are rather insignificant for H-bonded base pairs62,63. The BSSE-corrected interaction energy of a base pair ( ΔEM..N) between two interacting nucleobases M and N is defined as
where E MN stands for the electronic energy of the supersystem and the and are the BSSE-free electronic energies of the isolated subsystems obtained using the standard counterpoise procedure64. Since we expect the monomer deformation contributions to the interaction energies to be uniform throughout the base-pair set and since we are interested in relative energies rather than absolute values, the deformation of the monomers was neglected. The interaction energy calculations were carried out with the Molpro 2006.1 package65.
Wave functions of the five idealized rSPSOMs (Table 1) were investigated with an atoms-inmolecules (AIM) analysis66-68 to reveal and compare the stabilizing effect of the conformationally specific 2′-hydroxyl H-bond. Wave functions of selected base pairs were also subjected to AIM analysis with the intent to compare the strength of the interbase H-bonds. AIM analyzes the local electron density curvatures and finds critical points (CPs), which can provide information on the intramolecular H-bond network. Note that the main motive why we utilized the AIM analysis was only to reveal CPs, which give evidence of the intra- (rSPSOMs) and intermolecular (base…base) interactions. Thus an existence of a CP between X-H and Y atoms (X/Y = O, N, C) gave us a proof of the X-H…Y H-bond, while its local characteristics, the electron density (ρ) and its Laplacian (▽2ρ), measure nontrivially the strength of a given interaction. The topologies of the charge densities were computed using the converged TPSS/LP wave functions (note that the dispersion correction does not affect the wave function). The Cartesian 6d and 10f basis functions were substituted for the standard 5d and 7f functions, as recommended for the AIMPAC code69,70.
The origin of initial structures as well as a summarized sequence of computations is symbolically depicted in Figure 6.
Figure 6.

A symbolic flowchart describing the complete sequence of computations. The numbered steps, denoted by arrows, are as follows: (1) extraction of model systems (numerals in parentheses in the second row of boxes denote the number of systems); (2) M06/6-31+G(d,p) and subsequent TPSS-D/LP constrained geometrical optimizations; (3) calculation of RI-MP2/CBS single-point energies; (4) removal of the sugar-phosphate backbone segment followed by attachment of terminal methyl groups to N1/N9 of pyrimidines/purines; (5) relaxation of methyl groups at the M06/6-31+G(d,p) level of theory; (6) location of H-bonds via AIM analysis; (7) evaluation of DF-MP2/aug-cc-pVDZ base…base interaction energies; (8) manual attachment of nucleobases to optimized idealized rSPSOMs and inspection of mutual compatibility to form a dinucleotide platform submotif; and (9) assignment of backbone conformational class. The experimental structures out of which idealized rSPSOMs were derived are listed in the footnote of Table 1.
NOTATION
The individual structures are labeled as XY-z-N, where XY represents the adjacent nucleobases of the given platform (GU, AA, or UC) in the 5′ → 3′ direction, z stands for the respective PDB accession code, and N denotes the assigned structure number (for example, the ten different GpU platforms identified in the large ribosomal subunit of Haloarcula morismortui, PBD ID 1jj2, are labeled as GU-1jj2-1 up to GU-1jj2-10). Generally, the platforms and the corresponding rSPSOM fragments are referred to as XpY, whereas the base-to-base model systems are simply labeled as XY (Figure 4). The complete list of structures considered in the current work, together with their backbone torsion angles, is available in the Supporting Information, Tables S1 and S2.
RESULTS AND DISCUSSION
Base-to-base contribution
The base-to-base model systems (Figure 4, right) were constructed as described under Model Systems. The bases associate via a cis Sugar/ Hoogsteen edge interaction pattern1,2, in which the 5′-nucleoside exposes its Sugar edge whereas the 3′-residue exploits the Hoogsteen edge.
The interaction energies of the platform-derived GU base pairs range between −6.1 kcal.mol−1 (GU-1u8d-1) and −8.9 kcal.mol−1 (GU-2qus-1), with a mean value/standard deviation of −8.0 ± 0.5 kcal.mol−1 (Figure 7; histogram shown in black). The stability of the H-bonded GU base pairs is ensured by a strong N2(G)…O4(U) H-bond, which is more stabilizing than the equivalent N3(A)…N6(A) and O2(U)…N4(C) H-bonds of the respective AA and UC base pairs (see the AIM results below). In addition, a second rather marginal H-bond forms between N3(G) and C5(U) (Figure 8). Nevertheless, the N3(G)…C5(U) interaction is not an artifact of the selected model and might, at least slightly, contribute to base-pair stabilization.
Figure 7.
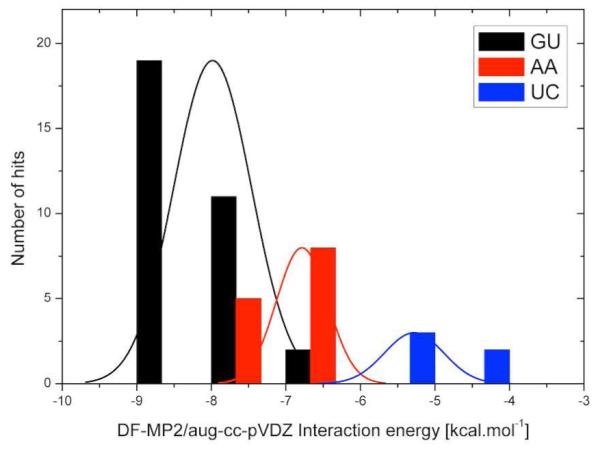
Distribution of the DF-MP2/aug-cc-pVDZ interaction energies of the GU (black), AA (red), and UC (blue) base pairs. The interaction energy axis is partitioned into seven bins of 1.0 kcal.mol−1 width. The solid curves, shown in the same colors, are the corresponding standard Gaussian normal distributions computed from the interaction energy data and thus with an infinitesimal bin width. Note that the AA interaction energies would be further reduced (in absolute value) by ~1 kcal.mol−1 if the artificial C9Met(A)…N7(A) interactions were excluded. Since most of the experimental structures were determined at low atomic resolution, the energy variability primarily reflects the error of the experiments.
Figure 8.

Sample structures of GU, AA, and UC intrastrand base pairs interacting via H-bonds. The green solid lines depict the main stabilizing interactions. The weak C-H…O/N contacts revealed by AIM analysis are indicated by red dashed lines. Note that the C9Met(A)…N7(A) interaction of the AA base pair is artificial (see the text). The hydrogen atoms and identified critical points have been omitted for the sake of simplicity. H-bonds are depicted in a standard way, i.e. using a (dotted) line linking the respective heavy atoms (C/O/N) without regards to the precise location of the particular CP. Note that the given CP does not need to match the geometrical line connecting the heavy atoms. More precisely it does not even need to lie on the line connecting H and acceptor atom nuclei. For complete molecular graphs of GU/AA/UC base pairs with all critical points, see Supporting Information.
Two intermolecular critical points, each giving evidence of a H-bond, were detected in the AIM analysis of both the representative and the most stable (GU-2qus-1) GU base pair. The electron density and its Laplacian values of 0.033 and 0.024 a.u., respectively, at the critical point of the N2(G)…O4(U) H-bond reveal this particular contact to be the strongest and the most stabilizing of the studied platform H-bonds (Table 2). The second critical point between the N3(G)…C5(U) atoms, characterized by (ρ; ▽2ρ) values of (0.009; 0.007) a.u., indicates a weak C-H…N interaction. Based on our previous experience with interactions like this at the boundary between H-bonds and van der Waals contacts [18], we estimate the contribution to the interaction energy to be ~1.0 kcal.mol−1 (see also the following paragraphs). Note that the AIM analysis does not allow quantitative assessment of the stabilization contributions of the respective interactions, although values of ρ should correlate with the strength of interaction. The positive sign of ▽2ρ, which indicates depletion of the electron density at the given stationary point, signifies the ionic nature (as opposed to covalent character) of both contacts. The results are in accord with the AIM analysis of the canonical AU base pair71 in which the ratio of ρ and ▽2ρ values of the N6(A)…O4(U) and C2(A)…O2(U) interactions are approximately 4.3 and 3.3, respectively. The equivalent ratios of the ρ and ▽2ρ for N2(G)…O4(U) and for the weak N3(G)…C5(U) interactions stabilizing the GU-2qus-1 system are ~3.7 and ~3.4.
Table 2.
H-bonds detected by AIM analysis to stabilize platform base pairs. The entries correspond to the most stable example of each type of base pair (in terms of interaction energy). The distances between heavy atoms are given in Å, the hydrogen-bonding A-H…B (A/B = O, N, C) angles are given in degrees, and the charge density along with its second derivatives in a.u. The major stabilizing H-bonds are highlighted in boldface. Note that the spurious C9Met(A)…N7(A) interaction of the AA-1hr2-3 pair is not relevant to real RNA systems.
| Base pair | Acceptor | Donor | Distance | Angle | Density (ρ) | Density Laplacian (▽2ρ) |
|---|---|---|---|---|---|---|
| GU-2qus-1 | O4(U) | N2(G) | 2.9 | 164.1 | 0.033 | 0.024 |
| N3(G) | C5(U) | 3.6 | 160.5 | 0.009 | 0.007 | |
| AA-1hr2-3 | N3(A) | N6(A) | 3.0 | 150.8 | 0.022 | 0.017 |
| N7(A) | C9Met(A) | 3.5 | 150.1 | 0.009 | 0.007 | |
| UC-1drz-1 | O2(U) | N4(C) | 3.0 | 157.8 | 0.019 | 0.020 |
| O2(U) | C5(C) | 3.3 | 129.4 | 0.009 | 0.009 |
The interaction energies of the AA base pairs span the range between −6.3 kcal.mol−1 (AA-2r8s-1) and −.3 kcal.mol−1 (AA-1hr2-3) with an average value/standard deviation of −6.8 ± 0.3 kcal.mol−1 (Figure 7; red histogram). The AA-1hr2-5 system (−2.6 kcal.mol−1) is the only outlier and is accordingly excluded from the statistics. See the Supporting Information for a detailed description of this system.
The interaction energies of the AA base pairs are probably slightly biased by a weak artificial C9Met(A)…N7(A) contact (Figure 8) that stems from N9-methylation. In order to estimate the contribution of this spurious contact to the interaction energies, we replaced the 9-methyl groups in the most stable AA-1hr2-3 base pair with hydrogens. Interaction energy calculations suggest that the unnatural contact lowers the real interaction energy by approximately 1 kcal.mol−1. Consequently the listed AA interaction energies are systematically shifted to lower (more stabilizing) values and thus the actual stabilization of AA base pairs is overestimated by about ~ 1 kcal.mol−1.
The AIM analysis of the most stable AA-1hr2-3 system revealed two critical points, which are depicted in Figure 8 as H-bonds. The electron density and its Laplacian (ρ; ▽2ρ) at the critical point of the major N3(A)…N6(A) H-bond have respective values of (0.022; 0.017) a.u. while those of the artificial C9Met(A)…N7(A) contact have values of (0.009; 0.007) a.u. (Table 2).
The UC H-bonded base pairs exhibit lower stability than the GU and AA systems, with the interaction energies ranging from −4.8 kcal.mol−1 (UC-1u0b-1) to −5.6 kcal.mol−1 (UC-1drz-1) and the average value/standard deviation being −5.3 ± 0.4 kcal.mol−1 (Figure 7; blue histogram). Significant deviation from base-base coplanarity accompanied by elongation of the O2(U)…N4(C) distance reduces the absolute values of the energies of UC-1u0b-1 (O2…N4 ~ 3.4 Å) and UC-1vc7-1 (O2…N4 ~ 3.3 Å) interactions to −4.8 kcal.mol−1 and −4.9 kcal.mol−1, respectively. The AIM analysis of the most stable UC-1drz-1 base pair detects two critical points, one involving the O2(U)…N4(C) pair with (ρ; ▽2ρ) values of (0.019; 0.020) a.u. indicative of H-bonding and a second involving the O2(U)…C5(C) contact with (ρ;▽2ρ) values of (0.009; 0.009) a.u. suggestive of a minor interaction, i.e., ~ 1 kcal.mol−1.
From the perspective of base-to-base contributions, stabilization of the dinucleotide platforms decreases in the following order: GU > AA > UC. The superior stability of the GU base pairs is evident from both the interaction energies and the AIM data. The average interaction energy of the GU pairs is about 1.2 kcal.mol−1 lower than that of the AA systems and ~ 2.7 kcal.mol−1 lower than that of the UC pairs. If the spurious C9Met(A)…N7(A) interaction is taken into account, the difference between the GU and AA pairs is expected to reach ~ 2 kcal.mol−1. See the Supporting Information (Table S3) for a complete list of GU, AA, and UC base-pair interaction energies.
Sugar-phosphate backbone contribution
The rSPSOM fragments of different dinucleotide platform structures (see Figure 4, center) were used to characterize the intrinsic energy preferences of the sugar-phosphate backbone. As explained under Computational Methods, the computations were carried out with constrained dihedral angles. The canonical A-RNA backbone conformation served as the reference structure with energy of 0.0 kcal.mol−1 (Figure 9, the green dashed line; see Table S4 in the Supplementary Information for the complete list of rSPSOM relative energies). The individual structures, which could be assigned to a known conformational class, are denoted by one of the four categories listed in Table 1 (see Table S5 in the Supplementary Information for a detailed listing). Those platform backbones that could not be assigned to any class are marked as “U” (Unknown). The quality of the conformational assignment, called the “suiteness” (S) in the classification software44, is expressed as a number within the range of [0,1], where the maximum value of 1 corresponds to a structure with torsions that perfectly match those of the conformational reference state (Table 1). The systems discussed below include a tag that denotes the assigned conformational class (if any) and the S-value, i.e., system/class/S-value. For example the GU-1jj2-1 rSPSOM assigned to class I (or &a following the nomenclature of Richardson et al.) with a suiteness of 0.785 would be tagged as GU-1jj2-1/I/0.785. The intrinsic rSPSOM backbone stabilities of the four classes of platform conformations are reported in Table 3.
Figure 9.

Distribution of the RI-MP2/CBS relative energies of rSPSOM models of GpU (black), ApA (red), and UpC (blue) experimental platform structures (i.e., idealized rSPSOMs are not included). The relative energy, reported along the horizontal abscissa, is partitioned into twelve bins of 1.0 kcal.mol−1 width. The curves correspond to standard Gaussian normal distributions based on the mean values and standard deviations, with infinitesimal bin width. The green dashed line at 0.0 kcal.mol−1 denotes the energy of the A-RNA reference state.
Table 3.
RI-MP2/CBS relative energies (kcal.mol−1) and characteristics of the H-bonds donated by the 2′-hydroxyl group in idealized rSPSOM models of the four classes of dinucleotide platform structures. Distances between O2′ and acceptor oxygens are given in Å and O2′-H…O angles in degrees. Charge densities along with second derivatives are given in a.u.
| Class | Energy | O2′-H interaction | Distance | Angle | Density (ρ) | Density Laplacian (▽2ρ) |
|---|---|---|---|---|---|---|
| I | −3.2 | O2′…O5′(n+1) | 3.3 | 140.1 | 0.009 | 0.008 |
| O2′…O4′(n+1) | 3.1 | 144.7 | 0.011 | 0.011 | ||
| II | −1.1 | O2′…O2P | 2.9 | 168.2 | 0.032 | 0.022 |
| III | +0.2 | O2′…O2P | 3.3 | 162.1 | 0.013 | 0.010 |
| IV | +1.4 | O2′…O3′ | 2.7 | 120.4 | 0.026 | 0.025 |
| A-RNA | 0.0 | O2′…O3′ | 2.7 | 121.8 | 0.023 | 0.022 |
Before introducing the data, it is important to mention that determination of the energies of the sugar-phosphate backbones of RNA crystal structures is a difficult task. Although the positions of the bases and phosphorus atoms are usually visible in the experimental electron densities, the remaining backbone atoms are rather poorly defined. Furthermore, most X-ray structures of folded RNA molecules have been solved at relatively low resolution. This means that the individual refined backbone geometries are unavoidably affected by rather large data and refinement errors. Some of the geometries may even be unrealistic, as a consequence of averaging various substates. Thus, rather than assessing the individual geometries, we need to rely on sufficient statistics, a common practice in RNA structural bioinformatics. Unfortunately, the calculated energies are even more sensitive to data and refinement errors than the coordinates, given that energy is a highly nonlinear function of the geometries. Thus, one of the goals in this study has been to find out how much the calculated backbone energies are affected by uncertainties in the experimental structures. We assume that our results are unambiguous for the GpU platforms but less certain for the ApA platforms and even more uncertain for the UpC platforms.
The rSPSOM models derived from 32 GpU platform structures form a rather homogenous and well-defined group of similar conformers. Roughly two thirds of the structures (21) are more stable than the reference A-RNA structure (Figure 9, Supplementary Information, Table S4) and only five outliers are appreciably less stable. The relative energies span the range −3.6 kcal.mol−1 (GU-1jj2-1/I/0.79) to +7.0 kcal.mol−1 (GU-2ees-1/III/0.01) with the mean value/standard error of 0.3 ± 0.4 kcal.mol−1. The majority of the models (especially the low-energy conformers) fall in a single conformational class (II) with relatively high S-values (Supplementary Information, Table S5) and the characteristic O2′…O2P H-bond. This out-of-plane O2′…O2P H-bond is enabled by the C2′-endo puckering of the 5′-sugar moiety, which is one of the distinctive features of this group of structures.
One of the stable GpU backbones (GU-1jj2-1), however, adopts a distinctly different conformation from the others, with the 2′-hydroxyl group of guanosine interacting with the uridine phosphodiester O5′(n+1) and the sugar ring embedded O4′(n+1). This particular backbone conformer is only marginally different from canonical A-RNA topology and is the only example of an A-like platform in the model structures (Supplementary Information, Table S5). Despite the structural differences compared to the typical class II GpU platform, the GU-1jj2-1 platform is embodied in a GpUpA/GpA miniduplex and thus may represent a transitional substate between A-RNA and the class II conformation. The superior stability of the idealized representation of this conformation compared to that of the predominant GpU platforms (classes I vs. II in Table 3) is a consequence of a more favorable overall backbone conformation and not the specific 2′-hydroxyl H-bonds. The most stabilizing interaction of the 2′-hydroxyl group is the O2′…O2P H-bond observed in the majority of GpU platforms (Table 3).
The five high-energy outlier systems, GU(-1q9a-1B,-483d-1B,-2ees-1,-2qus-1 and -2quw-1), bear low conformational resemblance to any of the 46 defined RNA backbone classes, i.e., the systems either could not be classified or, if assigned to a class, were characterized by a low S-value (Supplementary Information, Table S5). Three of the outliers, GU(-2ees-1,-2qus-1,-2quw-1), are derived from medium/low-resolution crystal structures, which likely account for the ill-defined backbone conformations. The remaining two outliers, however, are surprisingly based on high-resolution data (1q9a and 483d has the resolution of 1.0 and 1.1Å, respectively). Both examples correspond to one of the two distinct geometries assigned to a nucleotide platform and refined with ~50% populations. The high-resolution of the data seemingly provides sufficient information to attempt the refinement of two different co-existing geometries. Although the energy of one of the states is very favorable, the other is high in energy, which is a counter-intuitive result. The high energy may reflect the resolution limit, i.e., representation of the data by two substates may be still insufficient to describe the backbone exhaustively. Note that the resolution does not allow consideration of more than two substates in the refinement and determination of the relative population of the two suggested substates. In addition, only a very small segment of the molecule is refined with two substates; the surrounding segments are refined assuming a single geometry. Alternatively, the structure may be correct and the energetic penalty associated with the high-energy setting of the backbone torsions may be balanced by stabilizing factors not included in the computations. See the Supporting Information for further discussion of the outliers.
The relative energies of the rSPSOM models of ApA platforms are quite diverse, with values spanning the range −1.1 kcal.mol−1 (AA-1jj2-2/III/0.12) to +6.2 kcal.mol−1 (AA-1hr2-3/IV/0.01) and a mean value/standard error of 2.0 ± 0.6 kcal.mol−1 (Figure 9 and Table S4). The wide range of energies is clearly related to the fact that the backbone conformations are not uniform. Although the 3′-ends of the platforms are similar, there is considerable variation in the 5′-segments, particularly in the phosphodiester torsion angles and the sugar puckering. Six of the fourteen observed ApA backbone geometries could not be assigned to any conformational class. The remaining eight conformers fall into two groups. The first is a slight variant of the backbone adopted by most GpU platforms and the second a conformation with highly unusual trans arrangements of both phosphodiester torsions (Supplementary Information, Table S5). The poor match of the conformational assignments, as measured by the low S-values, suggests that the ApA backbone substates might be either ill-defined or rarely observed. The considerable uncertainties in the experimental structures naturally affect the computed energies. The most stable ApA backbone arrangement (AA-1jj2-2) includes the strong O2′…O2P out-of-plane H-bond, typical of GpU platforms and made possible by the same concerted changes in sugar puckering and phosphodiester linkage relative to A-RNA, i.e., C3′-exo or C2′-endo puckering of the 5′-nucleotide in combination with a trans ζ torsion angle. The Supporting Information includes analysis of the three high-energy ApA outliers.
The rSPSOM models of the five UpC platforms are highly diverse. There are very few structural features common to these few examples. Only one conformer (UC-1jj2-1) can be assigned to a known conformational class, albeit with a low suiteness value (S = 0.34). The relative energies span a wide range of values, between −3.1 kcal.mol−1 (UC-1sj3-1) and +6.1 kcal.mol−1 (UC-1drz-1); see Supplementary Information, Table S4. It is thus not possible to perform a viable statistical analysis of the energetics. Although the most energetically favored backbone arrangement (UC-1sj3-1) could not be assigned a conformational category, close examination of the torsion angles reveals its similarity to the ApA platforms with trans settings of both phosphodiester torsions. The advantageous setting of the backbone dihedrals cooperatively renders this conformer very stable. The fact that the given backbone conformation does not pertain to any defined conformational class, however, raises questions about its suitability within the full context of the RNA molecule. See the Supporting Information for further details. The experimental data clearly do not allow unambiguous assessment of the backbone of the UpC platform.
Compatibility of platform dinucleotide sequences with a backbone shape
Since only some backbone conformations facilitate platform formation, we combined the three studied dinucleotide sequences (GU, AA, and UC) with the four idealized rSPSOMs that fit identified RNA conformational classes (I-IV in Tables 1 and 3). We next checked whether the given sequence is capable of forming the platform submotif. Starting with each idealized rSPSOM structure we formed three different dinucleotide models and manually adjusted the glycosidic χ and χ+1 torsions to generate a platform-like geometry. The energy optimization was then carried with all backbone torsions (Table 1) fixed at the initial values, i.e., at the idealized structure.
Intramolecular O2′…O2P and interstrand base-phosphate H-bonds are cementing the preferred conformation of the GpU platform in the GpUpA/GpA miniduplex
Figure 10 shows that the 5′-GpU-3′ dinucleotide can form a platform motif with all four backbone conformational classes. The A-RNA-like backbone conformation (I) enables formation of GpU platforms with base…base interaction energies similar to those associated with the predominant mixed-pucker arrangement (II) (see Supplementary Information, Tables S3 and S5). The interaction energy of the bases attached to the former platform is highly favorable (~ −8.1 kcal.mol−1 for GU-1jj2-1). The intrinsic stability of the backbone is actually better (−3.2 kcal.mol−1 for the idealized class I geometry and −3.6 kcal.mol−1 for the GU-1jj2-1 model) than that of category II conformers (−1.1 kcal.mol−1, Table 3). The reason why the majority of the GpU platforms still belong to the mixed-pucker state (II) might stem from the key out-of-plane O2′…O2P H-bond. The interaction not only contributes to the intrinsic stability, but also forms a molecular “edge” above the base-base plane33. The edge is often specifically recognized by a nonadjacent guanine, as exemplified in the highly recurrent GpUpA/GpA miniduplex in the sarcin/ricin loop motif (Figure 11) where the whole GpUpA/GpA structure is stabilized by a 4BPh-type base-phosphate H-bond (according to nomenclature of Zirbel et al., see Ref. 5) with a guanine from the opposite strand to the platform. The ‘4BPh’ denotes a highly specific interaction between the Watson-Crick edge of a guanine and a nearby phosphate group. More specifically the interaction is ensured by two H-bonds, N1(G)…O2P and N2(G)…O5′, which cooperatively render the 4BPh interaction to be highly stabilizing. Therefore it seems that the evolutionary preference for the mixed-pucker conformation of the GpU platform with its specific and well-defined backbone II arrangement may reflect a combination of good intrinsic stability and the capability to contribute to a useful and very stable RNA topology. Perhaps, the high frequency of occurrence of the GpU platform II state might also be due to hydration or water-assisted stabilization. However, presently we have no solid indications of that. The experimental structures do not suggest any unusual hydration pattern. We plan to include hydration effects into our future studies of nucleic acids backbone conformational preferences, at least in an implicit fashion.
Figure 10.


Atomic-level representations of twelve dinucleotide platforms created from the four identified backbone conformations (I-IV), i.e., idealized rSPSOMs, and the three studied base combinations (GU, AA, and UC). The combination is called compatible if the expected base…base interaction pattern (i.e., Sugar edge/Hoogsteen edge, Figure 8) is formed. The H-bonds between adjacent bases and the interactions of the 2′-hydroxyl groups typical for the conformational type (Table 3) are denoted by dashed green lines.
Figure 11.

Atomic-level representation of the two-layered GpUpA/GpA miniduplex from the Escherichia coli 23S rRNA sarcin/ricin domain (PDB ID: 3dvz36) showing the anti-parallel 5′→3′ GpUpA trinucleotide (G2655pU2656pA2657) and the non-adjacent GpA dinucleotide (G2664pA2665). The O2′…O2P (purple dashed line) forms an out-of-plane edge above the GpU platform submotif that is specifically recognized by the non-adjacent G2664 (green and black dashed lines). The nucleotides in the lower plane (the GpU platform and the non-adjacent A2665) are depicted with filled sugar and nucleobase rings, while those in the upper plane (A2657 and the non-adjacent G2664) are represented by stick models with unfilled rings. Left, view perpendicular to the GpU platform plane; right, view in the platform (lower) plane.
The only backbone geometry that is compatible with formation of an ApA dinucleotide platform is the unusual conformation (IV) with trans arrangements of both phosphodiester torsions. This match correlates well with the conformational assignments of the experimentally determined ApA systems. Although the idealized mixed-pucker ApA backbones depicted in Figure 10 are incompatible with interbase H-bond formation, some specific ApA dinucleotides are capable of platform formation (AA-1gid-1/3 and AA-1jj2-2 with several backbone torsions shifted away from the mean values of the conformational reference states; see Supplementary Information, Table S5). Note, however, that the compatible conformation with a trans-trans phosphodiester linkage is the least stable one among the four identified conformational classes (Table 3) as a consequence of an anomeric effect, a result consistent with the higher conformational energies of all-trans model phosphate diesters72,73. The anomeric as a special case of a stereoelectronic effect disfavors trans-trans conformations of the phosphodiester linkage as it prevents a favorable interaction of a non-bonding electron pair on O5′ with the P-O3′ σ-bond, and vice versa for the P-O5′ bond. Insertion of the AA sequence into the A-like backbone substate (I) leads to a stack-like mode rather than an edge-to-edge interaction.
The UpC sequence appears to be compatible, at least based on our computations, with two backbone conformational substates, the predominant mixed-pucker state (II) and the high-energy arrangement with trans-trans phosphodiester torsions (IV). The characteristic O2(U)…N4(C) contact of the UpC platform cannot be established in either the A-like conformer (I) or the alternate mixed-pucker backbone (III) as the pyrimidine bases are too far apart.
Molecular dynamics simulations do not reproduce the signature interactions of the GpUpA/GpA miniduplex and the GpU platform
Explicit-solvent classical force field simulations represent a more common computational approach to study RNA systems than quantum chemistry. The simplicity of the classical treatment allows for the study of rather large RNA systems with inclusion of solvent and dynamics. The accuracy of simulations, however, is limited by the force field74. A reliable force field should be able to account for the highly complex backbone topology and the intricate network of molecule interactions found in the GpU platform and the GpUpA/GpA miniduplex. Indeed, the ~1 Å ultra high-resolution structures of the sarcin/ricin domain containing the GpUpA/GpA miniduplex can serve as a major benchmark for force field development and testing.
A few years ago, we reported a set of what was at that time quite long, multiple 25-ns molecular dynamics (MD) simulations of the sarcin/ricin domain with the Cornell et al. AMBER force field75. Although the simulated system appeared basically stable, we reported some local rearrangements in the miniduplex. The backbone of the GpU platform changed in the very early stages of the simulations, with subsequent loss of the base-phosphate H-bond between the two layers of the miniduplex (the interaction denoted by the two dashed black lines in Figure 11) and a surprising shift of the glycosyl rotation of the bulged guanine from a high-anti χ ~260° state to an even more high-anti χ ~320° arrangement. A conformation of this sort is very unusual compared to the normal anti χ ~180-200° arrangements found in RNA. The nucleotide generated in the simulations is thus subject to a large χ-dihedral internal energy penalty30,32. Now, in view of our more recent experience with RNA simulations, force field tuning30,32, the classification of base-phosphate interactions5,6, and the present QM computations, we think that the earlier simulation results need to be re-interpreted in the following manner. The key characteristic signature interactions and the structural features of the GpUpA/GpA miniduplex were, in fact, lost in the simulations. The O2′…O2P H-bond was not monitored in the earlier MD study, but it too was obviously lost. The shift of the bulged guanine nucleotide to even higher high-anti χ values than found experimentally (formally the simulated conformational state lies in the syn region) is evidence of a large struggle of different energy contributions in the simulated system, which evidently is not well described by the force field. Further deterioration of the system is (likely temporarily) prevented by additional interactions in the region, which lock the system close to the starting structure. We have recently performed a series of additional submicrosecond scale simulations of the sarcin/ricin domain (unpublished data), which fully confirm the above-described irreversible loss of several signature conformational features of the GpUpA/GpA miniduplex. The simulations are not improved with the latest parmbsc031 and parmχ 30 OL variants of the Cornell et al. force field. In the near future, we will perform additional investigations of the GpUpA/GpA miniduplex with the aim to identify which force field terms may be responsible for the rearrangements seen in the simulations and to see if some tuning of the force field may be possible. The force field is presently unable to describe the highly specific and prevalent type II backbone conformation of the platform with the key out-of-plane O2′…O2P H-bond.
CONCLUSIONS
A dinucleotide platform is an important noncanonical arrangement of RNA, which occurs at functionally important places in numerous molecules. The high-level quantum chemical calculations reported in this work lend credence to the hypothesis of Lu et al.33, that the intrinsic stability of the GpU dinucleotide platform is mediated by O2′…O2P intramolecular hydrogen bonding. This conclusion is based on an analysis of the torsions and an assessment of the inherent in vacuo stabilities of 51 experimentally determined dinucleotide platform structures (32 5′-GpU-3′, 14 ApA, and 5 UpC). We have separately studied the base…base interactions and the intervening sugarphosphate backbone segment, each of which contributes to the overall stability.
The base…base contributions show the following stability order, GU > AA > UC. The GU pairs are, on average, ~2.0 kcal.mol−1 and ~2.7 kcal.mol−1 more stable than the AA and UC pairs, respectively. The results are supported via Bader’s AIM electron topology analysis.
The GpU sugar-phosphate backbone is, on average, ~1.7 kcal.mol−1 more stable than the respective ApA conformer. We do not have enough experimental data to confidently assess the UpC platforms. Moreover, unlike ApA and UpC, the GpU backbone conformations are well defined and fit into one of the distinct RNA conformational classes identified by Richardson et al.44. We find the dominant GpU conformation to be more stable than the canonical A-RNA backbone and well suited to formation of a platform structure stabilized by the O2′…O2P hydrogen bond. There is, however, a rare but intrinsically even more favorable “A-like” backbone conformation, which also allows the GpU dinucleotide to take up a coplanar arrangement. In this geometry the 2′-hydroxyl group interacts with the O5′(n+1) and O4′(n+1) atoms in the succeeding 3′-nucleotide, rather than the anionic O2P. It, however, does not form the out-of-plane edge characteristic of most GpU platforms. The edge is very important for proper insertion of the GpU platform into the broader RNA context, as it is often recognized by a non-adjacent guanine from the opposite strand by very strong base-phosphate H-bond (Figure 11). The missing edge may account for the rather infrequent incidence of “A-like” GpU platforms and the dominance of the “O2′…O2P” arrangement.
The most prevalent geometry of the GpU platform appears not to be properly described by the force fields currently used in RNA simulations and is irreversibly lost in explicit-solvent simulations.
In summary, both base…base interactions and backbone conformations enhance the stability of GpU platforms over ApA and UpC platforms. These energetic preferences correlate with the high frequency of occurrence of GpU platforms as well as with the uniform and well-defined backbone conformations. Despite the obvious limitations of our work (in vacuo calculations on small model systems) our successful rationalization of key features of the dinucleotide platform demonstrates that the intrinsic energy terms play important roles in determining RNA structure and sequence patterns. QM calculations thus represent a viable complement of RNA structural bioinformatics and molecular simulations in studies of the broad diversity of RNA structures3.
Supplementary Material
ACKNOWLEDGMENTS
This work was supported by the project “CEITEC - Central European Institute of Technology” (CZ.1.05/1.1.00/02.0068) from European Regional Development Fund, by the Academy of Sciences of the Czech Republic [grant numbers AVOZ50040507, and AVOZ50040702], the Ministry of Education of the Czech Republic, [grant number LC06030 and MSM0021622413], the Grant Agency of the Academy of Sciences of the Czech Republic [grant number IAA400040802], the Grant Agency of the Czech Republic [grant numbers P208/10/2302, 203/09/1476, P208/11/1822, and 203/09/H046], and the National Institutes of Health, U.S. Public Health Service [grant numbers GM096889, and GM34809]. The present study was also financially supported by the South Moravian Centre for International Mobility within the framework of the “Brno Ph.D. Talent” scholarship program, which is highly appreciated. AM, JEŠ, PK and JŠ thank Zdeněk Salvet for the maintenance of the computing facilities of the Brno group. The access to the MetaCentrum computing facilities provided under the research intent MSM6383917201 is also acknowledged.
Footnotes
SUPPORTING INFORMATION List of crystal structures used in the current work to derive generic GpU, ApA, and UpC dinucleotide platforms; table of the backbone and glycosidic torsion angles of the studied platforms supplemented with polar distribution plots; table of DF-MP2/aug-cc-pVDZ interaction energies of the GU, AA, and UC base pairs; table of GpU, ApA, and UpC derived rSPSOM RI-MP2/CBS relative energies; table of backbone conformational class assignment; A-RNA optimization constraints, a detailed description of the AA-1hr2-5 base pair, an in-depth analysis of GpU, ApA, and UpC derived rSPSOM outliers; molecular graphs of GU/AA/UC base pairs.
This information is available free of charge via the Internet at http://pubs.acs.org
REFERENCES
- 1.Leontis NB, Westhof E. RNA. 2001;7:499–512. doi: 10.1017/s1355838201002515. [DOI] [PMC free article] [PubMed] [Google Scholar]
- 2.Leontis NB, Stombaugh J, Westhof E. Nucleic Acids Res. 2002;30:3497–3531. doi: 10.1093/nar/gkf481. [DOI] [PMC free article] [PubMed] [Google Scholar]
- 3.Sponer J, Sponer JE, Petrov AI, Leontis NB. J. Phys. Chem. B. 2010;114:15723–15741. doi: 10.1021/jp104361m. [DOI] [PMC free article] [PubMed] [Google Scholar]
- 4.Leontis NB, Westhof E. Curr. Opin. Struct. Biol. 2003;13:300–308. doi: 10.1016/s0959-440x(03)00076-9. [DOI] [PubMed] [Google Scholar]
- 5.Zirbel CL, Sponer JE, Sponer J, Stombaugh J, Leontis NB. Nucleic Acids Res. 2009;37:4898–4918. doi: 10.1093/nar/gkp468. [DOI] [PMC free article] [PubMed] [Google Scholar]
- 6.Zgarbova M, Jurecka P, Banas P, Otyepka M, Sponer JE, Leontis BN, Zirbel CL, Sponer J. J. Phys. Chem. A. 2011;115:11277–11292. doi: 10.1021/jp204820b. [DOI] [PubMed] [Google Scholar]
- 7.Sponer JE, Leszczynski J, Sychrovsky V, Sponer J. J. Phys. Chem. B. 2005;109:18680–18689. doi: 10.1021/jp053379q. [DOI] [PubMed] [Google Scholar]
- 8.Sponer JE, Spackova N, Kulhanek P, Leszczynski J, Sponer J. J. Phys. Chem. A. 2005;109:2292–2301. doi: 10.1021/jp050132k. [DOI] [PubMed] [Google Scholar]
- 9.Sharma P, Sponer JE, Sponer J, Sharma S, Bhattacharyya D, Mitra A. J. Phys. Chem. B. 2010;114:3307–3320. doi: 10.1021/jp910226e. [DOI] [PubMed] [Google Scholar]
- 10.Mladek A, Sharma P, Mitra A, Bhattacharyya D, Sponer J, Sponer JE. J. Phys. Chem. B. 2009;113:1743–1755. doi: 10.1021/jp808357m. [DOI] [PubMed] [Google Scholar]
- 11.Sponer JE, Spackova N, Leszczynski J, Sponer J. J. Phys. Chem. B. 2005;109:11399–11410. doi: 10.1021/jp051126r. [DOI] [PubMed] [Google Scholar]
- 12.Sponer JE, Reblova K, Mokdad A, Sychrovsky V, Leszczynski J, Sponer J. J. Phys. Chem. B. 2007;111:9153–9164. doi: 10.1021/jp0704261. [DOI] [PubMed] [Google Scholar]
- 13.Vokacova Z, Sponer J, Sponer JE, Sychrovsky V. J. Phys. Chem. B. 2007;111:10813–10824. doi: 10.1021/jp072822p. [DOI] [PubMed] [Google Scholar]
- 14.Chawla M, Sharma P, Hader S, Bhattacharyya D, Mitra A. J. Phys. Chem. B. 2001;115:1469–1484. doi: 10.1021/jp106848h. [DOI] [PubMed] [Google Scholar]
- 15.Sharma P, Sharma S, Chawla M, Mitra A. J. Mol. Model. 2009;15:633–649. doi: 10.1007/s00894-008-0384-y. [DOI] [PubMed] [Google Scholar]
- 16.Oliva R, Cavallo L, Tramontano A. Nucleic Acids Res. 2006;34:865–879. doi: 10.1093/nar/gkj491. [DOI] [PMC free article] [PubMed] [Google Scholar]
- 17.Oliva R, Cavallo L. J. Phys. Chem. B. 2009;113:15670–15678. doi: 10.1021/jp906847p. [DOI] [PubMed] [Google Scholar]
- 18.Mladek A, Sponer JE, Jurecka P, Banas P, Otyepka M, Svozil D, Sponer J. J. Chem. Theory Comput. 2010;6:3817–3835. [Google Scholar]
- 19.Svozil D, Sponer JE, Marchan I, Perez A, Cheatham TE, Forti F, Luque FJ, Orozco M, Sponer J. J. Phys. Chem. B. 2008;112:8188–8197. doi: 10.1021/jp801245h. [DOI] [PubMed] [Google Scholar]
- 20.Mackerell AD. J. Phys. Chem. B. 2009;113:3235–3244. doi: 10.1021/jp8102782. [DOI] [PMC free article] [PubMed] [Google Scholar]
- 21.Foloppe N, Mackerell AD. J. Phys. Chem. B. 1999;103:10955–10964. [Google Scholar]
- 22.Bosch D, Foloppe N, Pastor N, Pardo L, Campillo M. J. Mol. Struct.:THEOCHEM. 2001;537:283–305. [Google Scholar]
- 23.Wang FF, Gong L-D, Zhao D-X. J. Mol. Struct.:THEOCHEM. 2009;909:49–56. [Google Scholar]
- 24.Leulliot N, Ghomi M, Scalmani G, Berthier G. J. Phys. Chem. A. 1999;103:8716–8724. [Google Scholar]
- 25.Shishkin OV, Gorb L, Zhikol OA, Leszczynski J. J. Biomol. Struct. Dyn. 2004;21:537–553. doi: 10.1080/07391102.2004.10506947. [DOI] [PubMed] [Google Scholar]
- 26.Millen AL, Manderville RA, Wetmore SD. J. Phys. Chem. B. 2010;144:4373–4382. doi: 10.1021/jp911993f. [DOI] [PubMed] [Google Scholar]
- 27.Churchill CDM, Wetmore SD. Phys. Chem. Chem. Phys. 2011;13:16373–16383. doi: 10.1039/c1cp21689a. [DOI] [PubMed] [Google Scholar]
- 28.Poltev VI, Anisimov VM, Danilov VI, Deriabina A, Gonzalez E, Jurkiewiez A, Les A, Polteva N. J. Biomol. Struct. Dyn. 2008;25:563–571. doi: 10.1080/07391102.2008.10507203. [DOI] [PubMed] [Google Scholar]
- 29.Denning EJ, Priyakumar UD, Nilsson L, Mackerell AD. J. Comput. Chem. 2011;32:1929–1943. doi: 10.1002/jcc.21777. [DOI] [PMC free article] [PubMed] [Google Scholar]
- 30.Zgarbova M, Otyepka M, Sponer J, Mladek A, Banas P, Cheatham TE, III., Jurecka P. J. Chem. Theory Comput. 2011;7:2886–2902. doi: 10.1021/ct200162x. [DOI] [PMC free article] [PubMed] [Google Scholar]
- 31.Perez A, Marchan I, Svozil D, Sponer J, Cheatham TE, III., Laughton CA, Orozco M. Biophys. J. 2007;92:3817–3829. doi: 10.1529/biophysj.106.097782. [DOI] [PMC free article] [PubMed] [Google Scholar]
- 32.Banas P, Hollas D, Zgarbova M, Jurecka P, Orozco M, Cheatham TE, III., Sponer J, Otyepka M. J. Chem. Theory Comput. 2010;6:3836–3849. doi: 10.1021/ct100481h. [DOI] [PMC free article] [PubMed] [Google Scholar]
- 33.Lu X-J, Olson WK, Bussemaker H. J. Nucleic Acids Res. 2010;38:4868–4876. doi: 10.1093/nar/gkq155. [DOI] [PMC free article] [PubMed] [Google Scholar]
- 34.Wimberly BT, Guymon R, McCutcheon JP, White SW, Ramakrishnan V. Cell. 1999;97:491–502. doi: 10.1016/s0092-8674(00)80759-x. [DOI] [PubMed] [Google Scholar]
- 35.Correll CC, Beneken J, Plantinga MJ, Lubbers M, Chan YL. Nucleic Acids Res. 2003;31:6806–6818. doi: 10.1093/nar/gkg908. [DOI] [PMC free article] [PubMed] [Google Scholar]
- 36.Olieric V, Rieder U, Lang K, Serganov A, Schulze-Briese C, Micura R, Dumas P, Ennifar E. RNA. 2009;15:707–715. doi: 10.1261/rna.1499309. [DOI] [PMC free article] [PubMed] [Google Scholar]
- 37.Chi YI, Martick M, Lares M, Kim R, Scott WG, Kim SH. PLoS Biol. 2008;6:2060–2068. doi: 10.1371/journal.pbio.0060234. [DOI] [PMC free article] [PubMed] [Google Scholar]
- 38.Klein DJ, Schmeing TM, Moore PB, Steitz TA. EMBO J. 2001;20(15):4214–4221. doi: 10.1093/emboj/20.15.4214. [DOI] [PMC free article] [PubMed] [Google Scholar]
- 39.Cate JH, Gooding AR, Podell E, Zhou K, Golden BL, Szewczak AA, Kundrot CE, Cech TR, Doudna JA. Science. 1996;273:1678–1685. doi: 10.1126/science.273.5282.1678. [DOI] [PubMed] [Google Scholar]
- 40.Ke A, Zhou K, Ding F, Cate JH, Doudna JA. Nature. 2004;429:201–205. doi: 10.1038/nature02522. [DOI] [PubMed] [Google Scholar]
- 41.Hauenstein S, Zhang CM, Hou YM, Perona J. J. Nat. Struct. Mol. Biol. 2004;11:1134–1141. doi: 10.1038/nsmb849. [DOI] [PubMed] [Google Scholar]
- 42.Lu X-J, Olson WK. Nucleic Acids Res. 2003;31:5108–5121. doi: 10.1093/nar/gkg680. [DOI] [PMC free article] [PubMed] [Google Scholar]
- 43.Lu X-J, Olson WK. Nat. Protoc. 2008;3:1213–1227. doi: 10.1038/nprot.2008.104. [DOI] [PMC free article] [PubMed] [Google Scholar]
- 44.Richardson JS, Schneider B, Murray LW, Kapral GJ, Immormino RM, Headd JJ, Richardson DC, Ham D, Hershkovits E, Williams LD, Keating KS, Pyle AM, Micallef D, Westbrook J, Berman HM. RNA. 2008;14:465–481. doi: 10.1261/rna.657708. [DOI] [PMC free article] [PubMed] [Google Scholar]
- 45.Schneider B, Moravek Z, Berman HM. Nucleic Acids Res. 2004;32:1666–1677. doi: 10.1093/nar/gkh333. [DOI] [PMC free article] [PubMed] [Google Scholar]
- 46.Batey RT, Sagar MB, Doudna JA. J. Mol. Biol. 2001;307:229–246. doi: 10.1006/jmbi.2000.4454. [DOI] [PubMed] [Google Scholar]
- 47.Klein DJ, Moore PB, Steitz TA. J. Mol. Biol. 2004;340:141–177. doi: 10.1016/j.jmb.2004.03.076. [DOI] [PubMed] [Google Scholar]
- 48.Juneau K, Podell E, Harrington DJ, Cech TR. Structure. 2001;9:221–231. doi: 10.1016/s0969-2126(01)00579-2. [DOI] [PubMed] [Google Scholar]
- 49.Zhao Y, Truhlar DG. Theor. Chem. Acc. 2008;120:215–241. [Google Scholar]
- 50.Tao J, Perdew JP, Staroverov VN, Scuseria GE. Phys. Rev. Lett. 2003;91:146401–146405. doi: 10.1103/PhysRevLett.91.146401. [DOI] [PubMed] [Google Scholar]
- 51.Jurecka P, Cerny J, Hobza P, Salahub DR. J. Comput. Chem. 2007;28:555–569. doi: 10.1002/jcc.20570. [DOI] [PubMed] [Google Scholar]
- 52.Ahlrichs R, Bar M, Haser M, Horn H, Kolmel C. Chem. Phys. Lett. 1989;162:165–169. [Google Scholar]
- 53.Kendall RA, Fruchtl HA. Theor. Chim. Acta. 1997;97:158–163. [Google Scholar]
- 54.Feyereisen MW, Fitzgerald G, Komornicki A. Chem. Phys. Lett. 1993;208:359–363. [Google Scholar]
- 55.Vahtras O, Almlof J, Feyereisen MW. Chem. Phys. Lett. 1993;213:514–518. [Google Scholar]
- 56.Frisch MJ, Trucks GW, Schlegel HB, Scuseria GE, Robb MA, Cheeseman JR, Montgomery JA, Jr., Vreven T, Kudin KN, Burant JC, Millam JM, Iyengar SS, Tomasi J, Barone V, Mennucci B, Cossi M, Scalmani G, Rega N, Petersson GA, Nakatsuji H, Hada M, Ehara M, Toyota K, Fukuda R, Hasegawa J, Ishida M, Nakajima T, Honda Y, Kitao O, Nakai H, Klene M, Li X, Knox JE, Hratchian HP, Cross JB, Bakken V, Adamo C, Jaramillo J, Gomperts R, Stratmann RE, Yazyev O, Austin AJ, Cammi R, Pomelli C, Ochterski JW, Ayala PY, Morokuma K, Voth GA, Salvador P, Dannenberg JJ, Zakrzewski VG, Dapprich S, Daniels AD, Strain MC, Farkas O, Malick DK, Rabuck AD, Raghavachari K, Foresman JB, Ortiz JV, Cui Q, Baboul AG, Clifford S, Cioslowski J, Stefanov BB, Liu G, Liashenko A, Piskorz P, Komaromi I, Martin RL, Fox DJ, Keith T, Al-Laham MA, Peng CY, Nanayakkara A, Challacombe M, Gill PMW, Johnson B, Chen W, Wong MW, Gonzalez C, Pople JA. Gaussian 03. Revision E.01 Gaussian, Inc.; Wallingford, CT: 2004. [Google Scholar]
- 57.Dunning TH., Jr. J. Chem. Phys. 1989;90:1007–1023. [Google Scholar]
- 58.Dunning TH., Jr. J. Phys. Chem. A. 2000;104:9062–9080. [Google Scholar]
- 59.Halkier A, Helgaker T, Jorgensen P, Klopper W, Olsen J. Chem. Phys. Lett. 1999;302:437–446. [Google Scholar]
- 60.Helgaker T, Klopper W, Koch H, Noga J. J. Chem. Phys. 1997;106:9639–9646. [Google Scholar]
- 61.Werner HJ, Manby FR, Knowles PJ. J. Chem. Phys. 2003;118:8149–8160. [Google Scholar]
- 62.Sponer J, Leszczynski J, Hobza P. Biopolymers. 2001;61:3–31. doi: 10.1002/1097-0282(2001)61:1<3::AID-BIP10048>3.0.CO;2-4. [DOI] [PubMed] [Google Scholar]
- 63.Jurecka P, Nachtigall P, Hobza P. Phys. Chem. Chem. Phys. 2001;3:4578–4582. [Google Scholar]
- 64.Boys SF, Bernardi F. Mol. Phys. 1970;19:553–566. [Google Scholar]
- 65.MOLPRO. version 2006.1 Cardiff University; Cardiff, U.K.: 2006. [Google Scholar]
- 66.Bader RFW. Atoms in Molecules. A Quantum Theory. Oxford University Press; Oxford, U.K.: 1990. [Google Scholar]
- 67.Bader RFW. Chem. Rev. 1991;91:893–928. [Google Scholar]
- 68.Bader RFW. J. Phys. Chem. A. 1999;103:304–314. [Google Scholar]
- 69.Biegler-Konig F, Schonbohm J, Bayles D. J. Comput. Chem. 2001;22:545–559. [Google Scholar]
- 70.Biegler-Konig F, Schonbohm J. J. Comput. Chem. 2002;23:1489–1494. doi: 10.1002/jcc.10085. [DOI] [PubMed] [Google Scholar]
- 71.Hobza P, Sponer J, Cubero E, Orozco M, Luque JF. J. Phys. Chem. B. 2000;104:6286–6292. [Google Scholar]
- 72.Newton MD. J. Am. Chem. Soc. 1973;95:256–258. doi: 10.1021/ja00782a055. [DOI] [PubMed] [Google Scholar]
- 73.Govil G. Biopolymers. 1976;15:2303–2307. doi: 10.1002/bip.1976.360151119. [DOI] [PubMed] [Google Scholar]
- 74.Ditzler MA, Otyepka M, Sponer J, Walter NG. Acc. Chem. Res. 2010;43:40–47. doi: 10.1021/ar900093g. [DOI] [PMC free article] [PubMed] [Google Scholar]
- 75.Spackova N, Sponer J. Nucleic Acids Res. 2006;34:697–708. doi: 10.1093/nar/gkj470. [DOI] [PMC free article] [PubMed] [Google Scholar]
Associated Data
This section collects any data citations, data availability statements, or supplementary materials included in this article.