

Abstract
The vitally important AAA (ATPases associated with various cellular activities) protein p97 is involved in cellular functions ranging from replication to degradation of misfolded proteins and has recently been proposed as a novel chemotherapeutic target. p97 is a large molecular machine that has been shown to hexamerize in vitro, with each monomer consisting of an N domain responsible for binding to effector proteins and two AAA repeats (D1 and D2). However, structural studies are inconclusive or in disagreement with one another on several important features such as the locations of the N domains, the relative orientations of the D1 and D2 rings, and the dimensions of the central pore. Here, we present atomic-scale simulations of the p97 hexamer in the prehydrolysis, transition, and post-hydrolysis states. To improve the agreement between low- and high-resolution experimental studies, we first use a biased simulation technique, molecular dynamics flexible fitting (MDFF), to improve the correlation between the structures described in these experiments. We follow this with extended, classical molecular dynamics simulations, which not only show that structures generated in the MDFF phase are stable, but reveal insights into the dynamics important to each state. Simulation results suggest a hybrid model for hydrolysis, in which the N and D2 domains are dynamic while the D1 domains are relatively static, salt bridges stabilize the position of the N domains in the pre-hydrolysis state, and the rings formed by D1 and D2 rotate relative to one another.
Keywords: p97, molecular dynamics, molecular dynamics flexible fitting, small angle X-ray scattering
Introduction
The AAA family of proteins (ATPases associated with various cellular activities) compose an important group of enzymes found in all major kingdoms of life.1–4 Although functionally diverse, these enzymes contain a structurally conserved module of approximately 250 amino acids consisting of three conserved sequence motifs: the Walker A, Walker B, and hydrolysis subdomains, and they tend to oligomerize into five or six membered rings in vivo. Type I proteins contain a single AAA domain while type II contain two. Free energy gained through ATP binding and hydrolysis in these domains produce large scale conformational changes in other domains and adapter proteins that drive a wide range of cellular activities; however, the mechanism by which this occurs remains elusive.
One of the more widely studied members of this family is p97 (or valosin-containing protein), a highly abundant protein (comprising ∼1% of the cytosol) that has been strongly conserved throughout evolution.5, 6 p97 is involved in many cellular functions such as nuclear envelope assembly,7 endoplasmic reticulum associated-degradation (ERAD),8, 9 DNA replication,10 reformation of the Golgi following mitosis,11 and has been shown to have a function in neurodegenerative disorders such as Huntington's disease.12 Overexpression of p97 has also been shown to correlate with a poor prognosis of tumor recurrence in liver, prostate, and thyroid cancers.13–15 It is believed that an overabundance of p97 increases the degradation rate of Iκβα resulting in a rise of NFκβ, thereby reducing the rate of apoptosis in cancer cells (see Ref.16). Recently, the first reversible inhibitor that selectively inhibits p97 at low micromolar concentration was discovered, with in vivo results exhibiting antiproliferative activity against cancer cells.17
Structurally, a p97 monomer has three major domains: the N domain, and two AAA domains (D1 and D2, see Fig. 1 and Supporting Information Fig. S2).18 The N domain, which is subdivided into the Na (residues 1–110) and Nb (residues 111-187) subdomains, appears to be responsible for binding to effector proteins that dictate which pathway p97 is used in and is essential for in vivo function but not for hydrolysis. Each AAA domain is subdivided into an α/β (residues 209–370 and 481–645 in D1 and D2, respectively) and a largely helical α subdomain (residues 371–460 and 646–763 in D1 and D2, respectively). Although both domains are capable of hydrolysis, mutation and chromatography experiments have indicated that hydrolysis occurs almost exclusively in the D2 domain, with D1 only being catalytically active under heat-shock conditions or when D2 is cleaved.19, 20 The C-terminal ranges from residues 763–806, while flexible linkers exist between the N and D1 domains (residues 188–208) and D1 and D2 domains (residues 461–480).
Figure 1.

Hexameric p97 structures constructed from crystal structures28 and following MDFF calculations to improve the correlation with SAXS derived density maps.20 Before simulations, all three states exhibit similar overall structures. MDFF calculations significantly impact the prehydrolysis and posthydrolysis states, altering both interdomain and intradomain interactions.
Low resolution cryo-EM and Small-Angle X-Ray Scattering (SAXS) experiments have been performed in the presence of different nucleotide species and interpreted as representative conformations of distinct hydrolysis intermediates. These studies on Apo, ATP, ADP, and transition state structures describe hexameric structures in which the D1 and D2 domains form stacked rings that twist relative to one another about a common central pore as hydrolysis proceeds.21–25 The SAXS data was the only one to consistently show the location of the N-terminal domains, which undergo large motions as they shift between states above and below the D1 ring. Crystal structures, solved in the presence of different nucleotide analogues, provide further insight into the structure and mechanism of p97.18,26–28 Most notably, it was shown that there exist significant interprotomer interactions, such as the “arginine fingers” in which an arginine side chain from one monomer is inserted into the binding site of its neighbor. This is thought to stabilize the leaving phosphate during hydrolysis, which is likely essential for stabilization of the p97 complex and its function. In addition, ADP was consistently resolved in the noncatalytic D1 domain, consistent with previous studies.19, 20
There were, however, several discrepancies between the high and low resolution structures: interdomain conformational changes were drastically reduced (and in some cases in a different direction) compared to those observed in solution, the dimensions of the central pore underwent far less change, and largely differing radii of gyration were observed (for a complete review see Ref.26). These differences, which were largely attributed to experimental conditions and crystal packing effects (which were similar in all three hydrolysis states), have led to the proposal of several models for the mechanism of p97 that differ in both the magnitude and direction of the domain rearrangements in response to the D2 hydrolysis state. For example, in the “preactivated-active state” model, which was largely derived from crystal structures, the p97 hexamer has two macro-conformations: a “preactivated” state in which there is either no nucleotide or ATP present in the D2 domains, and the “activated” state corresponding to the transition and posthydrolysis states. In this model, the D1 α/β subdomain is relatively invariant throughout hydrolysis and acts as a “fulcrum for motion” about which other domains undergo rigid-body motions as the hexamer transitions between states, and the D1–D2 linker plays a key role in transmitting information about the hydrolysis state in D2 to the D1 and N domains.27 Additionally, the D2 α -helical subdomain undergoes a disordered to ordered transition as hydrolysis proceeds from the “preactivated” to the “activated” state. In an alternative model derived from reconstructions of SAXS data, each nucleotide state is unique and can be characterized by the position of the N domains, the rotation of the D2 ring, and the width of the central pore.20 In the SAXS model, the N domains transition from below the D1 ring to coplanar as the D2 domains transition from the prehydrolysis (ATP) to transition state, and the D2 ring twists 10° while the central pore widens in this region. Transition to the ADP state involves a twisting back of the D2 ring and a closing of the D2 pore, along with protrusions around the interface between the D1 and D2 rings (which were postulated to be due to the D2 α subdomains). The key hypothesis of this model is that hydrolysis in the D2 domains produces dramatic conformational changes in the N-terminals and central pore (much greater than those observed in crystal structures), which could transmit energy to effector proteins bound to the N domains. The changing pore shape also suggested the possibility of a “pore feeding” mechanism in ERAD,20 which would not be possible in the constricted pore dimensions observed in crystal structures.
In this article, we aim to address the discrepancies in these models through the use of all-atom molecular simulations. We begin with crystal structures solved in the prehydrolysis (ATP), transition, and posthydrolysis (ADP) states and use the newly developed molecular dynamics flexible fitting algorithm (MDFF) to bias these into density maps derived from SAXS studies.29, 30 To prevent the introduction of sudden, large forces on the protein complex we use a modified protocol in which the biasing forces are slowly increased, followed by a gradual reduction in secondary structure restraints. We then perform classical molecular dynamics simulations, which demonstrated the stability of the MDFF generated structures. Domain orientations, pore widths, atomic fluctuations, and specific residue–residue interactions are analyzed and suggest a hydrolysis mechanism that is not only a hybrid of the models resulting from the crystal structures and SAXS data, but also show agreement with lower-resolution Cryo-EM experiments.
Results
Structural rearrangements during MDFF simulations
The ATP crystal structures show numerous discrepancies with not only the SAXS derived density maps but also Cryo-EM data, including the location of the N domains, and the width of the central pore in the D1 and D2 domains. Over the course of the MDFF simulations the N domains moved from their initial positions at the top of the hexamer into a position between the D1 and D2 rings (Fig. 1). This displacement was accompanied by a drastic reduction in the average angle between residue 107 in the N domain and the nucleotides in D1 and D2 (the N–D1–D2 interdomain angle as previously defined28), while the D2 α/β subdomain experienced an ∼4° center of mass rotation relative to the Nb/D1 domains (Fig. 2, see Supporting Information for calculation details). Helices in the D1 α/β subdomain, along with the first β strand (residues 265–270), rearrange to form a fairly smooth “top” to the hexamer. The D2 α domain is compressed inwards, and residues 700–730 become positioned directly under the N domains, with some residues in the loop between residues 708 and 725 forming salt bridges to the N domains, as is further discussed below. The central pore widens in both the D1 and D2 rings from 2 Å in D1 and D2 to 3 and 5 Å, respectively (Fig. 3 and Supporting Information Fig. S6). These changes dramatically improve the correlation to the SAXS derived density map from an initial value of 0.72–0.95 [see Fig. 4(a)]. The heavy-atom root-mean square deviation (RMSD) of the heavy atoms is relatively large. The entire hexamer undergoes a change of 16.49 Å, with much of that coming from the D2 domains that have an average RMSD of 8.12 Å each (top row of Table I), corresponding to ρsc values of 0.40 and 0.36 respectively (Supporting Information Table S2). Note that in this section and the next we use the “Restrained ATP” simulations (as discussed below) as the simulations of interest.
Figure 2.

The average inter-domain angles (a: as defined by Davies et al.28) and the average angle of rotation of the D2 α/β subdomains relative to the Nb and D1 domains (b). The molecular conformations of the ATP and ADP states initially undergo large scale rearrangement in the MDFF phase, which are stable in the MD phase. The transition state maintains an interdomain angle similar to that of the crystal structure throughout simulations. [Color figure can be viewed in the online issue, which is available at wileyonlinelibrary.com.]
Figure 3.

Radius of the central pore at points measured along its axis from final structures in the MD simulations. The D2 pores are more open than their D1 counterparts, especially in the case of the transition state, and all three states have a maximum opening around the D1/D2 interface. For the individual states the MDFF calculations produce structures with larger pore openings than in the crystal structures; however, in the MD simulations he hexamers relax to structures with pores similar to those in the crystal structure (see Supporting Information Fig. S6). [Color figure can be viewed in the online issue, which is available at wileyonlinelibrary.com.]
Figure 4.

Correlation of p97 structures throughout MDFF and classical MD simulations to SAXS derived density maps. (a) The correlation of all three states significantly increases from their native values to values > 0.94 over the MDFF phase. All states relax to values of ∼0.86, a significant improvement for the prehydrolysis and posthydrolysis states. Note that, due to the good initial agreement between the transition state crystal structure and SAXS model, the MDFF phase was half the length of the other two states. (b) Three simulations of the pre-hydrolysis state. In the original simulation, a high-correlation was obtained in the MDFF phase; however, much of this improvement was lost over the classical MD phase. MDFF simulations which induced the formation of salt bridges between R709 and both E141 and D179 (“Restrained”) produced structures that exhibited higher correlation over the MD phase; however, a R709G mutation at the beginning of the MD phase resulted in a loss of this correlation. [Color figure can be viewed in the online issue, which is available at wileyonlinelibrary.com.]
Table I.
Heavy Atom RMSD Values
| ATP state | Transition state | ADP state | ||||||||||
|---|---|---|---|---|---|---|---|---|---|---|---|---|
| Hexamer | N | D1 | D2 | Hexamer | N | D1 | D2 | Hexamer | N | D1 | D2 | |
| Crystal relative to MDFF | 16.49 | 4.38 | 5.53 | 8.12 | 7.02 | 5.91 | 3.43 | 5.67 | 9.70 | 5.75 | 3.78 | 6.57 |
| Final relative to MDFF | 6.57 | 4.40 | 3.78 | 4.78 | 6.70 | 6.14 | 3.29 | 4.97 | 7.02 | 5.53 | 3.27 | 5.55 |
| Final relative to crystal | 14.61 | 4.50 | 4.41 | 6.94 | 6.28 | 6.53 | 2.45 | 4.65 | 7.84 | 5.16 | 3.30 | 4.89 |
For each hydrolysis state, the RMSD values for the entire hexamer, and the average for the N, D1, and D2 domains are presented for the final MD structure relative to the crystal and final MDFF structures, as well as the crystal structure relative to the MDFF structure. Time course plots are presented in Supporting Information Figs. S3–S5. All units are in Angstrom.
In contrast to the ATP state, the transition state crystal structure is in overall good agreement with the SAXS model (initial correlation of 0.85). The largest changes observed during MDFF are a compaction of the D2 domains near the base of the hexamer to fit into the density map and a significant widening of the D2 pore, which largely results from a pushing outwards of the loop of residues 587–598. The interdomain and D2 α/β rotation angles remained relatively constant and the overall RMSD was 7.02 Å.
The ADP state is between the ATP and transition states in terms of agreement between the crystal structure and SAXS model. The location of the N domains appears to be roughly similar in the two, and the central pore shares similar dimensions (although it is wider at the D1/D2 interface than in the SAXS model by 4 Å). One glaring difference between the two structures is the outer dimension of the D1/D2 interface: in the crystal structure there exists a clear delineation between the D1 and D2 rings at which the protein's diameter is at a minimum (as is observed in the transition state structures); however the SAXS model describes a more funnel-like structure with protrusions filling the gap (see Fig. 1). To accommodate this, the D2 α subdomain undergoes significant conformational change over the MDFF simulations, with numerous helices moving from the base of the structure outwards and pointing upwards. In addition there is a slight movement downwards of the N domains to a position between where the N domains lie in the ATP and transition states, which, when considered with the motions of the D2 domains, reduces the average inter-domain angle and increases the D2 α/β rotation angle. The overall hexamer RMSD is intermediate to that of the ATP and transition states at 9.70 Å (which corresponds to a ρsc of 0.20), with the D2 and N domains undergoing the largest conformational changes and the D1 domains remaining in relatively similar positions (Table I and Supporting Information Table S2). The correlation to SAXS model density maps improved from 0.82 to 0.94 [Fig. 4(a)].
Stability and fluctuations during classical MD simulations
Removal of the MDFF restraints resulted in relaxation of the hexamers. In all three states the correlation quickly dropped from their high values of ∼0.95 and leveled off at ∼0.86 after 25–30 ns of sampling [Fig. 4(a)]. The overall RMSD values follow a similar trend, with final hexamer RMSD values ranging from 6.14 to 7.02 Å with very low ρsc values of 0.13–0.15 (Table I and Supporting Informations). The D1 domains undergo the least change, with RMSD values ranging form 3.27–3.78 Å, while the N and the D2 domains, particularly the D2 α subdomain, undergo larger motions resulting in RMSDs ranging from 4.40 to 6.14 Å. The interdomain arrangement remains close to that of the MDFF structures as the inter-domain and D2 α/β rotation angles show little variations over the MD (Fig. 2). In contrast, the dimensions of the central pore returned to dimensions closer to the crystal structure (Fig. 3). Throughout the hydrolysis cycle the pore is mostly closed in the D1 ring and widens at the D1/D2 interface. In the prehydrolysis and posthydrolysis states, the pore then closes somewhat in the D2 ring; however, it appears open during the transition state.
Based on the RMSD and SAXS model correlation timecourses, we partitioned the classical MD trajectories into a 30-ns equilibration and a 20-ns production run over which we performed analysis. The average root-mean square fluctuation (RMSF) values for the Cα atoms is remarkably similar throughout the hydrolysis cycle (Fig. 5). In general, the N domains, and most notably the Nb subdomains, are highly flexible. The entire D1 domain exhibits low RMSF values, with peaks generally corresponding to residues lining the central pore or on the protein periphery. The D2 α/β subdomains show similar fluctuations to their D1 counterparts, with the exception of increased fluctuations in the transition state for residues 494–508 and 586–593. The D2 α domain has the highest overall fluctuations, with one peak containing residues 664–672 and the other residues 708–725, both of which form loops on the lower base of the hexamer. Inter-protomer contacts between R635 and the nucleotide present in the neighboring D2 active site were strongest in the transition state structures (with an occupancy of 84%) and lower in the prehydrolysis and posthydrolysis states (48% and 30%, respectively, see Supporting Information Table S3). In addition, R638 showed some capability for making interprotomer hydrogen bond contacts, with occupancies ranging from 12% to 25%. Taken together, this data further suggests that R635 functions as the “arginine finger”; however, R638 may also play a role in the hydrolysis process.
Figure 5.
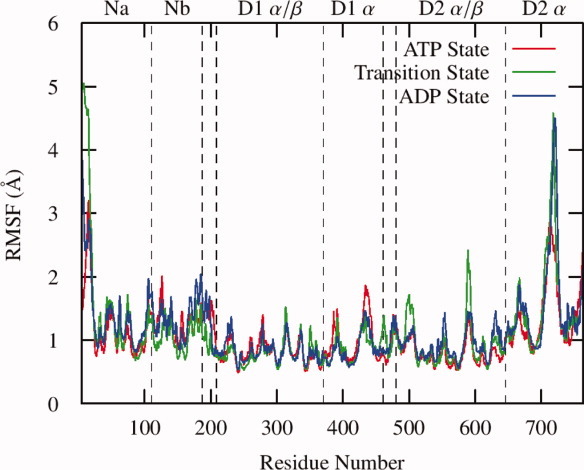
The average root mean square fluctuations of the Cα atoms over the final 20 ns of the MD simulations. In general, all three states show similar patterns, with greater fluctuations in the N domains relative to the D1 and D2 domains. Both the D1 and D2 α subdomains are more dynamic than their corresponding α β subdomains. The transition state shows increased flexibility in the 500 and 590 loops, both of which have previously been suggested to participate in nucleotide dependent global conformational changes. [Color figure can be viewed in the online issue, which is available at wileyonlinelibrary.com.]
The conformational changes observed in MDFF and MD simulations increased the radii of gyration (Rg) to values which agree more closely with the SAXS experiments (see Table II). In both the prehydrolysis and posthydrolysis states, Rg increased to values ∼2 Å below the experiments, whereas in the transition state the values are nearly identical (within error). Given the structures of the D2 α subdomains, the discrepancies are likely due to the missing C domains (that account for nearly 5% of the protein), which would likely increase the Rg in the prehydrolysis and posthydrolysis states. The maximum interatomic distance (Dmax) increases to values larger then those derived from SAXS data; however, the trend of nearly identical values in the prehydrolysis and posthydrolysis states, along with a lower value in the transition state, is recovered.
Table II.
The Radius of Gyration, Rg, and Maximum Interatomic Distance, Dmax, in Each State From Experiments,20 Initial Structures as Derived From the Crystal Structures,28 and Averaged over the Final 20 ns of MD Simulation
| Experiment | Crystal structures | MD structures | ||||
|---|---|---|---|---|---|---|
| Rg | Dmax | Rg | Dmax | Rg | Dmax | |
| ATP state | 56.5 ± 0.2 | 175 ± 5 | 53.9 | 174.9 | 54.6 | 186.0 |
| Transition state | 55.4 ± 0.4 | 165 ± 5 | 54.4 | 178 | 55.9 | 180.5 |
| ADP state | 57.7 ± 0.2 | 176 ± 5 | 54.6 | 174.6 | 55.9 | 184.0 |
Atomic correlations during classical MD simulations
Cross-correlation plots show a strong dependence on the nucleotide state (Fig. 6). In the prehydrolysis state, intermonomer motions in all of the N domains are strongly correlated to one another, and are largely anticorrelated to the remainder of the residues in its monomer with the exceptions of residues 560–570 (which line the inner pore at the D1/D2 interface) and the previously mentioned 708–725 loop. The entire D1 domain moves not only in concert with itself but also the D2 α/β subdomain and opposite of the N domain, while the D2 α subdomain moves relatively independent of the remainder of the protein. In the transition and posthydrolysis states each subdomain moves relatively independent of the other subdomains, with notable exceptions being the anticorrelation of the D1 α/β and the D2 α subdomains in the transition state and the anticorrelation of the D1 α/β and the Nb subdomains in the posthydrolysis state. As hydrolysis proceeds, residues in the D1–D2 linker begin by having their motions strongly correlated with both the D1 α and D2 α/β subdomains. Then, as the complex enters the transition state, it remains correlated with the D2 α/β subdomain but becomes anticorrelated with the D1 α subdomain, before losing most of its correlations with the rest of the monomer in the posthydrolysis state (for a zoomed in view see Supporting Information Fig. S7). The correlations between neighboring monomers (top half of plots in Fig. 6) show intermonomer correlations are highest in the prehydrolysis state. Particularly interesting are anticorrelated motions of the N domains with the subdomains in the neighboring monomer that are strong in the prehydrolysis case, reduced in the transition state, and nearly eliminated in the post-hydrolysis simulations. D1 domains tend to show some correlation with their neighboring D1 domains, while the D2 domains move nearly independent of the D2 domains throughout the hydrolysis cycle.
Figure 6.

Cross correlation plots along the hydrolysis cycle for intramonomer (lower half) and intermonomer (upper half) fluctuations of Cα atoms. Intramonomer interactions are highly correlated in the ATP state, and are reduced in the transition and posthydrolysis state. [Color figure can be viewed in the online issue, which is available at wileyonlinelibrary.com.]
In addition, correlations throughout the entire hexamer show cross-hexamer correlations are increased in the prehydrolysis state relative to the transition and posthydrolysis states (Supporting Information Fig. S8). Specifically, in the prehydrolysis state, motions in the N and D2 domains tend to exhibit the highest magnitude correlations throughout the hexamer. In the transition state many of these correlations are lost, whereas D2 correlations are somewhat recovered throughout the hexamer in the posthydrolysis state. Correlations between neighboring monomers tend to be the strongest, while nonadjacent monomers tend to exhibit lower correlation with one another. It should be noted that these results should be interpreted cautiously, convergence of such large scale motions will likely require at least one to two orders of magnitude more sampling then is presented here.
Salt bridges in ATP state
Our initial simulation of the prehydrolysis state produced structures with high correlation to the SAXS model density map; however, over the 50 ns of MD simulation the correlation continued to drop and had a final value of 0.82 [“Original ATP” in Fig. 4(b)]. Inspection of the trajectories showed that this was largely due to a separation of the N and D2 domains from each other in numerous monomers. The exception to this was a single monomer in which R709 had formed a pair of salt bridges with E141 and D179, suggesting that these interactions could stabilize the more compact form in the SAXS model. To test this, we performed another set of MDFF simulations in which a bias was introduced to encourage the formation of these salt bridges (as discussed in Methods Section). During MDFF calculations, the improvement in correlation of this hexamer was similar to that of the original simulations; however during the MD phase the drop in correlation leveled off at 0.86 [“Restrained ATP” in Fig. 4(b)], similar to the transition state and ADP hexamers. To further test the importance of this residue, the final structure generated from the biased MDFF simulation was modified such that each R709 residue was replaced with a glycine. This modification resulted in dramatic difference in the MD trajectories. Although starting from the same configuration, the timecourse of the correlation to SAXS model dropped back to what was observed in the original ATP simulations [“Mutated ATP” in Fig. 4(b)]. Figure 7 compares the center of mass distances between the Nb subdomain and residues 704–732 (in the D2 α subdomain), along with the RMSD values, for each monomer in these two simulations. In the two simulations, we observe that all of the monomers in the native protein have similar distance and RMSD traces, and that these are similar to three monomers in the R709G mutant; however, in the other three R709G monomers the distances between the Nb and D2 α subdomains increase, commensurate with an increase in RMSD value. This further implies that these salt bridges may be stabilizing the structures in the SAXS model.
Figure 7.

Comparison of structural properties of p97 monomers in the ATP state over MD simulations initiated from identical structures following the “restrained” MDFF calculations [see Fig. 4(b)] that differ by a R709G mutation. The interdomain distances between the Nb subdomain and residues 704 to 732 in the D2 α domain and the monomer RMSD values show that while three monomers have similar stabilities in the wild type and mutant structures, three of them (colored red, dark blue, and light blue) have increased separation distances and RMSD values. The results suggest that salt bridges between distant residues in the primary sequence may help stabilize the structure suggested by SAXS experiments. [Color figure can be viewed in the online issue, which is available at wileyonlinelibrary.com.]
Salt bridges formed in the MDFF phase of the “Restrained ATP” MDFF simulation appear stable during MD simulations. In Table III, the occupancy of three pairs of salt bridges between the N and D2 domain are reported for each of the six monomers over the final 20 ns of MD simulation. In general, R709 interacts with either E141 or D179 (shown in Supporting Information Fig. S9), with the exception being monomer 4 in which another salt bridge, E132–R713, has formed, (which is also present in monomers 1 and transiently in monomer 6) which may be responsible for maintaining the close contact between the N and D2 domains observed in Figure 7. Because of the length of the MD trajectories it is expected that we observe only a small subset of protein conformations pertinent to in vitro experiments, but given that residues 708–713 are composed of four arginine and two glutamic acid residues, and that this loop is unresolved in each of the p97 crystal structures, it is interesting to speculate that numerous combinations of salt bridges may exist between these residues and residues in the N domains.
Table III.
The Occupancies of Three Salt Bridges Between Residues in the N and D2 Domains for Each of the Six Monomers in the ATP State
| Monomer | E141–R709 | D179–R709 | E132–R713 |
|---|---|---|---|
| 1 | 0.17 | 0.94 | 1.00 |
| 2 | 1.00 | 0.00 | 0.00 |
| 3 | 0.99 | 0.00 | 0.00 |
| 4 | 0.25 | 0.00 | 0.65 |
| 5 | 0.00 | 0.90 | 0.00 |
| 6 | 0.94 | 0.00 | 0.12 |
Results suggest that at least one of these salt bridges is present in each monomer and may assist in stabilizing the prehydrolysis state. The dominant salt bridge formed in each monomer is underlined.
Discussion
The results presented here share several features with both the “preactivated-activated” and “SAXS derived” models. RMSF values show that the D1 α/β subdomains are the most rigid in each of the hydrolysis-states (Fig. 5), whereas a comparison of RMSF values between states and the RMSD values between final structures from the MD simulations show that this subdomain is the most invariant throughout the hydrolysis cycle (Supporting Information Table S1). This indicates that the D1 α/β subdomains should be considered a stable core of the hexamer about which hydrolysis proceeds, a key feature in the “preactivated-activated” model. In addition, the changing correlation between motions in the D1–D2 linker with the D1 α and D2 α/β subdomains also points toward it playing a key role in transmitting information about the hydrolysis state in D2–D1 and N. In accordance with the SAXS reconstructions, we observe that positions of the N domains (below the D1 ring in the ATP state and level with it in the transition and ADP states) and the positions of the D2 ring are stable in each of their hydrolysis states, and that rearrangement of the D2 α subdomain is responsible for salt bridges which stabilize the lower N domain positions in the ATP state and observed side protrusions in the ADP state. The width of the central pores are in closer agreement with the crystal structure than the SAXS model (Supporting Information Fig. S6) and the difference between the two pore widths is largely determined by motions of loops lining it (such as the one from residue 587–598 which has been shown to contains residues essential to ERAD activity31).
These results therefore suggest a mechanism that is a hybrid of the crystal structure and SAXS model. In the prehydrolysis state, the D2 ring is twisted relative to the D1 ring, the N terminals are locked into place below the D1 ring by salt bridges formed with residues in the D2 α subdomain, and the D2 pore has an opening three times that of the D1 pore. Progression to the transition state involves a separation of the N/D2 salt bridges, allowing for an upwards movement of the N domains. In addition, there is an ∼8° twisting of the D2 ring, a dramatic increase in the N/D1/D2 interdomain angle, and a nearly doubling of the width of the D2 pore. Upon release of inorganic phosphate, the rings twist back ∼7°, the N terminals drop lower on the D1 ring, the D2 pore narrows to a conformation almost identical to that of the prehydrolysis state, and the D2 α subdomains rearrange such that helices point outwards and up. Throughout the hydrolysis cycle the D1 α/β subdomains appear relatively invariant, with little change to their internal structure or the pore width, in agreement with the idea that they serve as a “fulcrum of motion”.18
The model described here also shares several characteristics in with Cryo-EM experiments. Rouiller et al.22 computed 3D maps of not only the wild type p97 hexamer, but also for a mutated p97 hexamer in which the monomers lacked their N domains (Δ N–p97). Remarkably, they observed that deletion of the N domains abolished the nucleotide-dependent D2 ring rotation. Here, we observe interactions between the N and D2 domains which suggest that the N domains may actively contribute to stabilization of the relative D1/D2 conformations, in agreement with this peculiar result. The observed ring rotations of 8° between the ATP and transition state and 10° between the transition and ADP states, along with the observance of N-domains that are coplanar to the D1 ring in the transition state, are also in very good agreement with our results.
Characterization of an isolated hexamer in which each monomer is in the same hydrolysis state precludes the study of two potentially important effects on p97 function in vivo: the interactions with effector proteins and the possibility for progressive hydrolysis in each monomer (as opposed to the concerted ones that were imposed upon these structures). One could speculate that binding of an effector protein to the N domain in the prehydrolysis state could result in conformational changes which would lift the N domains above the D1 ring (as is observed in the transition state), resulting in the breaking of Nb/D2 α salt-bridges that could then induce hydrolysis in the D2 domain. Additionally, results presented here indicate that the stable conformation of the D1 pore is a relatively closed conformation throughout hydrolysis; however, the differences between “open” and “closed” pore widths appear dominated by the positions of several loops and not large structural elements, thus, interaction with effector proteins could result in induced fit effects, allowing for a “pore feeding” mechanism (as has been suggested in ERAD activity20). Additionally, hydrolysis in one monomer could potentially rearrange interprotomer contacts such that its neighbor is then more likely to undergo hydrolysis, creating an asymmetric hydrolysis cycle in which ATP is sequentially hydrolyzed around the D2 ring.32, 33 Nevertheless, structures described here present likely conformations for individual p97 monomers, which are useful for not only understanding the range of motions available to the p97 complex but also for the design and interpretation of future simulations and experiments.
Methods
Initial coordinates for p97 were generated from crystal structures 3CF1 (transition state), 3CF2 (ATP state), and 3CF3 (ADP state).28 Unresolved portions of the 3CF2 structure that were resolved in 3CF1 were modeled based on these coordinates, and then coordinates of residues 1–20 and 708–727 were modeled with the MODLOOP webserver.34, 35 Crystal structures did not contain the C-terminal domain, thus monomers were truncated at residues 763. Hexameric structures were constructed from the biological unit fields in the PDBs using VMD36 and were then rigidly docked into the density maps derived from SAXS experiments (from Ref.20) using the SITUS package.37 Structures were then solvated in an orthorhombic box with a minimum 12 Å water buffer and 150 mM NaCl ionic environment. Following 5000 steps of minimization, restraints on protein heavy atoms were reduced from 10 to .01 (kcal/mol) Å2 over 350 ps of simulation.
MDFF simulations are similar to classical MD simulations with the addition of two energy terms, one to bias the simulation into a user-defined density map and one to restrain the secondary structure (for a complete review, see Refs.29,30,38). Briefly, we used density maps generated from SAXS experiments in Ref.20 (with contributions from solvent removed), and used a four-phase MDFF protocol in which forces were slowly introduced to the system to minimize the effects of sudden, large forces on the complex. The transition state required 10 ns of MDFF simulations, whereas the prehydrolysis and posthydrolysis states required 20 ns. MDFF simulations were followed by classical simulations in the NPT ensemble.39, 40 For the “Restrained ATP” simulations, two additional restraints per monomer were introduced to the MDFF phase of the calculations, one between the CD atom of E141 and the CZ atom of R709 with a minimum at 3.8 Å, and the second between the CG of D179 and NE of R709 with a minimum of 3.1 Å (to mimic salt bridges observed in one monomer of an initial unrestrained MDFF simulations). Simulations were performed with NAMD,41 using particle-mesh Ewald for long range electrostatics and SHAKE for constraining hydrogen containing bonds.42, 43 Analysis of results used VMD.36 SITUS,37 Gromacs,44–46 and HOLE (for pore width calculations).47 All simulations were performed with the CHARMM27 force field which utilizes the CMAP correction, along with the appropriate ATP and ADP parameters.48–50 Systems ranged in size from 340 to 360 k atoms. Complete details are presented in Supporting Information.
RMSD measurements are ubiquitous throughout the field for measuring structural differences between protein conformations, thus, we have used them throughout this manuscript. Despite their widespread use, RMSD values may be misleading as they scale with the size of the protein under consideration.51 Given that we present RMSD values for protein components ranging from subdomains of 76 residues in size to the entire p97 hexamer consisting of 4578 residues, this problem is accentuated here. Therefore, we have also computed the size-independent ρsc, which is bounded by 0 (exact structural comparisons) to 2 (maximally dissimilar), and have presented them in Table S2 for comparison to the RMSD values in Table I.52
Acknowledgments
The authors our thanks to B. Grant, M. Fajer, P. Gasper, and Y. Wang for valuable discussion concerning the work presented here. The content is solely the responsibility of the authors and does not necessarily represent the official views of the National Institute of General Medical Sciences or the National Institutes of Health. This research used resources of the National Energy Research Scientific Computing Center, along with TeraGrid Supercomputer resources provided by a directors discretionary. National Institute for Computational Science (TG-CHE100128) and the San Diego Supercomputer Center (TG-MCB090110) to Ross Walker. Additional support has been provided by the NSF, NIH, HHMI, CTBP, NBCR, and the NSF Supercomputer Centers.
Glossary
Abbreviations
- MD
molecular dynamics
- SAXS
small-angle X-ray scattering.
Supplementary material
Additional Supporting Information may be found in the Online version of this article.
References
- 1.Patel S, Latterich M. The AAA team: related ATPases with diverse functions. Trends Cell Biol. 1998;8:65–71. [PubMed] [Google Scholar]
- 2.Ogura T, Wilkinson AJ. AAA(+) superfamily ATPases: common structure-diverse function. Genes Cells. 2001;6:575–597. doi: 10.1046/j.1365-2443.2001.00447.x. [DOI] [PubMed] [Google Scholar]
- 3.Hanson PI, Whiteheart SW. AAA+ proteins: have engine, will work. Nat Rev Mol Cell Biol. 2005;6:519–529. doi: 10.1038/nrm1684. [DOI] [PubMed] [Google Scholar]
- 4.Tucker PA, Sallai L. The AAA+ superfamilly-a myriad of motions. Curr Opin Struct Biol. 2007;7:641–652. doi: 10.1016/j.sbi.2007.09.012. [DOI] [PubMed] [Google Scholar]
- 5.Peters JM, Walsh MJ, Franke WW. An abundant and ubiquitous homo-oligomeric ring-shaped ATPase particle related to the putative vesicle fusion protein Sec18p and NSF. J Cell Biol. 1990;111:206A. doi: 10.1002/j.1460-2075.1990.tb08300.x. [DOI] [PMC free article] [PubMed] [Google Scholar]
- 6.Chapman E, Fry AN, Kang M. The complexities of p97 function in health and disease. Mol Biosyst. 2011;7:700–710. doi: 10.1039/c0mb00176g. [DOI] [PMC free article] [PubMed] [Google Scholar]
- 7.Hetzer M, Meyer HH, Walther TC, Bilbao-Cortes D, Warren G, Mattaj IW. Distinct AAA-ATPase p97 complexes function in discrete steps of nuclear assembly. Nat Cell Biol. 2001;3:1086–1091. doi: 10.1038/ncb1201-1086. [DOI] [PubMed] [Google Scholar]
- 8.Ye YH, Meyer HH, Rapoport TA. The AAA ATPase Cdc48/p97 and its partners transport proteins from the ER into the cytosol. Nature. 2001;414:652–656. doi: 10.1038/414652a. [DOI] [PubMed] [Google Scholar]
- 9.Jarosch E, Taxis C, Volkwein C, Bordallo J, Finley D, Wolf DH, Sommer T. Protein dislocation from the ER requires polyubiquitination and the AAA-ATPase Cdc48. Nat Cell Biol. 2002;4:134–139. doi: 10.1038/ncb746. [DOI] [PubMed] [Google Scholar]
- 10.Yamada T, Okuhara K, Iwamatsu A, Seo H, Ohta K, Shibata T, Murofushi H. p97 ATPase, an ATPase involved in membrane fusion, interacts with DNA unwinding factor (DUF) that functions in DNA replication. FEBS Lett. 2000;466:287–291. doi: 10.1016/s0014-5793(99)01673-7. [DOI] [PubMed] [Google Scholar]
- 11.Rabouille C, Levine TP, Peters JM, Warren G. An NSF-like ATPase, p97, and NSF mediate cisternal regrowth from mitotic golgi fragments. Cell. 1995;82:905–914. doi: 10.1016/0092-8674(95)90270-8. [DOI] [PubMed] [Google Scholar]
- 12.Kakizuka A. Roles of VCP in human neurodegenerative disorders. Biochem Soc Trans. 2008;36:105–108. doi: 10.1042/BST0360105. [DOI] [PubMed] [Google Scholar]
- 13.Tsujimoto Y, Tomita Y, Hoshida Y, Kono T, Oka T, Yamamoto S, Nonomura N, Okuyama A, Aozasa K. Elevated expression of valosin-containing protein (p97) is associated with poor prognosis of prostate cancer. Clin Cancer Res. 2004;10:3007–3012. doi: 10.1158/1078-0432.ccr-03-0191. [DOI] [PubMed] [Google Scholar]
- 14.Yamamoto S, Tomita Y, Hoshida Y, Sakon M, Kameyama M, Imaoka S, Sekimoto M, Nakamori S, Monden M, Aozasa K. Expression of valosin-containing protein in colorectal carcinomas as a predictor for disease recurrence and prognosis. Clin Cancer Res. 2004;10:651–657. doi: 10.1158/1078-0432.ccr-1576-03. [DOI] [PubMed] [Google Scholar]
- 15.Yamamoto S, Tomita Y, Nakamori S, Hoshida Y, Nagano H, Dono K, Umeshita K, Sakon M, Monden M, Aozasa K. Elevated expression of valosin-containing protein (p97) in hepatocellular carcinoma is correlated with increased incidence of tumor recurrence. J Clin Oncol. 2003;21:447–452. doi: 10.1200/JCO.2003.06.068. [DOI] [PubMed] [Google Scholar]
- 16.Asai T, Tomita Y, Nakatsuka S, Hoshida Y, Myoui A, Yoshikawa H, Aozasa K. VCP (p97) regulates NFκβ signaling pathway, which is important for metastasis of osteosarcoma cell line. Jpn J Cancer Res. 2002;93:296–304. doi: 10.1111/j.1349-7006.2002.tb02172.x. [DOI] [PMC free article] [PubMed] [Google Scholar]
- 17.Chou TF, Brown SJ, Minond D, Nordin BE, Li K, Jones AC, Chase P, Porubsky PR, Stoltz BM, Schoenen FJ, Patricelli MP, Hodder P, Rosen H, Deshaies RJ. Reversible inhibitor of p97, DBeQ, impairs both ubiquitin-dependent and autophagic protein clearance pathways. Proc Natl Acad Sci USA. 2011;108:4834–4839. doi: 10.1073/pnas.1015312108. [DOI] [PMC free article] [PubMed] [Google Scholar]
- 18.DeLaBarre B, Brunger AT. Complete structure of p97/valosin-containing protein reveals communication between nucleotide domains. Nat Struct Biol. 2003;10:856–863. doi: 10.1038/nsb972. [DOI] [PubMed] [Google Scholar]
- 19.Song CC, Wang Q, Li CCH. ATPase activity of p97-valosin-containing protein (VCP) - D2 mediates the major enzyme activity, and D1 contributes to the heat-induced activity. J Biol Chem. 2003;278:3648–3655. doi: 10.1074/jbc.M208422200. [DOI] [PubMed] [Google Scholar]
- 20.Davies JM, Tsuruta H, May AP, Weis WI. Conformational changes of p97 during nucleotide hydrolysis determined by small-angle X-ray scattering. Structure. 2005;13:183–195. doi: 10.1016/j.str.2004.11.014. [DOI] [PubMed] [Google Scholar]
- 21.Peters JM, Harris JR, Lustig A, Muller S, Engel A, Volker S, Franke WW. Ubiquitous soluble Mg2+-ATPase complex. A structural study. J Mol Biol. 1992;223:557–571. doi: 10.1016/0022-2836(92)90670-f. [DOI] [PubMed] [Google Scholar]
- 22.Rouiller I, Butel VM, Latterich M, Milligan RA, Wilson-Kubalek EM. A major conformational change in p97 AAA ATPase upon ATP binding. Mol Cell. 2000;6:1485–1490. doi: 10.1016/s1097-2765(00)00144-1. [DOI] [PubMed] [Google Scholar]
- 23.Rouiller I, DeLaBarre B, May AP, Weis WI, Brunger AT, Milligan RA, Wilson-Kubalek EM. Conformational changes of the multifunction p97 AAA ATPase during its ATPase cycle. Nat Struct Biol. 2002;9:950–957. doi: 10.1038/nsb872. [DOI] [PubMed] [Google Scholar]
- 24.Beuron F, Flynn TC, Ma JP, Kondo H, Zhang XD, Freemont PS. Motions and negative cooperativity between p97 domains revealed by cryo-electron microscopy and quantised elastic deformational model. J Mol Biol. 2003;327:619–629. doi: 10.1016/s0022-2836(03)00178-5. [DOI] [PubMed] [Google Scholar]
- 25.Pye VE, Dreveny I, Briggs LC, Sands C, Beuron F, Zhang XD, Freemont PS. Going through the motions: the ATPase cycle of p97. J Struct Biol. 2006;156:12–28. doi: 10.1016/j.jsb.2006.03.003. [DOI] [PubMed] [Google Scholar]
- 26.Huyton T, Pye VE, Briggs LC, Flynn TC, Beuron F, Kondo H, Ma JP, Zhang XD, Freemont PS. The crystal structure of murine p97/VCP at 3.6 Å. J Struct Biol. 2003;144:337–348. doi: 10.1016/j.jsb.2003.10.007. [DOI] [PubMed] [Google Scholar]
- 27.DeLaBarre B, Brunger AT. Nucleotide dependent motion and mechanism of action of p97/VCP. J Mol Biol. 2005;347:437–452. doi: 10.1016/j.jmb.2005.01.060. [DOI] [PubMed] [Google Scholar]
- 28.Davies JM, Brunger AT, Weis WI. Improved structures of full-length p97, an AAA ATPase: implications for mechanisms of nucleotide-dependent conformational change. Structure. 2008;16:715–726. doi: 10.1016/j.str.2008.02.010. [DOI] [PubMed] [Google Scholar]
- 29.Trabuco LG, Villa E, Mitra K, Frank J, Schulten K. Flexible fitting of atomic structures into electron microscopy maps using molecular dynamics. Structure. 2008;16:673–683. doi: 10.1016/j.str.2008.03.005. [DOI] [PMC free article] [PubMed] [Google Scholar]
- 30.Trabuco LG, Villa E, Schreiner E, Harrison CB, Schulten K. Molecular dynamics flexible fitting: a practical guide to combine cryo-electron microscopy and X-ray crystallography. Methods. 2009;49:174–180. doi: 10.1016/j.ymeth.2009.04.005. [DOI] [PMC free article] [PubMed] [Google Scholar]
- 31.DeLaBarre B, Christianson JC, Kopito RR, Brunger AT. Central pore residues mediate the p97/VCP activity required for ERAD. Mol Cell. 2006;22:451–462. doi: 10.1016/j.molcel.2006.03.036. [DOI] [PubMed] [Google Scholar]
- 32.Briggs LC, Baldwin GS, Miyata N, Kondo H, Zhang X, Freemont PS. Analysis of nucleotide binding to p97 reveals the properties of a tandem AAA hexameric ATPase. J Biol Chem. 2008;283:13745–13752. doi: 10.1074/jbc.M709632200. [DOI] [PMC free article] [PubMed] [Google Scholar]
- 33.Tang WK, Li D, Li CC, Esser L, Dai R, Guo L, Xia D. A novel ATP-dependent conformation in p97 N-D1 fragment revealed by crystal structures of disease-related mutants. EMBO J. 2010;29:2217–2229. doi: 10.1038/emboj.2010.104. [DOI] [PMC free article] [PubMed] [Google Scholar]
- 34.Fiser A, Do RK, Sali A. Modeling of loops in protein structures. Prot Sci. 2000;9:1753–1773. doi: 10.1110/ps.9.9.1753. [DOI] [PMC free article] [PubMed] [Google Scholar]
- 35.Fiser A, Sali A. ModLoop: automated modeling of loops in protein structures. Bioinformatics. 2003;19:2500–2501. doi: 10.1093/bioinformatics/btg362. [DOI] [PubMed] [Google Scholar]
- 36.Humphrey W, Dalke A, Schulten K. VMD: visual molecular dynamics. J Mol Graphics. 1996;14:33–38. doi: 10.1016/0263-7855(96)00018-5. [DOI] [PubMed] [Google Scholar]
- 37.Wriggers W. Using Situs for the integration of multi-resolution structures. Biophys Rev. 2010;2:21–27. doi: 10.1007/s12551-009-0026-3. [DOI] [PMC free article] [PubMed] [Google Scholar]
- 38.Trabuco LG, Schreiner E, Gumbart J, Hsin J, Villa E, Schulten K. Applications of the molecular dynamics flexible fitting method. J Struct Biol. 2011;173:420–427. doi: 10.1016/j.jsb.2010.09.024. [DOI] [PMC free article] [PubMed] [Google Scholar]
- 39.Martyna GJ, Tobias DJ, Klein ML. Constant-pressure molecular-dynamics algorithms. J Chem Phys. 1994;101:4177–4189. [Google Scholar]
- 40.Feller SE, Zhang YH, Pastor RW, Brooks BR. Constant-pressure molecular-dynamics simulation-the langevin piston method. J Chem Phys. 1995;103:4613–4621. [Google Scholar]
- 41.Phillips JC, Braun R, Wang W, Gumbart J, Tajkhorshid E, Villa E, Chipot C, Skeel RD, Kale L, Schulten K. Scalable molecular dynamics with NAMD. J Comput Chem. 2005;26:1781–1802. doi: 10.1002/jcc.20289. [DOI] [PMC free article] [PubMed] [Google Scholar]
- 42.Darden T, York D, Pedersen L. Particle mesh Ewald - an N · log(N) method for Ewald sums in large systems. J Chem Phys. 1993;98:10089–10092. [Google Scholar]
- 43.Krautler V, Van Gunsteren WF, Hunenberger PH. A fast SHAKE: Algorithm to solve distance constraint equations for small molecules in molecular dynamics simulations. J Comput Chem. 2001;22:501–508. [Google Scholar]
- 44.Ichiye T, Karplus M. Collective motions in proteins: a covariance analysis of atomic fluctuations in molecular dynamics and normal mode simulations. Proteins. 1991;11:205–217. doi: 10.1002/prot.340110305. [DOI] [PubMed] [Google Scholar]
- 45.Hünenberger PH, Mark AE, van Gunsteren WF. Fluctuation and cross-correlation analysis of protein motions observed in nanosecond molecular dynamics simulations. J Mol Biol. 1995;252:492–503. doi: 10.1006/jmbi.1995.0514. [DOI] [PubMed] [Google Scholar]
- 46.Lindahl E, Hess B, van der Spoel D. GROMACS 3.0: a package for molecular simulation and trajectory analysis. J Mol Mod. 2001;7:306–317. [Google Scholar]
- 47.Smart OS, Goodfellow JM, Wallace BA. The pore dimensions of gramicidin A. Biophys J. 1993;65:2455–2460. doi: 10.1016/S0006-3495(93)81293-1. [DOI] [PMC free article] [PubMed] [Google Scholar]
- 48.Pavelites JJ, Gao JL, Bash PA, Mackerell AD. A molecular mechanics force field for NAD+, NADH, and the pyrophosphate groups of nucleotides. J Comput Chem. 1997;18:221–239. [Google Scholar]
- 49.Foloppe N, MacKerell AD. All-atom empirical force field for nucleic acids. I. Parameter optimization based on small molecule and condensed phase macromolecular target data. J Comput Chem. 2000;21:86–104. [Google Scholar]
- 50.Mackerell AD, Feig M, Brooks CL. Extending the treatment of backbone energetics in protein force fields: limitations of gas-phase quantum mechanics in reproducing protein conformational distributions in molecular dynamics simulations. J Comput Chem. 2004;25:1400–1415. doi: 10.1002/jcc.20065. [DOI] [PubMed] [Google Scholar]
- 51.Maiorov VN, Crippen GM. Significance of root-mean-square deviation in comparing three-dimensional structures of globular proteins. J Mol Biol. 1994;235:625–634. doi: 10.1006/jmbi.1994.1017. [DOI] [PubMed] [Google Scholar]
- 52.Maiorov VN, Crippen GM. Size-independent comparison of protein three-dimensional structures. Proteins. 1995;22:273–283. doi: 10.1002/prot.340220308. [DOI] [PubMed] [Google Scholar]
Associated Data
This section collects any data citations, data availability statements, or supplementary materials included in this article.