Abstract
The number of pediatric cochlear implant (CI) recipients has increased substantially over the past 10 years, and it has become more important to understand the underlying mechanisms of the variable outcomes in this population. In this study, psychoacoustic measures of spectral-ripple and Schroeder-phase discrimination, the Clinical Assessment of Music Perception, and consonant-nucleus-consonant (CNC) word recognition in quiet and spondee reception threshold (SRT) in noise tests have been presented to 11 prelingually deafened CI users, aged 8–16 years with at least 5 years of CI experience. The children's performance was compared to the previously reported results of postlingually deafened adult CI users. The average spectral-ripple threshold (n = 10) was 2.08 ripples/octave. The average Schroeder-phase discrimination was 67.3% for 50 Hz and 56.5% for 200 Hz (n = 9). The Clinical Assessment of Music Perception test showed that the average complex pitch direction discrimination was 2.98 semitones. The mean melody score was at a chance level, and the mean timbre score was 34.1% correct. The mean CNC word recognition score was 68.6%, and the mean SRT in steady noise was −8.5 dB SNR. The children's spectral-ripple resolution, CNC word recognition, and SRT in noise performances were, within statistical bounds, the same as in a population of postlingually deafened adult CI users. However, Schroeder-phase discrimination and music perception were generally poorer than in the adults. It is possible then that this poorer performance seen in the children might be partly accounted for by the delayed maturation in their temporal processing ability, and because of this, the children's performance may have been driven more by their spectral sensitivity.
Key Words: Cochlear implant, Prelingual hearing loss, Psychophysics, Music, Speech perception
Introduction
A number of studies have investigated speech and music perception and a variety of psychoacoustic performance metrics in postlingually deafened adult cochlear implant (CI) listeners. However, relatively few studies have been reported investigating outcomes in prelingually deafened children using CIs [Chen et al., 2010]. The number of pediatric cochlear implant recipients has been markedly increasing over the past 10 years [Bradham and Jones, 2008], but speech perception outcomes still vary greatly. This is partly due to the fact that speech perception involves multiple interactions between temporal and spectral acoustic information of the speech signals. Therefore, it is important to understand what acoustic cues drive clinical success in implanted children. At the same time, it is crucial to understand how implanted children differ from postlingually deafened implanted adults so that better sound-encoding strategies, mapping, and rehabilitation paradigms can be developed for this population.
Previous studies have evaluated the contribution of spectral and temporal sensitivity to speech or music perception performance in postlingually deafened adult CI listeners [Fu, 2002; Henry and Turner, 2003; Henry et al., 2005; Won et al., 2007, 2010, 2011; Drennan et al., 2008; Saoji et al., 2009]. For example, spectral-ripple discrimination has been widely used to evaluate the spectral sensitivity in CI users and its relationship with speech perception. The spectral-ripple test evaluates listeners’ ability to discriminate between standard and inverted ripple spectrum. The stimuli are composed of frequency components in which their spectral peaks and valleys are interchanged over a wide range of frequency. Spectral-ripple thresholds determined by the minimum ripple spacing discriminated by listeners have been shown to correlate with vowel and consonant recognition [Henry and Turner, 2003; Henry et al., 2005], word recognition in quiet and in noise [Won et al., 2007], and music perception in postlingually deafened adult CI users [Won et al., 2010]. To our best knowledge, spectral-ripple discrimination in prelingually deafened children wearing CIs has not been reported.
A recent study by Drennan et al. [2008] used Schroeder-phase discrimination to evaluate CI users. Positive and negative Schroeder-phase stimuli have nearly flat temporal envelopes and identical long-term spectra but a different temporal fine structure [Schroeder, 1970]. Thus, Schroeder-phase discrimination has been used to evaluate the acoustic temporal fine structure sensitivity in normal-hearing and hearing-impaired listeners [Summers and Leek, 1998; Summers, 2000; Oxenham and Dau, 2001; Dooling et al., 2002; Lauer et al., 2009]. Drennan et al. [2008] demonstrated that Schroeder-phase discrimination evaluates the ability of CI users to track temporal modulations that sweep rapidly across channels. This discrimination performance had a small but significant correlation with speech perception in CI users.
The present study evaluated the spectral and temporal sensitivity of prelingually deafened implanted children using spectral-ripple discrimination and Schroeder-phase discrimination. The assessment of these two metrics allows the evaluation of spectral and temporal sensitivity in such children and further advances our understanding of the similarities and differences between prelingually deafened children and postlingually deafened adults in their speech and music perception abilities. The primary goal of the present study was to measure spectral and temporal sensitivity, speech perception abilities in quiet and in background noise, and music perception abilities in prelingually deafened children with CIs and compare the results to published data on adults who were postlingually deafened and subsequently implanted. To measure speech perception abilities, open-set monosyllabic word recognition in quiet and closed-set spondee word recognition in steady-state noise were evaluated. To determine music perception abilities, the Clinical Assessment of Music Perception (CAMP) test was performed. Previous work has shown that all of these tests are reliable, showing good test-retest reliability with minimal learning in adult CI users [Won et al., 2007; Drennan et al., 2008; Kang et al., 2009]. The secondary goal was to examine relationships between the spectral/temporal sensitivities and speech and music perception abilities.
Methods
Subjects
Eleven prelingually deafened CI users were recruited from Seattle Children's Hospital (7 males and 4 females). Their ages ranged from 8 to 16 years (mean = 12.1). The subject recruitment criteria included implantation before the age of 5 years (mean = 2.4), more than 5 years of CI use (range = 5–16), and age of 8–16 years at testing. All subjects were native English speakers and bilaterally deafened and had no residual hearing in either ear. They were all normally developing children except for their hearing loss. Detailed subject information is listed in table 1. The use of human subjects in this study was reviewed and approved by the Seattle Children's Hospital Institutional Review Board. Some subjects did not participate in all experiments due to time and scheduling constraints.
Table 1.
Demographics of prelingually deafened test subjects
| Subject ID | Age at test, years | Gender | Age at implant years | Duration of CI use, years | Etiology | Device | Processor | Current educational environment |
|---|---|---|---|---|---|---|---|---|
| (contralateral) | (contralateral) | |||||||
| K001J | 10 | M | 4 | 6 | Connexin 26 | CII | F120 | m |
| K002J | 12 | M | 3 | 9 | Connexin 26 | N24 | ACE | m with sign interpretation |
| K003J | 9 | M | 1 | 9 | unknown | CII | F120 | m |
| K004T | 8 | M | 1 (6) | 7 (2) | unknown | N24/freedom | ACE | m |
| K005J | 15 | F | 3 | 12 | CMV | N22 | SPEAK | m with captioning |
| K007J | 11 | M | 2 | 9 | unknown | N24 | ACE | m |
| K008N | 12 | F | 3 | 9 | unknown | N24 | ACE | m |
| K009A | 13 | F | 2 (10) | 11 (2) | Connexin 26 | N24/freedom | ACE | nm |
| K010E | 14 | F | 3 (12) | 11 (2) | Connexin 26 | N24/freedom | ACE | m with interpretation |
| K011H | 16 | M | 2 | 14 | hypoxia (placenta abruption) | N22 | SPEAK | m |
| S013A* | 13 | F | 2 (9) | 11 (3) | meningitis | 90k | F120 | m |
m = Mainstream education; nm = school for hearing impaired; CMV = cytomegalovirus infection.
This patient was originally implanted 11 years ago with a CII device that failed. She has had the right ear explanted and re-implanted two more times. She was using her third internal device on the right side at the test time.
Test Administration
All subjects listened to the stimuli using their own sound processor set to a comfortable listening level. Bilateral users were tested with their first implanted ear only. None of the subject used a hearing aid. CI sound processor settings were not changed from the clinical settings throughout all tests. All tests were conducted in a double-walled, sound-treated booth (IAC). Custom MATLAB (The Mathworks, Inc.) programs were used to present stimuli with a Crown D45 amplifier. A single loudspeaker (B&W DM303), positioned 1 m from the subjects at zero degrees azimuth, presented stimuli in sound field. The order of test administration was randomized across the subjects. The duration of the entire test battery for one subject was approximately 2 h. Most children (all except for K001J, K002J, K003J, and K004T) finished the entire test in a day within 2 h.
Spectral-Ripple Discrimination Test
The spectral-ripple discrimination test used the same stimuli and threshold estimation procedure described by Won et al. [2007]. The ripple stimuli were generated by summing 200 pure-tone frequency components. The stimuli had a total duration of 500 ms and were ramped with a rise/fall time of 150 ms. Each 500-ms stimulus was either a standard (reference stimulus) or inverted ripple (ripple phase-reversed test stimulus). For standard ripples, the phase of the full-wave rectified sinusoidal spectral envelope was set to 0 radians, and for inverted ripples to π/2. The amplitudes of the components were determined by a full-wave rectified sinusoidal envelope on a logarithmic amplitude scale. The ripple peaks were spaced equally on a logarithmic amplitude scale. The stimuli had a bandwidth of 100–5000 Hz and a peak-to-valley ratio of 30 dB. The mean presentation level of the stimuli was 61 dBA and randomly roved by ± 4 dB in 1-dB steps. The starting phases of the components were randomized for each presentation. The ripple densities differed by ratios of 1.414 and included 0.125, 0.176, 0.250, 0.354, 0.500, 0.707, 1.000, 1.414, 2.000, 2.828, 4.000, 5.657, 8.000, and 11.314 ripples/octave. A 3-interval, adaptive forced-choice (AFC) paradigm using a two-up and one-down adaptive procedure was used to determine spectral-ripple discrimination thresholds, converging on 70.7% correct [Levitt, 1971]. Feedback was not provided. The threshold for a single adaptive track was determined by averaging the ripple spacing (the number of ripples/octave) for the final 8 of 13 reversals. The final threshold value for each subject was determined as the mean of the thresholds across three test runs. Prior to actual testing, to ensure the subjects were familiar with the stimuli and the task, they listened to few example stimuli in the presence of the experimenter.
Schroeder-Phase Discrimination Test
The Schroeder-phase discrimination test used in the current study is the same as that previously described by Drennan et al. [2008]. Positive and negative Schroeder-phase stimulus pairs were created for two different fundamental frequencies (F0s) of 50 and 200 Hz. These frequencies were chosen because the 50- and 200-Hz scores can assess a wide range of CI listeners’ performances on the test and because they correlate with a variety of clinical outcome measures [Drennan et al., 2008]. For each F0, equal-amplitude cosine harmonics from the F0 up to 5 kHz were summed. Phase values for each harmonic were determined by the equation θn = ±πn(n + 1)/N, where θn is the phase of the nth harmonic, n is the nth harmonic, and N is the total number of harmonics in the complex. The Schroeder-phase stimuli were presented at 65 dBA without roving the level. A 4-interval, 2-AFC procedure was used. One stimulus (i.e. positive Schroeder-phase, test stimulus) occurred in either the second or third interval and was different from three others (i.e. negative Schroeder phase, reference stimulus). The subject's task was to discriminate the test stimulus from the reference stimuli. To determine a total percent correct for each F0, the method of constant stimuli was used. In a single test block, each F0 was presented 24 times in random order, and a total percent correct for each F0 was calculated as the percent of stimuli correctly identified. The final score for this test was the mean percent correct of four test blocks for each F0. The total number of presentations for each F0 was 96. Visual feedback was provided. Prior to actual testing, the subjects listened to the example stimuli two times for each frequency.
The Consonant-Nucleus-Consonant Word Recognition Test
Fifty consonant-nucleus-consonant (CNC) monosyllabic words (e.g. Home, June, Pad, Sun) from a recorded CD with a male talker were presented from an open set in sound field at 65 dBA [Peterson and Lehiste, 1962]. Each CNC word list was randomly chosen out of ten lists for each subject. A total percent correct score was calculated as the percent of words correctly repeated. Feedback was not provided.
Speech Reception Threshold in Steady Noise Test
The procedure for administering the speech reception threshold (SRT) test was the same as that previously described by Won et al. [2007]. The subjects were asked to identify one randomly chosen spondee word out of a closed set of 12 equally difficult spondees [Harris, 1991] in the presence of background noise [Turner et al., 2004]. The spondees, two-syllable words with equal emphasis on each syllable, were recorded by a female talker. A steady-state, speech-shaped background noise was used, and the onset of the spondees was 500 ms after the onset of the background noise. The steady-state noise had a duration of 2.0 s. The level of the target speech was 65 dBA. The level of the noise was tracked using a one-down one-up procedure with 2-dB steps. Feedback was not provided. For all subjects, the adaptive track started with a +10 dB signal-to-noise ratio (SNR) condition. The threshold for a single test run was estimated by averaging the SNR for the final 10 of 14 reversals. The subjects completed three test runs, and the final threshold for each subject was determined as the mean of the thresholds across these three test runs.
The CAMP Test
The CAMP was used for music testing. The procedure for administering the CAMP test was the same as that previously described by Nimmons et al. [2008] and Kang et al. [2009]. Three components of music perception (pitch, melody, and timbre recognition) were assembled into a computer-driven exercise. Each subtest began with a brief training session in which the subjects were able to familiarize themselves with the test items and protocol.
Complex-Pitch Direction Discrimination. The pitch direction discrimination task was a 2-AFC procedure using synthesized complex tones, and required subjects to identify which of the two complex tones has the higher F0. The dependent variable was the just-noticeable-difference threshold in semitones determined using a one-up one-down tracking procedure. The threshold was estimated as the mean interval size for three repetitions, each determined from the mean of the final 6 of 8 reversals. Complex tones of three F0s (262, 330, and 392 Hz) were used in the task, and the primary dependent variable was the average of the threshold in semitones for all fundamental frequencies. The validity of this approach is further discussed in Kang et al. [2009] or Won et al. [2010].
Melody Identification. In the melody recognition subtest, 12 well-known melody clips were played three times in random order. Rhythm cues were removed such that notes of a longer duration were repeated in a 1/8-note pattern. The presentation level was 65 dBA, and the amplitude of each note was randomly roved by 4 dB. The melody test used synthesized piano-like tones which have identical envelopes. Subjects were asked to identify melodies by selecting the title corresponding to the melodies presented. The primary dependent variable was a total percent correct score calculated after 36 melody presentations including 3 presentations of each melody.
Timbre Identification. In the timbre (musical instrument) recognition subtest, 8 musical instruments, each playing the same recorded melody composed of five notes, were presented three times in random order. The instruments were the piano, trumpet, clarinet, saxophone, flute, violin, cello, and guitar. The presentation level was 65 dBA. The subjects were instructed to select the labeled icon of the instrument corresponding to the timbre presented. The primary dependent variable was a total percent correct score calculated after 24 presentations including 3 presentations of each instrument.
Data Analysis
Data for postlingually deafened adults CI listeners were adopted from previous publications: Won et al. [2007] for spectral-ripple discrimination thresholds, CNC word recognition scores, SRTs in steady-state noise; Drennan et al. [2008] for Schroeder-phase discrimination scores, and Kang et al. [2009] for CAMP test scores. Student's t test was used to compare the mean scores between the child and adult CI listeners. For the child data in the present study, correlation analysis was performed to determine if spectral-ripple and Schroeder-phase discriminations correlate with speech and music outcomes. Pearson's correlation coefficients are reported. Error bars in all figures indicate 95% confidence intervals across the subjects.
Results
Ages (mean = 12.1 years) and duration of CI usage (mean = 9.8 years) were not correlated with any of the test results. There were no differences in gender and educational level.
Spectral-Ripple Discrimination
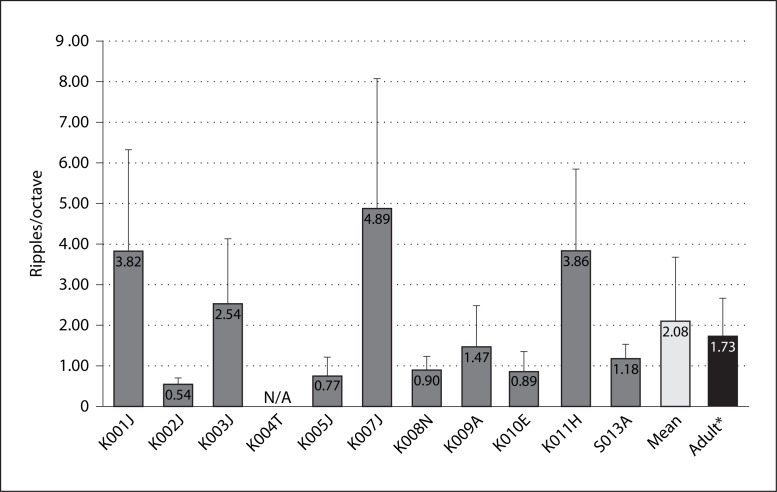
Spectral-ripple thresholds for individual subjects are shown in figure 1. The mean spectral-ripple threshold for 10 child subjects was 2.08 ± 1.6 ripples/octave (±95% confidence interval). A t test indicated that there was no statistical difference (p = 0.4) between the results of the children in the present study and the adult average of 1.73 ± 0.9 ripples/octave reported by Won et al. [2007].
Fig. 1.
Spectral-ripple discrimination thresholds. Error bars indicate 1 SD. K004T did not finish the test. * Adult data (n = 31) adopted from Won et al. [2007].
Schroeder-Phase Discrimination
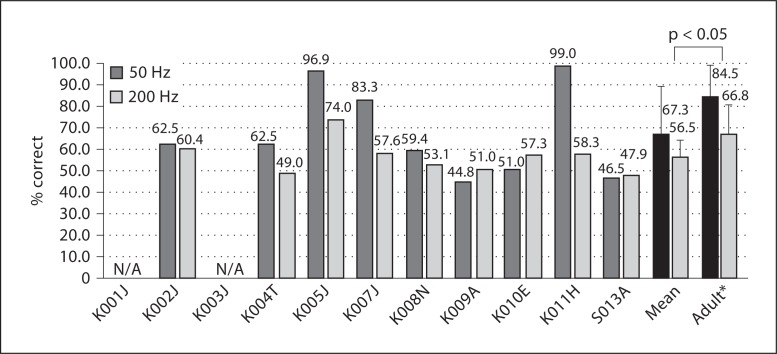
For 9 children, the average score for the 50-Hz Schroeder-phase discrimination was 67.3 ± 20.8% and for the 200-Hz Schroeder-phase discrimination 56.5 ± 7.9%. Individual scores are shown in figure 2. For 24 adult CI subjects, Drennan et al. [2008] reported mean scores of 84.5% for 50 Hz and 66.8% for 200 Hz. The 50- and 200-Hz Schroeder-phase scores for children were above the chance level (p = 0.04), and when compared to the adult subjects, child subjects were worse at both frequencies (p = 0.01 for 50 Hz; p = 0.046 for 200 Hz). This result was also confirmed by a repeated measure of ANOVA. The effect of Schroeder-phase frequency (as a within-subject variable, F[1,30] = 26.1, p < 0.0001) and subject populations (i.e. children vs. adults as a between-subject variable, F[1,30] = 6.6, p = 0.016) was significant, whereas there was no interaction between the two factors (F[1,30] = 101.2, p = 0.32).
Fig. 2.
Schroeder-phase discrimination test scores. The mean scores for the 50- and 200-Hz Schroeder-phase stimuli in children were worse than in adults (p = 0.012 for 50 Hz; p = 0.046 for 200 Hz). K001J and K003J did not conduct the test. Error bars indicate 1 SD. * Adult data (n = 24) adopted from Drennan et al. [2008].
CNC Word Recognition
Table 2 shows CNC word recognition scores for individual subjects. The average CNC word recognition score for 10 child subjects was 68.6 ± 14.9%, which is nearly identical to the average CNC score for 15 adult subjects (68.9 ± 18.1%) reported by Won et al. [2007] and similar to the score of 63 ± 4.3% for an unpublished cohort of 97 postlingually deafened implanted adults.
Table 2.
CNC word recognition test score
| Subject ID | CNC word (% correct) |
|---|---|
| K001J | 64 |
| K002J | 46 |
| K003J | 80 |
| K004T | N/A |
| K005J | 52 |
| K007J | 72 |
| K008N | 88 |
| K009A | 82 |
| K010E | 50 |
| K011H | 80 |
| S013A | 72 |
| Mean | 68.6 (±14.9) |
| Mean for adults* | 68.9 (±18.1) |
Adult data (n = 15) adopted from Won et al. [2007].
SRT in Steady Noise
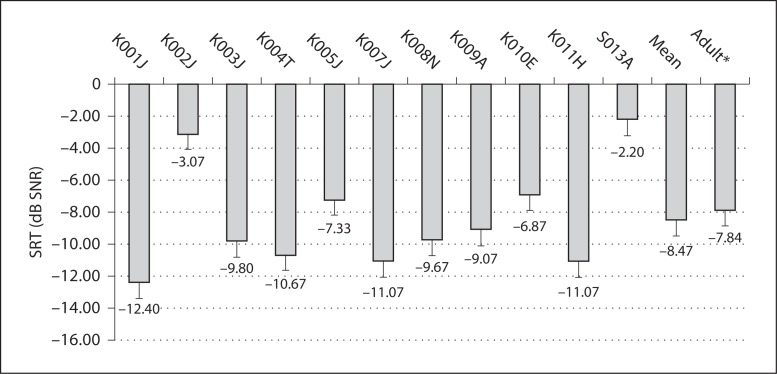
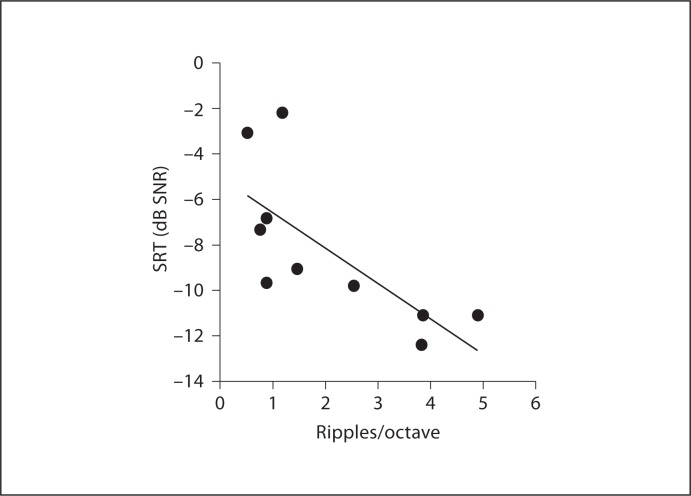
The average SRT for all 11 children was −8.5 ± 3.3 dB SNR. Individual SRTs for these subjects are shown in figure 3. Previously, the mean SRT for 29 adult CI subjects was reported to be −7.8 ± 4.47 dB SNR. As with CNC word recognition, SRTs in the two populations were very similar. In the 11 children, a significant correlation was found between CNC scores and SRTs in noise (r = −0.71, p < 0.001). Won et al. [2007] showed a significant correlation between spectral-ripple thresholds and SRTs in steady-state noise for 29 adult CI subjects (r = −0.62, p = 0.0004). For 10 child subjects in the present study, a significant correlation was also found between spectral-ripple thresholds and SRTs in steady-state noise (r = −0.72, p = 0.018). Figure 4 shows the scattergram of spectral-ripple thresholds and SRTs in steady-state noise.
Fig. 3.
SRT scores in the steady state noise test. Mean SRT scores of children were not different from those of adults (p = 0.67). Error bars indicate 1 SD. * Adult data (n = 29) adopted from Won et al. [2007].
Fig. 4.
Scatter plot between spectral-ripple discrimination thresholds and SRTs in steady noise. The solid line represents linear regression (r = −0.72, p = 0.018). Note that the p value is not corrected for multiple analyses.
Clinical Assessment of Music Perception
The total duration for all CAMP tests including pitch, melody, and timbre subtests was 25.3 ± 4.6 min. Pediatric implantees reported that the melody test was most difficult. However, all 11 subjects completed the subtests with minimal intervention from the test administrator.
Complex-Pitch Direction Discrimination
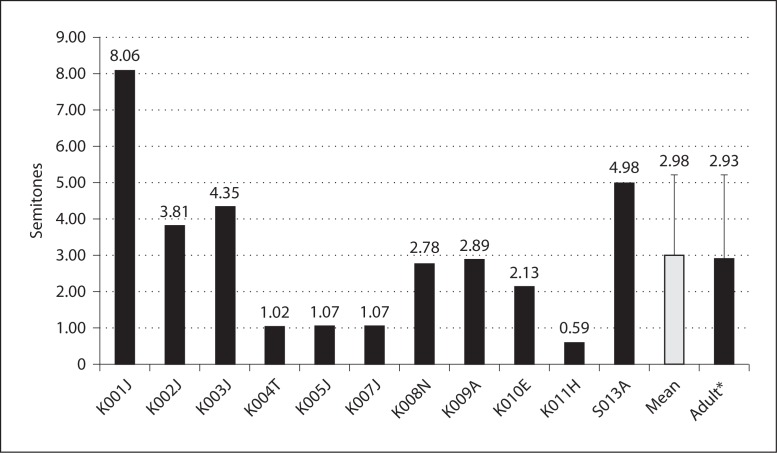
The complex-pitch direction discrimination ability of the children was the same as of the adult implantees (p = 0.96; fig. 5). The mean pitch direction threshold over three base frequencies was 2.98 ± 2.23 semitones. The pitch direction thresholds for the three base frequencies were 2.89 ± 1.64 semitones for 262 Hz (middle C; C4), 2.96 ± 2.95 semitones for 330 Hz (E4), and 3.08 ± 2.55 semitones for 391 Hz (G4). The mean pitch threshold for 42 adult CI subjects was 2.93 ± 2.27 semitones [Kang et al., 2009]. There was no significant difference between children and adults at any frequency.
Fig. 5.
Complex pitch direction discrimination scores in UW-CAMP. Error bars indicate 1 SD. * Adult data (n = 42) are adopted from Kang et al. [2009].
Melody Identification
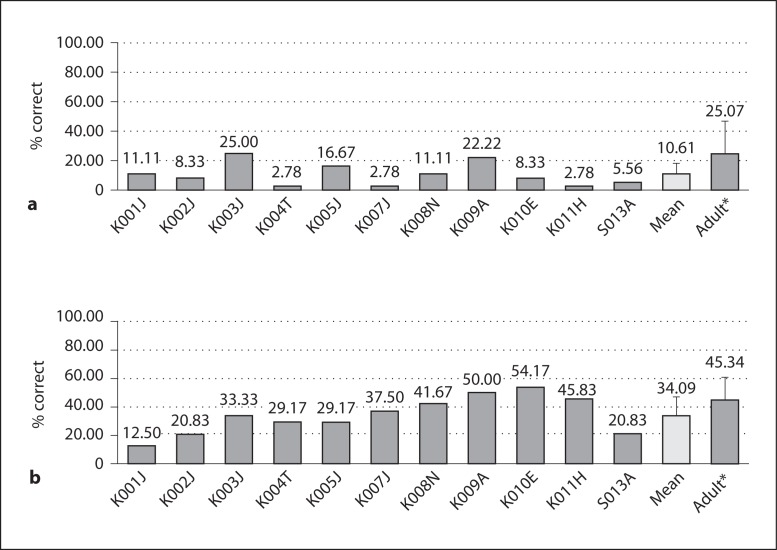
The children's performances on the isochronous melody identification test ranged from 2.78 to 25.0%, and the average score was 10.61 ± 7.74% (fig. 6a). Statistical comparison between children and adults was not conducted because the children's performance was not significantly different from the chance level (p = 0.35; one-sample t test).
Fig. 6.
a Melody identification scores. The children's melody scores were not significantly different from the chance level of 8.3% (one-sample t test, p = 0.35). b Timbre identification scores. The children's mean timbre scores were worse than those of the adults (t test, p = 0.039). Error bars indicate 1 SD. * Adult data (n = 42) adopted from Kang et al. [2009].
Timbre Identification
Timbre scores for implanted children ranged from 12.50 to 54.17% with a mean score of 34.09 ± 13.15% (fig. 6b), which was significantly higher than the chance level (p = 0.027). Kang et al. [2009] reported a mean timbre score of 45.34 ± 16.21% correct for implanted adults. The children's timbre recognition scores were significantly worse than those of the adult subjects (p = 0.039). The child subjects recognized the guitar most often (55%) and the flute least often (15%). Confusion matrices showed that the flute was most often confused with the violin.
Discussion
In the present study, spectral-ripple discrimination, Schroeder-phase discrimination, speech perception in quiet and noise, and CAMP tests were successfully administered to prelingually deafened implanted children when they were appropriately instructed and encouraged. Their spectral-ripple discrimination, complex-pitch direction discrimination, CNC word recognition, and speech perception in noise results were, within statistical bounds, similar to those reported for postlingually deafened adult CI users. However, they were generally poorer than adult CI users on Schroeder-phase discrimination as well as on melody and timbre identification.
Spectral abilities, as measured by spectral-ripple discrimination thresholds were statistically identical to those of adult CI users, but the child subjects were generally poor at the Schroeder-phase discrimination test and their scores were significantly worse than those of the adults. Previous studies demonstrated that temporal sensitivity takes longer to develop than frequency sensitivity, and normal-hearing children do not develop adult temporal processing ability until the age of 11 years [Wightman et al., 1989; Elfenbein et al., 1993; Buss et al., 1999]. In young normal-hearing listeners, peripheral temporal mechanisms may be adult-like, but the central auditory system may be less efficient in extracting temporal information [Plack and Moore, 1990]. It is possible then that the poorer Schroeder-phase discrimination scores seen in the children might be partly accounted for by the delayed maturation in their temporal processing ability.
Almost identical performance was observed in the two populations for CNC word recognition and spondee word recognition in steady-state noise. Prelingually implanted children and postlingually implanted adults were previously reported to have no difference in speech perception performance [Tyler et al., 2000; Oh et al., 2003]. In the present study, the same trend was also observed for complex-pitch direction discrimination. However, the children's melody and timbre scores were significantly worse than those of adults. This inconsistent pattern relative to adults’ performance was also observed in the correlation analyses. For example, SRTs in steady noise were significantly correlated (r = −0.72, p = 0.018) with spectral-ripple discrimination thresholds in the child subjects (fig. 4), which is consistent with findings in adults [Won et al., 2007]. For music perception, spectral-ripple discrimination was not correlated with any of the three subtests, whereas adult CI users showed significant correlations between spectral-ripple discrimination and all three music subtests [Won et al., 2010]. It should be noted that correlation analyses with the melody scores are not appropriate in this study because the melody test results were at the chance level in the child subjects. It is not clear why correlation patterns are different in the two populations; however, the small sample size for the child subjects may certainly play a role. Familiarity with the musical instruments and melodies that make up the timbre and melody subtests should not be a significant factor as these children all were placed in educational settings that emphasized musical exposure as part of their early education. They were nearly all mainstreamed by the time of testing.
However, it is reasonable to speculate that the different performance patterns observed in the children may be attributed to their immature temporal sensitivity and, as a result, they may use temporal and spectral sensitivities differently compared to adults. CI users receive limited information both for temporal and spectral aspects of sound. The limited temporal information is determined by the loss of temporal fine structure by implant sound processing and potentially limited envelope encoding at the electroneural interface. The limited number of spectral channels largely determines the limited spectral resolution in CI users. These device-related constraints are equally applied to both adults and children, but child CI users are further affected by their immature temporal sensitivity and potentially other limitations in the development of central temporal perception due to the degraded signal provided by the implant. Previous studies, either using acoustic vocoder simulation for normal-hearing listeners or manipulating the processing parameters for CI users, have demonstrated the relative importance of spectral and temporal sensitivity and their interaction on speech recognition [Cazals et al., 1994; Dooling et al., 2002; Smith et al., 2002; Stone et al., 2008]. For example, Xu et al. [2005] and Stone et al. [2008] showed that providing temporal envelope information is more beneficial for listeners when spectral resolution is limited. Using a different approach, Drennan et al. [2008] demonstrated the effect of interaction between spectral and temporal sensitivity of CI processing strategies. They tested two different processing strategies, HiResolution and Fidelity120, with the test batteries used in the present study. Fidelity120 showed better spectral-ripple discrimination, but worse Schroeder-phase discrimination compared to HiResolution. This spectrotemporal tradeoff resulted in the identical speech and music perception performance for the two strategies.
With this line of thought, it is plausible that the children's performance may have been driven more by their spectral sensitivity. The identical spectral-ripple thresholds obtained from the children and adults and the worse Schroeder-phase discrimination score in the children support this idea. Melody and timbre recognition may be determined by both spectral and temporal sensitivity, and the poorer temporal sensitivity in the children might have led them to perform worse than the adults. For speech perception, spectral sensitivity in the children may be sufficient to perform similarly to adults. This suggests that performance on musical tasks of prelingually deafened implanted children may improve after their temporal sensitivity has matured. This hypothesis can be tested in the future as this cohort grows older.
Disclosure Statement
Dr. Rubinstein has been a paid consultant for Cochlear, Ltd. and Advanced Bionics and has received research funding from both companies. Neither company played any role in data acquisition, analysis, or the composition of the manuscript.
Acknowledgements
The authors are grateful for the dedicated efforts of all young subjects and their parents and guardians, and for the NIH grants R01-DC007525, P30-DC04661, L30-DC008490, and F31-DC009755, and an educational fellowship from Advanced Bionics Corporation.
References
- Bradham T, Jones J. Cochlear implant candidacy in the United States: prevalence in children 12 months to 6 years of age. Int J Pediatr Otorhinolaryngol. 2008;7:1023–1028. doi: 10.1016/j.ijporl.2008.03.005. [DOI] [PubMed] [Google Scholar]
- Buss E, Hall JW, 3rd, Grose JH, Dev MB. Development of adult-like performance in backward, simultaneous, and forward masking. J Speech Lang Hear Res. 1999;4:844–849. doi: 10.1044/jslhr.4204.844. [DOI] [PubMed] [Google Scholar]
- Cazals Y, Pelizzone M, Saudan O, Boex C. Low-pass filtering in amplitude modulation detection associated with vowel and consonant identification in subjects with cochlear implants. J Acoust Soc Am. 1994;4:2048–2054. doi: 10.1121/1.410146. [DOI] [PubMed] [Google Scholar]
- Chen JK, Chuang AY, McMahon C, Hsieh JC, Tung TH, Li LP. Music training improves pitch perception in prelingually deafened children with cochlear implants. Pediatrics. 2010;4:e793–e800. doi: 10.1542/peds.2008-3620. [DOI] [PubMed] [Google Scholar]
- Dooling RJ, Leek MR, Gleich O, Dent ML. Auditory temporal resolution in birds: discrimination of harmonic complexes. J Acoust Soc Am. 2002;2:748–759. doi: 10.1121/1.1494447. [DOI] [PubMed] [Google Scholar]
- Drennan WR, Longnion JK, Ruffin C, Rubinstein JT. Discrimination of Schroeder-phase harmonic complexes by normal-hearing and cochlear-implant listeners. J Assoc Res Otolaryngol. 2008;1:138–149. doi: 10.1007/s10162-007-0107-6. [DOI] [PMC free article] [PubMed] [Google Scholar]
- Elfenbein JL, Small AM, Davis JM. Developmental patterns of duration discrimination. J Speech Hear Res. 1993;4:842–849. doi: 10.1044/jshr.3604.842. [DOI] [PubMed] [Google Scholar]
- Fu QJ. Temporal processing and speech recognition in cochlear implant users. Neuroreport. 2002;13:1635–1639. doi: 10.1097/00001756-200209160-00013. [DOI] [PubMed] [Google Scholar]
- Harris RW. Speech Audiometry Materials Compact Disk. Provo: Brigham Young University; 1991. [Google Scholar]
- Henry BA, Turner CW. The resolution of complex spectral patterns by cochlear implant and normal-hearing listeners. J Acoust Soc Am. 2003;5:2861–2873. doi: 10.1121/1.1561900. [DOI] [PubMed] [Google Scholar]
- Henry BA, Turner CW, Behrens A. Spectral peak resolution and speech recognition in quiet: normal hearing, hearing impaired, and cochlear implant listeners. J Acoust Soc Am. 2005;2:1111–1121. doi: 10.1121/1.1944567. [DOI] [PubMed] [Google Scholar]
- Kang R, Nimmons GL, Drennan W, Longnion J, Ruffin C, Nie K, Won JH, Worman T, Yueh B, Rubinstein J. Development and validation of the University of Washington Clinical Assessment of Music Perception test. Ear Hear. 2009;4:411–418. doi: 10.1097/AUD.0b013e3181a61bc0. [DOI] [PMC free article] [PubMed] [Google Scholar]
- Lauer AM, Molis M, Leek MR. Discrimination of time-reversed harmonic complexes by normal-hearing and hearing-impaired listeners. J Assoc Res Otolaryngol. 2009;4:609–619. doi: 10.1007/s10162-009-0182-y. [DOI] [PMC free article] [PubMed] [Google Scholar]
- Levitt H. Transformed up-down methods in psychoacoustics. J Acoust Soc Am. 1971;2(suppl 2):467. [PubMed] [Google Scholar]
- Nimmons GL, Kang RS, Drennan WR, Longnion J, Ruffin C, Worman T, Yueh B, Rubenstien JT. Clinical assessment of music perception in cochlear implant listeners. Otol Neurotol. 2008;2:149–155. doi: 10.1097/mao.0b013e31812f7244. [DOI] [PMC free article] [PubMed] [Google Scholar]
- Oh SH, Kim CS, Kang EJ, Lee DS, Lee HJ, Chang SO, Ahn SH, Hwang CH, Park HJ, Koo JW. Speech perception after cochlear implantation over a 4-year time period. Acta Otolaryngol. 2003;2:148–153. doi: 10.1080/0036554021000028111. [DOI] [PubMed] [Google Scholar]
- Oxenham AJ, Dau T. Towards a measure of auditory-filter phase response. J Acoust Soc Am. 2001;6:3169–3178. doi: 10.1121/1.1414706. [DOI] [PubMed] [Google Scholar]
- Peterson GE, Lehiste I. Revised CNC lists for auditory tests. J Speech Hear Disord. 1962;27:62–70. doi: 10.1044/jshd.2701.62. [DOI] [PubMed] [Google Scholar]
- Plack CJ, Moore BC. Temporal window shape as a function of frequency and level. J Acoust Soc Am. 1990;5:2178–2187. doi: 10.1121/1.399185. [DOI] [PubMed] [Google Scholar]
- Saoji AA, Litvak L, Spahr AJ, Eddins DA. Spectral modulation detection and vowel and consonant identifications in cochlear implant listeners. J Acoust Soc Am. 2009;3:955–958. doi: 10.1121/1.3179670. [DOI] [PubMed] [Google Scholar]
- Schroeder MR. Synthesis of low-peak-factor signals and binary sequences with low autocorrelation. IEEE Trans Inf Theory. 1970;16:85–89. [Google Scholar]
- Smith ZM, Delgutte B, Oxenham AJ. Chimaeric sounds reveal dichotomies in auditory perception. Nature. 2002;6876:87–90. doi: 10.1038/416087a. [DOI] [PMC free article] [PubMed] [Google Scholar]
- Stone MA, Fullgrabe C, Moore BC. Benefit of high-rate envelope cues in vocoder processing: effect of number of channels and spectral region. J Acoust Soc Am. 2008;4:2272–2282. doi: 10.1121/1.2968678. [DOI] [PubMed] [Google Scholar]
- Summers V. Effects of hearing impairment and presentation level on masking period patterns for Schroeder-phase harmonic complexes. J Acoust Soc Am. 2000;5:2307–2317. doi: 10.1121/1.1318897. [DOI] [PubMed] [Google Scholar]
- Summers V, Leek MR. Masking of tones and speech by Schroeder-phase harmonic complexes in normally hearing and hearing-impaired listeners. Hear Res. 1998;1–2:139–150. doi: 10.1016/s0378-5955(98)00030-6. [DOI] [PubMed] [Google Scholar]
- Turner CW, Gantz BJ, Vidal C, Behrens A, Henry BA. Speech recognition in noise for cochlear implant listeners: benefits of residual acoustic hearing. J Acoust Soc Am. 2004;4:1729–1735. doi: 10.1121/1.1687425. [DOI] [PubMed] [Google Scholar]
- Tyler RS, Rubinstein JT, Teagle H, Kelsay D, Gantz BJ. Pre-lingually deaf children can perform as well as post-lingually deaf adults using cochlear implants. Cochlear Implants Int. 2000;1:39–44. doi: 10.1179/cim.2000.1.1.39. [DOI] [PubMed] [Google Scholar]
- Wightman F, Allen P, Dolan T, Kistler D, Jamieson D. Temporal resolution in children. Child Dev. 1989;3:611–624. [PubMed] [Google Scholar]
- Won JH, Drennan WR, Kang RS, Rubinstein JT. Psychoacoustic abilities associated with music perception in cochlear implant users. Ear Hear. 2010;6:796–805. doi: 10.1097/AUD.0b013e3181e8b7bd. [DOI] [PMC free article] [PubMed] [Google Scholar]
- Won JH, Drennan WR, Rubinstein JT. Spectral-ripple resolution correlates with speech reception in noise in cochlear implant users. J Assoc Res Otolaryngol. 2007;3:384–392. doi: 10.1007/s10162-007-0085-8. [DOI] [PMC free article] [PubMed] [Google Scholar]
- Won JH, Drennan WR, Nie K, Jameyson EM, Rubinstein JT. Acoustic temporal modulation detection and speech perception in cochlear implant listeners. J Acoust Soc Am. 2011;130:376–388. doi: 10.1121/1.3592521. [DOI] [PMC free article] [PubMed] [Google Scholar]
- Xu L, Thompson CS, Pfingst BE. Relative contributions of spectral and temporal cues for phoneme recognition. J Acoust Soc Am. 2005;5:3255–3267. doi: 10.1121/1.1886405. [DOI] [PMC free article] [PubMed] [Google Scholar]


