

Abstract
Stereology offers a number of tools for the analysis of sections in microscopy (which usually provide only two-dimensional information) for the purpose of estimating geometric quantities, such as volume, surface area, length or number of particles (cells or other structures). The use of these tools enables recovery of the three-dimensional information that is inherent in biological tissues. This review uses the liver as a paradigm for summarizing the most commonly used state-of-the-art methods for quantitation in design-based stereology. Because it is often relevant to distinguish hyperplasia and hypertrophy in liver responses, we also focus on potential pitfalls in the sampling and processing of liver specimens for stereological purposes, and assess the existing methods for volume and number estimation. With respect to volume, we considered whole liver volume (V), volume density (VV) and so-called local volumes, including the number-weighted volume ( ) and the volume-weighted volume (
 ). For number, we considered the total number (N) and the numerical density (NV). If correctly applied, current stereological methods guarantee that no bias is introduced in the estimates, which will be therefore accurate; additionally, methods can be tuned for obtaining precise quantitative estimates that can reveal subtle changes in the volume or number of selected hepatic cells. These methods have already detailed the effects of some substances and specific diets on the liver, and should be routinely included in the toolbox of liver research.
Keywords: liver, number, stereology, volume
Introduction
Histological evaluation of the liver is often required for several purposes, such as the diagnosis of drug-induced hepatitis and non-alcoholic fatty liver disease, or to assess the severity of damage in chronic hepatitis. Liver biopsy continues to be the gold standard for grading liver fibrosis/cirrhosis and diagnosing hepatocellular carcinoma. Regarding the former, a precise quantification of fibrotic tissue, both in clinical studies and experimental models, has been pursued over the last decade (Dahab et al. 2004). Recently, it was shown that the relative volume, determined by point-counting, is undoubtedly useful in the evaluation of hepatic fibrosis (Vertemati et al. 2004), diagnosis of hepatocellular carcinoma (Vertemati et al. 2008), and in assessing hepatic steatosis in liver biopsies (Catta-Preta et al. 2011).
A frequent misconception is that stereology, image analysis and morphometry are all the same thing. Put simply, morphometry is mainly two-dimensional (2D): either histological, confocal or electron microscopy images are analysed, and it uses a calliper micrometer or a digital tool to perform direct measurements. In contrast, in image analysis a software program extracts (semi- or fully automatically) meaningful information from digital images. Image analysis deals with pixels (along a line or within an outlined area) that are converted into real units (e.g. μm) after system calibration. It is essentially a 2D procedure and nowadays image analysis has incorporated and replaced morphometry but not stereology, because the latter adds another dimension. Instead of measuring pixels, stereology analyses 2D (physical or optical) sections by superimposing test systems (geometrical probes) consisting of points, lines or planes, in order to recover (ideally accurately) the three-dimensional (3D) information inherent within biological tissues (Mouton, 2002; Mandarim-de-Lacerda, 2003; Ochs, 2006; Fig. 1).
Fig. 1.
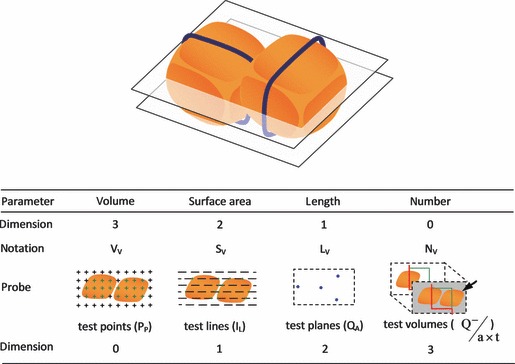
For the sake of illustration consider two particles (for instance, two hepatocytes surrounded by biliary canaliculi) in a defined space, in which the relative parameters of volume (VV), surface (SV), length (LV) and number (NV) are determined. The dimension of the parameter plus the dimension of the probe has to be at least 3. In this vein, points (zero-dimensional) are counted to estimate volume (three-dimensional), whereas interceptions (I) of test lines (one-dimensional) are counted to estimate the surface area (two-dimensional). In the case of linear structures (here in blue), test planes (two-dimensional) determine their length (one-dimensional). Note that number (zero-dimensional) has to be estimated with test volumes (three-dimensional). This volume is called a disector and particles are counted (Q-) as they appear (arrow) inside a counting box with a defined volume (a × t).
Stereology has a strong mathematical and statistical foundation, meaning that procedures aim to grant accuracy and that the precision of the 3D estimations can always be computed (even if sometimes only approximately in non-independent sampling designs). The accuracy and precision depend on factors, such as (adequate) sample size, randomization and tissue isotropy (Mandarim-de-Lacerda, 2003). In fact, randomness is a key word in stereology that is often obviated by microscopists using image analysis. In the latter, not only the data are typically 2D and biased in relation to the 3D reality, but also the accuracy of the obtained data depends on how the software was programmed (based on model assumptions) and then calibrated, and how the images were obtained and edited. Actually, in order to achieve biological preciseness with image analysis applied to microscopy, an extensive time is needed for editing unwanted information (Mouton, 2002). Thirty years ago, Gundersen et al. (1981) compared these two methodologies to estimate the area of cells, observing that point-counting (stereological method) is faster than pixel counting (image analysis method). Although the two could give similar results, pixel counting rendered greater variation unless time and effort was taken to carefully outline the structures of interest (Gundersen et al. 1981). Even the most advanced image analysis approaches for particle recognition and measurement of microscopy images still make less accurate assessments than a trained human (Mouton, 2002). Recently, those two methods were compared in the assessment of hepatic steatosis in liver biopsies: both approaches rendered similar results, but point-counting had lower intra- and inter-observer variability (Catta-Preta et al. 2011). Nevertheless, image analysis and stereology should not be regarded as incompatible but complementary, and actually tend to be integrated with each other: recent stereological software such as the newCast (Visiopharm) have optional image analysis modules that can be extremely helpful for automating stereology, for instance in the alignment of consecutive sections in the physical disector (Gardi et al. 2006), as we will further detail below. In fact, in the last decade stereological methods have been integrated with some of the breakthroughs in microscopy, like confocal microscopy: nowadays, a semi-automated confocal microscopy stereological system is even available (Stereo Investigator Confocal Spinning Disk from MBF Bioscience; Lemmens et al. 2010). Whole-slide imaging also seems promising for stereological purposes, as the high-resolution digital representations of the tissue sections can be studied in a computer station with stereological software, in parallel or after being used for digital histology or pathology. As to this matter, only recently whole-slide stereology tools appeared that are integrated with commercially available digital slide scanning systems.
Stereological methods are nowadays viewed as essential to quantify cells or other types of structures embedded in 3D universes, in an unbiased and reproducible manner. A quarter of a century has passed since the milestone that marked the generation of the so-called ‘design-based’ generation of stereological methods (Sterio, 1984). These continue to be updated, with the advent of new tools (Gundersen et al. 1988; Gardi et al. 2008; Stark et al. 2011) and applications in different fields of knowledge, with a traditionally special emphasis to neurosciences (Mayhew & Gundersen, 1996; Mouton, 2002). Nowadays, this generation of methods coexists with the old ‘model-based’ strategies, but differences exist between the methodologies: the ‘design-based’ approach implies that no strict assumptions (about shape, size, orientation or distribution) are made about the objects under study and, instead, that a system of sampling rules is designed in order to ensure that all objects in the targeted space have the same probability of being sampled and targeted by the desired probe (Geuna, 2005). Although some controversy still exists regarding the best suited methodology, it should be noted that the choice of method for each case should rely on the nature of the material under study, the type of object being quantified and on the level of accuracy required (Guillery, 2002). The latter is quite important as it is recognized that the assumptions inherent to model-based strategies can cause an uncontrolled amount of bias, which only emerge when estimations by ‘model’ and ‘design’ approaches are compared in detail (Von Bartheld, 2002). To the best of our knowledge, this has never been performed in liver research.
It is curious that in terms of structural and functional complexity the brain is said to be immediately followed by the liver (Malarkey et al. 2005), but in the use of stereology these organs are ranked far apart. A quick search with Web of KnowledgeSM using the keywords ‘stereology/stereological’ renders two–three times more results with ‘brain’ than with ‘liver’. Although a rising interest has been devoted to design-based applications in the fish liver (Rocha et al. 2010), the number of such studies in both rodents and humans is still relatively low. For this reason, in this review we give an overview of practical guidelines for applying ‘design-based’ stereology in the liver, covering in some detail the volume and number estimations. We do expect that this work may encourage other hepatologists to update and eventually improve their quantitative approaches on the structure of both healthy and diseased liver.
Sampling liver fragments
The sampling strategy is often overlooked outside the stereology field (Ochs, 2006). In stereology, the minimum workload should be always balanced with the aimed precision of the quantitative information, considering also the natural biological variability. The two pillars of the current strategies are the principles of both random and systematic samplings, in order to give each particle (e.g. a cell) being studied an equal opportunity to be sampled (Kordower, 2000). In other words, the entire structure is sampled with equal probability – meaning that two or three presumably ‘representative’ sections from the middle of the organ may be unacceptable in the light of stereology, as they produce an undetermined amount of bias if cells are unequally distributed in the organ (Dorph-Petersen et al. 2001), or if they contain regional differences (intrinsic or derived from local factors such as differential vascular supply in a disease). Thus, using a fragment of a single liver lobe is often unrepresentative, as lobar heterogeneities have been described even in normal conditions, namely in the vascular system and iron distribution, as well as in pathological conditions, such as acetaminophen hepatotoxicity, chemical carcinogenesis and cirrhosis (Malarkey et al. 2005). Even the regenerative potential differs between liver lobes: fivefold differences in the number of proliferating hepatocytes have been reported (Deng et al. 2009).
In a correct approach, the whole liver volume is first estimated and then a sampling cascade is applied, in order to obtain truly representative samples of all parts of the liver. In our experience with rodent and other laboratory models, usually about five–10 pieces are analysed per animal to offer precise and accurate estimates across a group. Basically, two types of sampling have been applied in rodents, to obtain liver pieces for fixation and processing (Fig. 2): first, independent uniformly random sampling; and second, systematic uniform random (SUR). In the latter, the sampling variance is always reduced by a ‘smooth’ arrangement of fragments: in the so-called ‘smooth fractionator’, the fragments obtained from macroscopically slicing an organ (preferably with a constant slice thickness) are placed in a diamond-shaped pattern so that the size increases from each end to the middle (Nyengaard, 1999; Gundersen, 2002). In some species (e.g. many fish species), the liver is naturally smooth arranged after sectioning but, for instance, in the rat and mouse, the liver slices have to be reordered in the desired smooth distribution (Fig. 2d). This will add an extra (but easy) step while sampling liver pieces, but considering the gain in sampling efficiency it is worth doing, as already illustrated by us in rats (Marcos et al. 2004). The use of SUR sampling has a consequence in terms of determining the coefficient of error (CE): the conventional formula ( , where CV and n refer to the coefficient of variation and number of objects measured or counted, respectively) often does not apply, because fragments are not completely independent from each other (e.g. in Fig. 2d, the sixth fragment [#17] is only sampled if fragment #1 was sampled, i.e. if 2 was the random number picked and the sampling period was 4). For this reason, special formulas for estimating the CE have been developed and revised over time, for instance for the V estimation with the Cavalieri point-counting method (Gundersen et al. 1999) or the N estimation with the fractionator (Schmitz & Hof, 2000); these newer formulas incorporate the systematic sampling variation, which comes from the variation of the targeted stereological parameter between each section (Howard & Reed, 2005).
Fig. 2.
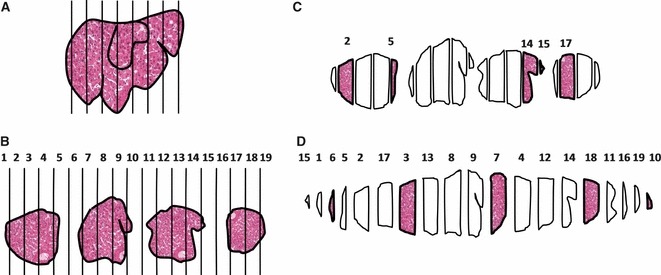
Sampling cascade that can be applied in the liver: the liver is cut in slices (a), which are chopped in small fragments (b). Afterwards, the pieces can be selected by: (c) independent random sampling; in this case, five random numbers are taken from 1 to 19; (d) systematic uniform random, meaning that the first fragment is taken at random (from 1 to 4, in this example) and then fragments are systematically sampled (every fourth fragment). In (d) a smooth fractionator was performed, as the pieces were rearranged smoothly, in a diamond shape pattern (with larger pieces in the middle and smaller ones at the periphery).
It is opportune to mention that recently a non-uniform random sampling method was developed: the proportionator (Gardi et al. 2008) is said to increase the efficiency up to 25%, compared with SUR sampling (Boyce et al. 2010). Although never used in the liver, it may be useful in studies with histochemical or immunohistochemical staining (e.g. pericentral staining with antibodies against glutamine synthetase). In that case the sampling of all fields would be proportional to the staining intensity, determined by image analysis (Boyce et al. 2010).
Fixation and processing
Fixation and processing for microscopy always produces artefacts in tissues, and the liver is not an exception. The choice of the fixative depends mainly on the type of analysis, if light and/or transmission electron microscopy or other are being considered, and on the targeted cell (eventually requiring specific tagging for proper identification, e.g. by immunohistochemistry). Fixation delay, the type of fixative and its acidity have been reported to play a role (Baak et al. 1989; Wisse et al. 2010). In optical microscopy, most studies use buffered formalin, because it is reported to produce fewer artefacts. Bouin's fixative and mercury formalin, for instance, reduce the nuclear profile area of hepatocytes by 25% (Baak et al. 1989). Moreover, the fixation route may also be important: perfusion fixation (through the portal vein or transcardiacally) always renders the best fixation (Wisse et al. 2010) but, by flushing the vascular bed, it was reported as providing estimates of volume fraction of sinusoids that are greater when compared with immersion fixed livers (Blouin et al. 1977). Even the dehydration can influence stereological estimations, as it was proven that the numerical density of nuclei in acetone-dehydrated liver pieces is larger than in ethanol-dehydrated (Baak et al. 1989). Ultimately, it is the embedding medium that will majorly affect the stereological estimations and, consequently, several issues have to be considered when choosing the best embedding medium for a particular study.
Paraffin embedding is usually sufficient for routine diagnosis and may be adequate for most clinical applications of quantitative histopathology, if bias is controlled by standardization (Ladekarl, 1998). Optimal processing is crucial in paraffin embedding, because relatively subtle changes in procedures may have a dramatic influence in the measurement results (Ladekarl, 1998). With paraffin, serial sectioning is easy, good morphology is achieved and nowadays it is compatible with most antibodies used in hepatology. Although differential z-axis compression along the section and shrinkage can undermine the estimations, it has been recommended for counting particles (Von Bartheld, 2002; Geuna, 2005). Some authors still recommend frozen cryostat sections for counting procedures (Baryshnikova et al. 2006), but it should be noted that the morphology is generally poor and serial sectioning (often required in stereological procedures) is not particularly easy (in our experience) and is even reported as extremely difficult (Von Bartheld, 2002). On the other hand, the (much more expensive) methacrylate and epoxy resins provide excellent preservation of structural details with very little shrinkage and distortion; although embedding is more cumbersome than with paraffin, they provide very thin sections and are generally recommended for volume estimations (Ladekarl, 1998); methacrylate can actually provide a broader range (0.5–40 μm) of section thickness with an increased regularity when compared with paraffin (Guillery, 2002).
Shrinkage and cell identification are the two factors to keep in mind when processing tissues for stereological studies, particular those targeting cell size. It is unanimously agreed that shrinkage is relevant in volume and area estimations in cryostat and paraffin sections, but not in methacrylate or epoxy sections (Ladekarl, 1998; Mouton, 2002). Due to shrinkage, cells appear smaller and closer to each other in paraffin sections. In the rat liver, we observed 38% of shrinkage from fresh tissue to mounted sections (Marcos et al. 2004). Shrinkage is also noticeable in frozen liver, despite being less pronounced: the nuclear area of guinea-pig hepatocytes in cryostat sections was 16% larger when comparing with paraffin (Baak et al. 1989). Because cells appear closer to each other, shrinkage also influences number estimations (viz. the numerical density). In all these cases, shrinkage must be measured in order to correct final estimations. A simple way to do this is to photograph a liver fragment before fixation and processing and after sectioning and mounting; a comparison of the fragment area in the two images estimates the shrinkage in 2D (Mouton, 2002), which can then be used to correct 3D estimates. Compression in the z-axis is an issue in thick sections and in these cases the device used to measure thickness, usually a precision length gauge (microcator), should be periodically calibrated to ensure accurate measurements (Guillery, 2002); this is often overlooked.
Unambiguous cell identification is essential for all stereological estimations: if only a fraction of cells are identified and counted/measured the estimation will not (or only by chance) represent the whole cell population. In the liver this is of particular importance because the routine haematoxylin–eosin staining does not allow a reproducibly accurate identification of some cells – like virtually all hepatic stellate cells and some Kupffer cells (Malarkey et al. 2005). In this vein, the need for special tagging procedures like immunohistochemistry will have to be weighed: if most antibodies work equally well in cryostat and paraffin sections, they do not in methacrylate sections (in this case, a special glycol methacrylate for immunohistochemistry will have to be considered).
Volume
With the liver tiers in mind, various volumes can be estimated: whole liver volume (V), the volume density of each structural component (VV) and the local volumes, which include the number-weighted volume ( ) and the volume-weighted volume (
 ) of any structurally definable ‘particles’, such as the nucleus or the cell.
In hepatology, the V (liver) is often required in animal experimentation, namely for assessing hepatomegaly in toxicological studies in animals (Carthew et al. 1996) and in clinical medicine in humans, as an indicator of therapeutic effectiveness or in the evaluation and prognosis of liver cirrhosis (Sahin et al. 2003). In addition, this estimation is crucial in liver transplantation, especially with living donors, as the volume of the graft and of the remaining liver have to be (ideally) precisely estimated preoperatively to avoid postoperative complications (Duran et al. 2007). In humans, accurate information about the liver volume can neither be obtained by routine physical examination nor from biopsy material (Presently, three methods exist for this estimation (Fig. 3): first, direct fluid displacement; second, Scherle's method; and third, Cavalieri's principle, which is most often associated with point-counting and can be applied to microscopical or radiological images. The fluid displacement approach is based on Archimedes’ principle, in which the whole organ is immersed in a suitable liquid and the displaced fluid volume is directly measured in a graduated cylinder. It is more suitable for small livers, such as the rat (Altunkaynak & Özbek, 2009), tending to be less practical and precise in large organs that do not fit well in a graduated cylinder or beaker (Sahin et al. 2003); it should be noted that the sensitivity of the estimation depends directly on how finely the container is calibrated (Mouton, 2002). The second method is a modification introduced by Scherle (1970) over 40 years ago. It has been used in mouse (Karbalay-Doust & Noorafshan, 2009) and rat liver (Aguila et al. 2003; Souza-Mello et al. 2007; Valenca et al. 2008; Halici et al. 2009a,b). In the Scherle's method the organ is also fully immersed in fluid (of known density), but now suspended by a thin thread (care must be taken so that the liver does not touch the side or bottom of the container) – because the density of the used fluid is typically 1 (e.g. for the common isotonic saline, 0.90% w/v of NaCl, the density is 1.0048), in practical terms the V corresponds to the weight increase after immersion (Scherle, 1970; Mandarim-de-Lacerda, 2003). It is more precise than water displacement, being recommended for larger organs (Mandarim-de-Lacerda, 2003; Howard & Reed, 2005). The most used technique nowadays is that of Cavalieri. This method was developed in the 17th century by the mathematician Bonaventura Cavalieri (1598–1647). Its implementation requires that the whole organ must be cut from end to end in a series of parallel planes distanced by (T); to avoid bias, the first section must be uniform random in an interval 0–T. The areas of the cut surfaces are typically estimated by a point grid (but other type of measurements, even automated, can be used), that has a known area associated with each point (a/p). By counting the number of points (P) falling on the liver surface in every section, the V is then calculated as:
Fig. 3.
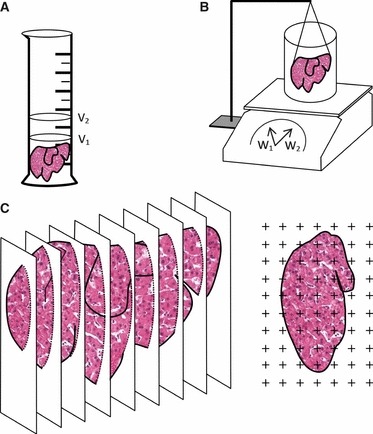
Methods to estimate total volume (V) of liver. (a) Fluid displacement, in which the liver is immersed in graduated cylinder and V = V2 − V1 (corresponding, respectively, to the volume after and before immersion). (b) The Scherle's method consists of a container with isotonic saline, placed on a precision weighing balance. The liver is fully immersed but suspended by a thin thread and V = (W2 − W1)/σ, in which W2 and W1 correspond to the weight after immersion and weight of the container with water, respectively, and σ is the specific gravity of isotonic saline; as σ = 1.0048, in practice V ≍ W2 − W1. (c) In Cavalieri point-counting the whole organ must be cut from end to end in a series of parallel planes constantly distanced by (T); to avoid bias, the first section must be uniform random in an interval 0–T. A point grid is used, with an area associated with each point (a/p). By counting the number of points (P), the areas of the cut surfaces (Σareas) are determined, and finally V is estimated as V = T × a/p × ΣP.
In practical terms, only a few hundred points (about 200) on 10–15 sections need to be counted per organ, in order to get an acceptable CE about 5–10% (Howard & Reed, 2005). It should be stressed that point-counting is actually a very fast process. In mouse and rat, the liver is easily embeddable, but in the case of large organs other strategies exist: first, it can be embedded in agar, sectioned and the Cavalieri directly applied to the slices – this is a common approach in brain studies (Mouton, 2002); second, the liver can be trimmed and then sampled into a small known organ fraction, using the fractionator (Gundersen, 1986), embedded in plastic resin (methacrylate) or in paraffin and the Cavalieri point-counting applied to microscopical images – this so-called ‘volumetric fractionator’ was originally developed for the lung (Geiser et al. 1990), but was applied recently in the liver (Altunkaynak & Özbek, 2009); third, quantitative radiology may be used (Roberts et al. 2000). In the latter method, virtual ‘slices’ are produced by computer tomography (Sahin et al. 2003; Mazonakis et al. 2004; Aydinli et al. 2006; Duran et al. 2007) or magnetic resonance (Sahin & Ergur, 2006), and point-counting is then straightforward. In the liver, the three methodologies produced similar and correlated results (Sahin et al. 2003; Altunkaynak & Özbek, 2009), although it may be argued that fluid displacement and Scherle's method are simpler and have the advantage of generating estimations closest to the in vivo reality, when compared with the Cavalieri point-counting after embedding and cutting (which generates estimations closer to the final dimensions of the tissue). Nevertheless, this issue may be obviated with radiology images, in which the Cavalieri point-counting estimates the volume of a fully blood-perfused organ (Duran et al. 2007). The Cavalieri point-counting has one interesting advantage of allowing the estimation of subcomponent volumes – for example, volume of the parenchyma and sinusoids (Howard & Reed, 2005; Altunkaynak & Özbek, 2009) – whereas it may not require much additional effort when integrated into the sampling scheme for light microscopy (Marcos et al. 2003; Howard & Reed, 2005).
The volume density (also named relative volume or volume fraction) is a ratio between volumes – for instance, the VV (hepatocytes, liver) stands for the volume occupied by hepatocytes in the whole liver. This is an intuitive parameter, unbiasedly estimated by overlaying a test-system of points (Fig. 4) and then counting those falling over the hepatocytes and those over the reference space (the whole liver in this case). The ratio of points (P), gives the estimation of volume:
Fig. 4.
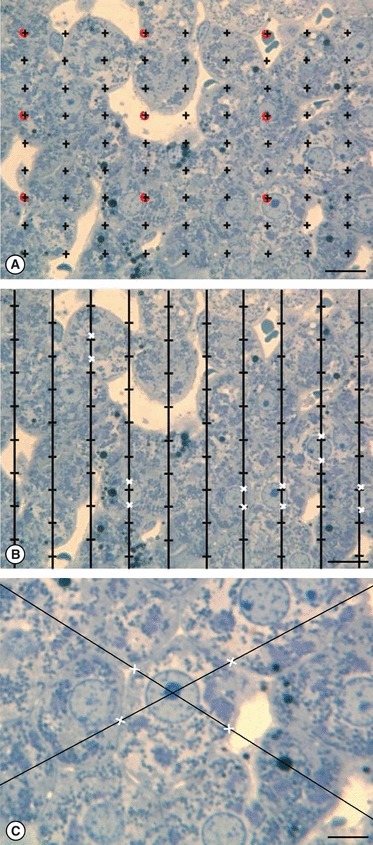
(a) The relative volume of VV (hepatocytes, liver) is estimated by counting those points falling on hepatocytes and those in the reference space (the whole liver in this case). In order to avoid counting an excessive number of points, two different point densities can be used: the sparser points (here in red) quantify larger structures. The VV (hepatocytes, liver) = P (hepatocytes)/[P (liver) × κ], in which κ is a constant, representing the number of denser points ‘controlled’ by the sparser ones (here κ = 9). (b) Estimation of the volume weighted mean nuclear  according to the PSI. The nuclei are sampled according to their volume, by overlaying a grid of points at random and for each nucleus hit by a point, the distance between both ends of the nuclei (white crosses) are measured. (c) Nucleator method for estimating number weighted mean cell volume (
 ) of hepatocytes. After applying the disector to sample cells and selecting their nucleolus (when visible) the stereological system generates two lines passing through it; the operator then marks the intersections between the lines and cell borders. The average distance from the intersections to the nucleolus is used to estimate the (
 ). Scale bars: 9 μm (a, b); 5 μm (c).
According to the Delesse's principle – dating from 1843, but only used in the biology field from 1963 on (Mouton, 2002) – the volume fraction of an object also varies proportionally to their area fraction as measured in random 2D sections or planes, thus meaning that VV (hepatocytes, liver) = AA (hepatocytes, liver) = PP (hepatocytes, liver). In other words, this means that each point controls an area in a 2D liver section and is related to a defined volume in the 3D organ (Howard & Reed, 2005). The volume fraction is one of the oldest of the stereological parameters, and virtually every liver structure has already been point-counted, either in optical and/or electron microscopy. Some of the generated data for normal hepatocytes in mammals are summarized in Table 1. Regarding other liver cells, data are scarce: the relative volume of sinusoidal endothelial cells, Kupffer and hepatic stellate cells has been estimated as 2.8, 2.0 and 1.4%, respectively (Blouin et al. 1977). It is noteworthy that in recent years point-counting (incorporated or not in image analysis software) has been also used in pathological conditions, namely for evaluating the degree of cirrhosis (Vizzotto et al. 2002; Vertemati et al. 2004), the outcome of liver transplants (Vertemati et al. 2005), the diagnosis of hepatocellular carcinoma (Vertemati et al. 2008), and for assessing the degree of hepatic steatosis (Catta-Preta et al. 2011).
Table 1.
Compilation of some stereological data (mean values) of hepatocytes, using model- and design-based stereology.
| Reference | Species | Embedding medium | Methods | VV (HEP, liver) |
 (μm3) (μm3) |
N (×108) | NV (HEP/mm3) (×103) |
|---|---|---|---|---|---|---|---|
| Karbalay-Doust & Noorafshan (2009) | Mouse (balb-c), females, 31.8 g BW | Paraffin | Sc, O, PC, OD, RT, N′ | 70.9 | 5300 | 5.30 | |
| Odaci et al. (2009) | Rat (Wistar), males, 200–210 g BW | Paraffin | OD, F | 1.58 | 266 | ||
| Altunkaynak & Özbek (2009) | Rat (Sprague–Dawley), females, 150–200 g BW | Paraffin | FD, Cv, PC, PD, RT | 67.2 | 18.1 (MnHEP) 2.3 (BnHEP) | 181 (MnHEP) 24 (BnHEP) | |
| Souza-Mello et al. (2007) | Rat (Wistar), females/males, 230/359 g BW | Paraffin | Sc, PD | 7.28 (males) 5.16 (females) | |||
| Marcos et al. (2006) | Rat (Wistar), males, 336 g BW | Paraffin | OD, F | 14.1 (MnHEP) 5.2 (BnHEP) | 141 (MnHEP) 49 (BnHEP) | ||
| Burity et al. (2004) | Primates species Leontopithecus (φ) | Paraffin | PC, OD | 90.1-94.9 | 489-521 | ||
| Carthew et al. (1998) | Rat (F344), males, 150–160 g BW | Paraffin | PC, OD | 24.3 | 370 | ||
| Jack et al. (1990) | Rat (Tif:RAIf), females | Epon | PD, N′ | 4740 (MnHEP) 6930 (BnHEP) | |||
| Weibel et al. (1969) | Rat (Wistar), males, 174 g BW | Epon | PC, MBM | 83.7 | 4940 | 9.88 | 169 |
| Rohr et al. (1976) | Humans (biopsies), males/females | Epon | PC, MBM | 79.3 | 11305 | 102 |
BW, body weight; Cv, Cavalieri; FD, fluid displacement; F, fractionator; HEP, hepatocytes (MnHEP, mononucleated; BnHEP, binucleated); MBM, model-based methods;  , number-weighted nuclear volume; NV, numerical density; N′, nucleator; O, orientator; OD, optical disector; PD, physical disector; PC, point-counting; RT, ratio-technique; Sc, Scherle's method; N, total number; VV, volume density; (Φ) L. rosalia, L. chrysomelas and L. chrysopygus.
Point-counting can be used jointly at different resolution levels, such as at light and electron microscopy. For instance, the volume fraction of the hepatocytes in the parenchyma is determined by the former, and the volume fraction of mitochondria in hepatocytes determined by the latter (Blouin et al. 1977). When determining the volume fraction of rare or small structures, a grid with at least two sets of points with different densities is recommended. Volume fraction estimations are granted unbiasedness if some conditions are met: first, the objects (cells or organelles) must be cut at random, following a randomized sampling design; second, over-projection has to be negligible – this occurs when the section thickness is less than 1/10th of the height of the particle being studied (Weibel & Paumagartner, 1978). A third potential pitfall is the differential deformation, i.e. uneven shrinkage throughout the organ due to processing (Dorph-Petersen et al. 2001); however, in contrast with the lung (Ochs, 2006), this is not considered relevant in the liver, as it is a highly cellular organ, with (more or less) densely packed liver cells. This does not mean that differences in the volume ratios do not occur due to processing – as already mentioned, the volume fraction of sinusoids is lower in organs fixed by perfusion than those fixed by immersion (Blouin et al. 1977).
Volume estimations also include the so-called local volumes, applied to cells or more typically to their nuclei – i.e. the volume-weighted nuclear volume ( ) and the number-weighted nuclear volume (
 ). The
  is not an intuitive parameter as it involves sampling the particle – for example the nucleus – in proportion to their volume, therefore traducing the nuclear size variation and pleomorphism (Sørensen, 1992). It is mostly used in histopathology, as the parameter quantitatively grades malignancy, which correlates with prognosis in different neoplasms (Binder et al. 1992; Sørensen, 1992; Fujikawa et al. 1995; Ladekarl, 1998; Yörükoglu et al. 1998). The nuclear
  of hepatocytes was determined only once in preneoplastic lesions in the rat (Jack et al. 1989), but this parameter may be useful for differentiating regenerative nodules from well-differentiated hepatocarcinomas.
The unbiased estimation of the nuclear  is based on measurements of point-sampled intercepts (PSI) in isotropic uniform random oriented sections (Gundersen & Jensen, 1985). The PSI method is a two-step procedure that involves: first, sampling the particles (cells or nuclei) according to their volume, by overlaying a grid of points at random; second, for each particle hit by a point, a line is drawn from the point to the particle border, in an isotropic direction (i.e. all directions to the border are possible and equally probable); third, a second line is drawn in the opposite direction and both distances are measured using a rule, using a linear or a non-linear scale (Fig. 4). The
  is then derived by applying the next formula:
The procedure is tedious and time consuming if done manually – nowadays most studies use stereological packages (newCast, Stereo Investigator, Stereologer, etc.). In the liver, the PSI was applied only to hepatocytes and lead to a mean estimation of 5390 and 8280 μm3 in mono- and binucleated rat hepatocytes, respectively (Jack et al. 1989). In theory, to apply the PSI an isotropic or vertical uniform random design must be followed (Howard & Reed, 2005), as recently Karbalay-Doust & Noorafshan (2009) did, by using the orientator. However, for practical purposes the liver can be considered not oriented, in the sense that it is not possible to infer the orientation of a section by observing its histological appearance, because liver cells are randomly oriented, following all possible directions in 3D (Mandarim-de-Lacerda, 2003). Moreover, hepatocyte nuclei are quite roundish, and virtually isotropic in 3D, meaning they have practically the same structural properties irrespective of orientation. Therefore, for most practical purposes, if liver biopsies are cut at random and thin sections are used, the PSI can be applied straightforwardly to all liver cells (Mouton, 2002).
The number-weighted mean volume ( ) can be related to the
  by the formula:
This means that  is always higher or, at least, similar to the
  , namely when the
  is small – in other words, when the cell volume is homogeneous, having low anisocytosis or anisokaryosis, the
  . To estimate the
  several direct and indirect approaches exist, and the so-called direct methods include: first, the selector; second, the nucleator; and third, the rotator. These methods are actually ordered by their efficiency and chronological appearance (Nyengaard, 1999). The selector (Cruz-Orive, 1987) is more laborious and uses a random point inside the cell, whereas the nucleator (Gundersen, 1988) uses a fixed point, like the nucleolus. So far, only the latter has been used in the liver (Table 1). Although it was originally designed for mononucleated cells (Gundersen, 1988), the nucleator can also be used for binucleated hepatocytes; the sole adaptation is that the first nucleus with the first nucleolus that appears in focus is considered for the measurements (Jack et al. 1989). Like the PSI, the nucleator is also a two-step procedure (Fig. 4), but it does not require a grid of points to sample whatever targeted cells or particles – instead, these are sampled by either the optical or the physical disector, both of which sample cells in proportion to their number. Afterwards, one or two isotropic lines are drawn from the nucleolus to the nuclear or cellular border. The rotator (Jensen & Gundersen, 1993) can also be applied either to isotropic or vertical uniform random sections. In this case, the vertical axis of the particle is first defined, and then a grid of three or four lines is oriented perpendicularly to that axis, and the distances between these lines and the nuclear or cellular borders are measured. It is often viewed as the most efficient method, because in each sampled particle six or more measurements can be recorded (Mouton, 2002; Tandrup, 2004). In either case, the mean distance (from the nucleolus or from the vertical axis) to the particle border, from a series of measurements, is used for estimating the number-weighted mean volume (
 ):
):
It must be stressed that for estimating the local volumes ( and
and  ) the borders must be unambiguously recognized. This is easy with nuclei, but problems may exist with the cell borders; in hepatocytes, these can be sometimes sufficiently well recognized in semi-thin epoxy sections (used in the PSI and physical disector), but definitely not in routinely haematoxylin–eosin-stained thick sections (used in the optical disector). In that case, an immunohistochemistry staining against e-cadherin (our own unpublished observations) or carcinoembryonic antigen would be recommended (Marcos et al. 2003, 2006). Note that if paraffin is used, shrinkage effects must be accounted for and corrected at the end. If a plastic resin is used for optical sections, the need for immunotagging remains, and so a special methacrylate (e.g. Technovit 1900, Heraeus-Kulzer) must be used. In Kupffer cells and hepatic stellate cells recognition of cell borders is also difficult, because cells are highly irregular. To overcome this problem, it would be preferable to embed liver fragments in suitable methacrylate-based resins and perform immunohistochemistry with antibodies.
Another approach for estimating  exists, being called indirect because it results from the ratio of two other estimations:
  where VV and NV are obtained by point-counting, and by the disector, respectively. In this case, care must be taken to avoid bias from overprojection and shrinkage. This is especially true if different types of embedding media and sections are used for the two estimations. For example, if the VV would be determined in epoxy and the NV in paraffin sections, the shrinkage would have to be estimated; namely to correct the NV. Alternatively, if epoxy sections are used for both estimations, the shrinkage influence would be cancelled in the formula. Finally, if both the VV and the NV were estimated in paraffin sections, and even assuming homogenous shrinkage, the NV would have to be corrected again for retraction, as the NV would always be overestimated. Note also that if estimated in paraffin the VV of a cell/nucleus is prone to over-projection effects.
Number
In many fields of hepatology, it is common to find the number of cells reported as ‘number per mm2’ or ‘number per high-power field’. These are actually cell profile numbers that do not provide a meaningful estimate of real number, because all cells will not have the same probability of being counted (Boyce et al. 2010). Truly, this fact has been recognized for almost a century – in a single section, cells will be counted in proportion to their size, shape, orientation and spatial distribution, in addition to their number; therefore, larger cells, irregular or those normal to the section plane will be more often counted (Mouton, 2002). This also occurs in the liver: hepatic stellate cells and Kupffer cells are particularly known for their irregularity, but size heterogeneity has been reported for almost all liver cells (Malarkey et al. 2005). In this vein, a precise and accurate estimation of cell number must call for the new generation of stereological methods, as introduced in the past 25 years (Boyce et al. 2010).
The quantification of liver cells is important in different scenarios. The N of hepatocytes, for instance, is relevant in toxicological studies in rodents, to discern whether hepatomegaly is due to hypertrophy or hyperplasia (Carthew et al. 1998), as well as in hepatocarcinogenesis studies in rodents (Bannasch, 1976) and humans (Kondo et al. 1988). Like in volume estimation, the use of stereology tools can generate absolute and relative parameters – i.e. total number (N) and relative number or numerical density (NV), respectively. The latter refers to the number of cells per unit of volume and is directly estimated by the disector (Sterio, 1984). This method was first introduced in neurosciences, but soon found applications in many other organs (Mayhew & Gundersen, 1996). Some estimations of the N and NV of hepatocytes are presented in Table 1.
The disector can be viewed as a 3D counting box with inclusion and exclusion surfaces, in order to count cells as they appear in the probe. Instead of simply counting cell profiles (subjected to all the above cited inherent biases), this box enables counting cells in proportion to their real number. In this box, we can either analyse its full interior, in the case of the optical disector, or the analysis can be restricted to the top and bottom of the box, with the middle part deduced, in the case of the physical disector (Fig. 5). The latter was the first to be described (Sterio, 1984) and has been applied in liver, both to count hepatocytes (Carthew et al. 1998; Aguila et al. 2003; Souza-Mello et al. 2007; Valenca et al. 2008; Altunkaynak & Özbek, 2009) and hepatic stellate cells (Marcos & Rocha, 2001). It consists of two thin sections separated by a fixed height (h), which is recommended to be a third to a quarter of the height of the particles to be counted (Nyengaard, 1999) – in the liver, it has varied from 2 μm in hepatic stellate cell counting (Marcos & Rocha, 2001) to 3–5 μm height for hepatocytes (Carthew et al. 1998; Aguila et al. 2003; Souza-Mello et al. 2007; Valenca et al. 2008; Altunkaynak & Özbek, 2009). This h is critical: first, if it is too large the smallest cells to be counted can be missed inbetween sections (in the deduced middle part of the box), and the necessary alignment of the two sections/planes will be difficult; second, if it is too small, only a few or no cells will be counted, and the process will be inefficient. Our own experiences with physical disectors confirm those difficulties and the need to optimally adjust the h (Marcos & Rocha, 2001; Rocha et al. 2001).
Fig. 5.
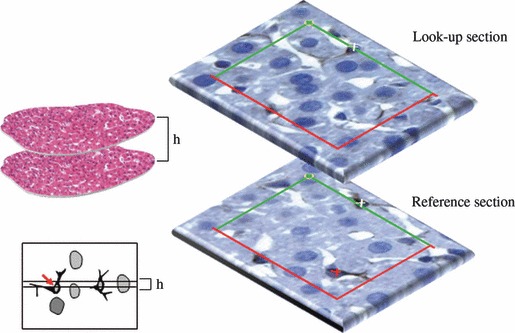
The physical disector uses two thin sections, perfectly aligned and distanced by h (height of the disector). Then a counting grid is used (with exclusion and inclusion lines in red and green, respectively); here the procedure is illustrated for counting hepatic stellate cells marked with immunohistochemistry against glial fibrillary acidic protein. A cell is counted (here marked with a red cross) if present in the reference section but not in the lookup section.
In the physical disector, a cell is counted if present in the reference section but not in the lookup section. In order to avoid edge effects, an unbiased counting frame is used, with inclusion and exclusion lines (Gundersen, 1977), and the counting procedure is actually easy. However, aligning the liver sections can be a limiting step: due to the high cellularity and tortuous sinusoids, in our experience it tends to be time-consuming, particularly in paraffin sections. This may be partially overcome by using recent stereology workstations that integrate digital image recognition software for allowing a kind of ‘auto-alignment’ or by using the optical disector probe.
In contrast to the physical disector, its counterpart optical method uses thick sections (Fig. 6), which are most often observed with oil-immersion objectives that ideally should have the highest possible numerical-apertures, so that a thin focal plane actually scans the entire counting box. Naturally, the thinnest optical planes (matching the z-resolution) are obtained using a confocal microscope (Lemmens et al. 2010). Whatever the microscopy strategy, a built-in solution or additional equipment is needed, for instance a length gauge (microcator), to exactly determine the z-distance between up and down planes of the disector (Howard & Reed, 2005). Anyway, the optical disector method is much faster than its physical form; in the liver, it has been used to count hepatocytes (Marcos et al. 2006; Neves et al. 2006; Halici et al. 2009a,b; Karbalay-Doust & Noorafshan, 2009; Odaci et al. 2009; Unal et al. 2011), hepatic stellate cells (Marcos et al. 2004) and Kupffer cells (Santos et al. 2009). In all these, paraffin thick sections were used and their thickness ranged from 15 μm (Karbalay-Doust & Noorafshan, 2009) to 40 μm (Odaci et al. 2009; Unal et al. 2011), whereas the optical disector height varied from 5 μm (Karbalay-Doust & Noorafshan, 2009) to 20 μm (Marcos et al. 2004, 2006; Santos et al. 2009).
Fig. 6.
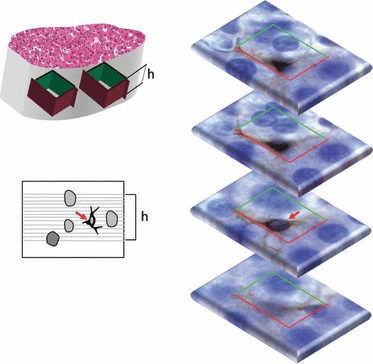
The optical disector uses thick sections, which are optically scanned. The procedure is illustrated for counting hepatic stellate cells marked with immunohistochemistry against glial fibrillary acidic protein: a cell is counted (here marked with a red arrow) as it appears in focus within the disector height (h) and is within or touches the inclusion lines (green) but not the exclusion ones (red).
The optical disector has been considered the standard of efficient unbiased number estimation for the past two decades, but over the years potential pitfalls in the method have been debated (Dorph-Petersen et al. 2001; Von Bartheld, 2002; Geuna, 2005; Baryshnikova et al. 2006). An issue that should be addressed is so-called z-axis compression: as a rule of thumb, the section thickness should be measured in every fifth field of vision, and the intra- and intersectional coefficient of variation (CV) calculated (Dorph-Petersen et al. 2001). In our experience with thick liver sections, this variation is low, but if large variations occur the thickness should be measured frequently and a stratified fractionator (with larger disector heights in the thicker areas) should be considered (Dorph-Petersen et al. 2001).
Another potential pitfall refers to the loss of nuclear fragments dragged by the knife during sectioning – the so-called lost caps (Mayhew & Gundersen, 1996). In paraffin thin sections, it has been shown to affect up to one-third of the sectioned nuclei (Helander, 1983). To cope with this, guard spaces in the upper and lower surfaces of the thick sections have been recommended ever since the beginning of the method, thus restricting the analysis to the central core of the thick section (Gundersen, 1986). In the liver, all studies have included minimal guard spaces of 4–5 μm, but their use is nowadays controversial because it may produce a 10% underestimation of particles, at least in the nervous tissue (Gardella et al. 2003; Baryshnikova et al. 2006). Indeed, it has been shown that particles appear to move along the z-axis as they are sectioned and stained, thus generating a bimodal distribution of particles – i.e. particles are more abundant in the upper and lower surfaces of the thick sections, inducing a central core depletion (Hatton & Von Bartheld, 1999; Von Bartheld, 2002; Baryshnikova et al. 2006). This distribution affects mainly paraffin and methacrylate sections, and is influenced by delayed fixation, tissue processing and even knife-cutting angles – which is considered the most relevant factor (Baryshnikova et al. 2006). Because it is uncertain whether the bimodal distribution occurs in all tissues, a general recommendation is to check before starting every new experiment, by recording the z-axis position of 250–350 particles in different sections (Baryshnikova et al. 2006). This procedure is also useful to assess if the staining (specially in immunohistochemistry slides) encompasses the entire tissue thickness, thus ensuring that all existing cells can be recognized and counted with the optical disector – this is a fundamental prerequisite of the method. In the case of the liver, such a bimodal distribution was not observed when counting hepatocytes nuclei in our in-house trials with paraffin sections of rat liver (Fig. 7).
Fig. 7.
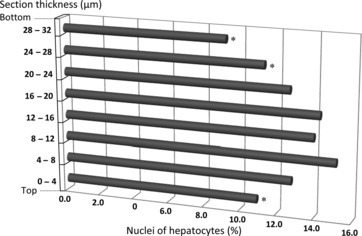
Distribution of the nuclei of hepatocytes along the z-axis in thick paraffin sections of rat liver. Taking into account that the average thickness was 32 μm, we considered eight bins of 4 μm. The values were obtained after counting 1500 nuclei, and determining the percentage of nuclei for each bin. Note that the shallow (0–4 μm) and deeper parts (24–28 μm; 28–32 μm) of the section exhibited less nuclei; this was statistically significant (chi-square test); *P < 0.05.
It is noteworthy that the disector directly provides relative numbers (NV), which are strongly influenced by the embedding medium, namely by paraffin shrinkage (Mouton, 2002). When using paraffin or cryostat sections for the disector, the obtained figures are necessarily overestimations that should be corrected for the shrinkage to be directly meaningful in 3D (Marcos et al. 2006) – only estimations in glycolmethacrylate or in epoxy resin will tend to greatly approach and practically match the real values.
For obtaining total cell numbers (N), two unbiased approaches are available (Fig. 8): the fraction-based optical fractionator (West et al. 1991); and the volume-based ratio-technique (Pakkenberg & Gundersen, 1988). The latter is a two-step analysis, as it results from the product of the NV and the respective reference volume (V), which is usually the whole organ (N = NV × V). This strategy has been used in the liver to estimate the number of hepatocytes, for example when the effects of different types of diet in the rat were evaluated (Souza-Mello et al. 2007; Altunkaynak & Özbek, 2009). However, the ratio-technique may be influenced by eventual volume-related deformations during processing, and it may produce biases when the NV and V cannot be measured in the same sections (Dorph-Petersen et al. 2001). Additionally, it is generally more time consuming than the optical fractionator (Tandrup, 2004) and, according to computer simulations, the existing methods to predict the CE of N do not seem to generate adequate predictions (Schmitz & Hof, 2000). Nevertheless, the ratio-technique is valuable in many occasions, namely in studies combining light and electron microscopy, and when it is unpractical to section the entire organ (Howard & Reed, 2005); in these cases, the V is estimated by one of the methods discussed previously (Fig. 3).
Fig. 8.
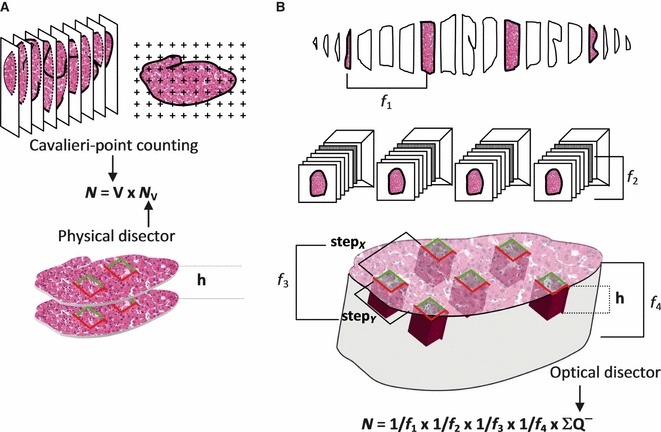
Strategies to determine the total number (N). (a) Ratio-technique, here exemplified by Cavalieri point-counting and the physical disector. (b) Optical fractionator, in which a fraction of liver fragments is sampled (f1); the paraffin blocks are exhaustively sectioned (thick sections) and a fraction of these are sampled (f2). Sections are analysed and the stage performs step movements in x, y, so that a fraction of the area is sampled (f3). Finally, in the optical disector, only a fraction (f4) of the tissue thickness is analysed (f4 = h/section thickness). In this latter procedure, all the cells are counted (∑Q−).
In contrast to this, the optical fractionator estimates N in a more direct and consequently more efficient way (West et al. 1991). It selects cells based on their existence, as it combines the optical disector (Gundersen, 1986), which samples cells in proportion to their number, with the fractionator principle (Gundersen, 1986). A modification of this sampling technique is called the smooth fractionator (Gundersen, 2002), discussed previously (Fig. 2). So far, the optical fractionator has been used not only to estimate the N of hepatocytes (Marcos et al. 2006; Odaci et al. 2009; Table 1), but also of hepatic stellate cells (Marcos et al. 2004) and of Kupffer cells (Santos et al. 2009). Additionally, it has been estimated that these three cell types account for 59.7, 6.4 and 8.9% of all the cells of liver, respectively (Santos et al. 2009).
It is opportune to inform that there is also the possibility to use physical disectors (instead of optical ones) combined with the fractionator, resulting in the physical fractionator. To our knowledge, there is yet no published paper with this approach on liver. Usually the method is much more laborious than the optical fractionator, but there are strategies that can greatly help its routine use whenever needed, such as that advanced by Ciavarro et al. (2003) with so-called densitometric physical fractionator, or the recently patented advance introduced in one leading stereological package, entitled AutoDisector™, which is an automated physical disector (newCast, by Visiopharm). The physical disector, despite being more laborious, can circumvent some of the caveats of the optical disector form, as the sensitivity to section shrinkage, or the difficulty in applying a good immunohistochemical protocol.
Concluding remarks
In the last decade, the most updated design-based stereological tools have begun to be applied to the study of the liver of mammals. Apart from the new theoretically unbiased data in normal conditions, at least for the rat model (Marcos et al. 2004, 2006; Santos et al. 2009), these tools already enabled detailed experimental studies of the effects of different substances (Valenca et al. 2008; Halici et al. 2009a,b; Karbalay-Doust & Noorafshan, 2009; Odaci et al. 2009), postmenopausal and diabetes mellitus (Unal et al. 2011), and also of specific diets (Aguila et al. 2003; Souza-Mello et al. 2007; Altunkaynak & Özbek, 2009) for selected hepatic cells. In addition, it was shown recently that quantification by stereological methods is consistently more precise and reproducible than the manual assessment of grades of steatosis in liver biopsies (Catta-Preta et al. 2011). Following the overall trend of neurosciences, where the standard is now the use of proper stereological tools for quantitative estimation of the size and number of cells, it is hoped that the next years will witness a wide use of design-based stereology by hepatologists, helping to properly solve many existing questions, like the variation of cell populations in the aging liver or the fine kinetics of proliferation of activated hepatic stellate cells in hepatic fibrosis. Moreover, these methods may be useful when evaluating pharmacotherapeutic agents in clinical trials.
Acknowledgments
This work was financially supported by FEDER funds through the Competitiveness and Trade Expansion Program (COMPETE), and by National Funds provided by Fundação para a Ciência e a Tecnologia (FCT), via a doctoral grant with reference SFRH/BD/38958/2007 (attributed to Ricardo Marcos).
References
- Aguila MB, Pinheiro AR, Parente LB, et al. Dietary effect of different high-fat diet on rat liver stereology. Liver Int. 2003;23:363–370. doi: 10.1034/j.1478-3231.2003.00858.x. [DOI] [PubMed] [Google Scholar]
- Altunkaynak BZ, Özbek E. Overweight and structural alterations of the liver in female rats fed a high-fat diet: a stereological and histological study. Turk J Gastroenterol. 2009;20:93–103. [PubMed] [Google Scholar]
- Aydinli B, Kantarci M, Polat KY, et al. Stereological evaluation of treatment response in patients with non-resectable hepatic alveolar echinococcosis using computed tomography via the Cavalieri method. Liver Int. 2006;26:1234–1240. doi: 10.1111/j.1478-3231.2006.01363.x. [DOI] [PubMed] [Google Scholar]
- Baak JPA, Noteboom E, Kovoets JJM. The influence of fixatives and other variations in tissue processing on nuclear morphometrics features. Anal Quant Cytol Histol. 1989;11:219–224. [PubMed] [Google Scholar]
- Bannasch P. Cytology and cytogenesis of neoplastic (hyperplastic) hepatic nodules. Cancer Res. 1976;36:2555–2562. [PubMed] [Google Scholar]
- Baryshnikova LM, Halbach O, Kaplan S, et al. Two distinct events, section compression and loss of particles (“lost caps”), contribute to z-axis distortion and bias in optical dissector counting. Microsc Res Tech. 2006;69:738–756. doi: 10.1002/jemt.20345. [DOI] [PubMed] [Google Scholar]
- Binder M, Dolezal I, Wolff K, et al. Stereologic estimation of volume weighted mean nuclear volume as a predictor of prognosis in “thin” malignant melanoma. J Invest Dermatol. 1992;99:180–183. doi: 10.1111/1523-1747.ep12616803. [DOI] [PubMed] [Google Scholar]
- Blouin A, Bolender RP, Weibel ER. Distribution of organelles and membranes between hepatocytes and nonhepatocytes in rat liver parenchyma – a stereological study. J Cell Biol. 1977;72:441–455. doi: 10.1083/jcb.72.2.441. [DOI] [PMC free article] [PubMed] [Google Scholar]
- Boyce RW, Dorph-Petersen KA, Lyck L, et al. Design-based stereology: introduction to basic concepts and practical approaches for estimating cell number. Toxicol Pathol. 2010;38:1011–1025. doi: 10.1177/0192623310385140. [DOI] [PubMed] [Google Scholar]
- Burity CHF, Pissinatti A, Mandarim-de-Lacerda CA. Stereology of the liver of three species of Leontopithecus (Lesson, 1840) Callitrichidae – Primates. Anat Histol Embryol. 2004;33:183–187. doi: 10.1111/j.1439-0264.2004.00533.x. [DOI] [PubMed] [Google Scholar]
- Carthew P, Maronpot RR, Foley JF, et al. Method for determining whether the number of hepatocytes in rat liver is increased after treatment with peroxisome proliferator Gembrozil. J Appl Toxicol. 1996;17:47–51. doi: 10.1002/(sici)1099-1263(199701)17:1<47::aid-jat389>3.0.co;2-4. [DOI] [PubMed] [Google Scholar]
- Carthew P, Edwards RE, Nolan BM. New approaches to the quantitation of hypertrophy and hyperplasia in hepatomegaly. Toxicol Lett. 1998;102–103:411–415. doi: 10.1016/s0378-4274(98)00246-x. [DOI] [PubMed] [Google Scholar]
- Catta-Preta M, Mendonca LS, Fraulob-Aquino J, et al. A critical analysis of three quantitative methods of assessment of hepatic steatosis in liver biopsies. Virchows Arch. 2011;459:477–485. doi: 10.1007/s00428-011-1147-1. [DOI] [PubMed] [Google Scholar]
- Ciavarro GL, Calvaresi N, Botturi A, et al. The densitometric physical fractionator for counting neuronal populations: application to a mouse model of familial amyotrophic lateral sclerosis. Neurosci Methods. 2003;129:61–71. doi: 10.1016/s0165-0270(03)00201-2. [DOI] [PubMed] [Google Scholar]
- Cruz-Orive LM. Particle number can be estimated using a disector of unknown thickness: the selector. J Microsc. 1987;12:1–142. [PubMed] [Google Scholar]
- Dahab GM, Kheriza MM, El-Beltagi HM, et al. Digital quantification of fibrosis in liver biopsy sections: description of a new method by Photoshop software. J Gastroenterol Hepatol. 2004;19:78–85. doi: 10.1111/j.1440-1746.2004.03183.x. [DOI] [PubMed] [Google Scholar]
- Deng M, Kleinert R, Huang H, et al. Statistical and economical efficiency in assessment of liver regeneration using defined sample size and selection in combination with a fully automated image analysis system. J Histochem Cytochem. 2009;57:1075–1085. doi: 10.1369/jhc.2009.953869. [DOI] [PMC free article] [PubMed] [Google Scholar]
- Dorph-Petersen KA, Nyengaard JR, Gundersen HJ. Tissue shrinkage and unbiased stereological estimation of particle number and size. J Microsc. 2001;204:232–246. doi: 10.1046/j.1365-2818.2001.00958.x. [DOI] [PubMed] [Google Scholar]
- Duran C, Aydinli B, Tokat Y, et al. Stereological evaluation of liver volume in living donor liver transplantation using MDCT via the Cavalieri method. Liver Transpl. 2007;13:693–698. doi: 10.1002/lt.21132. [DOI] [PubMed] [Google Scholar]
- Fujikawa K, Sasaki M, Aoyama T, et al. Prognostic criteria in patients with prostate cancer: correlation with volume weighted mean nuclear volume. J Urol. 1995;154:2123–2137. [PubMed] [Google Scholar]
- Gardella D, Hatton WJ, Rind HB, et al. Differential tissue shrinkage and compression in the z-axis: implications for optical disector counting in vibratome-, plastic and cryosections. J Neurosci Methods. 2003;124:45–59. doi: 10.1016/s0165-0270(02)00363-1. [DOI] [PubMed] [Google Scholar]
- Gardi JE, Nyengaard JR, Gundersen HJ. Using biased image analysis for improving unbiased stereological number estimation – a pilot simulations study of the smooth fractionator. J Microsc. 2006;222:242–250. doi: 10.1111/j.1365-2818.2006.01552.x. [DOI] [PubMed] [Google Scholar]
- Gardi JE, Nyengaard JR, Gundersen HJ. The proportionator: unbiased stereological estimation using biased automatic image analysis and non-uniform probability proportional to size sampling. Comput Biol Med. 2008;38:313–328. doi: 10.1016/j.compbiomed.2007.11.002. [DOI] [PubMed] [Google Scholar]
- Geiser M, Cruz-Orive LM, Hof V, et al. Assessment of particle retention and clearance in the intrapulmonary conducting airways of hamster lungs with the fractionator. J Microsc. 1990;160:75–88. doi: 10.1111/j.1365-2818.1990.tb03049.x. [DOI] [PubMed] [Google Scholar]
- Geuna S. The revolution of counting “tops”: two decades of the disector principle in morphological research. Microsc Res Tech. 2005;66:270–274. doi: 10.1002/jemt.20167. [DOI] [PubMed] [Google Scholar]
- Guillery RW. On counting and counting errors. J Comp Neurol. 2002;447:1–7. doi: 10.1002/cne.10221. [DOI] [PubMed] [Google Scholar]
- Gundersen HJG. Notes on the estimation of numerical density of arbitrary particles: the edge effect. J Microsc. 1977;111:219–223. [Google Scholar]
- Gundersen HJG. Stereology of arbitrary particles: a review of unbiased number and size estimators and the presentation of some new ones, in memory of William R. Thompson. J Microsc. 1986;143:3–45. [PubMed] [Google Scholar]
- Gundersen HJ. The nucleator. J Microsc. 1988;151:3–21. doi: 10.1111/j.1365-2818.1988.tb04609.x. [DOI] [PubMed] [Google Scholar]
- Gundersen HJ. The smooth fractionator. J Microsc. 2002;207:191–210. doi: 10.1046/j.1365-2818.2002.01054.x. [DOI] [PubMed] [Google Scholar]
- Gundersen HJ, Jensen EB. Stereological estimation of the volume-weighted mean volume of arbitrary particles observed on random sections. J Microsc. 1985;138:127–142. doi: 10.1111/j.1365-2818.1985.tb02607.x. [DOI] [PubMed] [Google Scholar]
- Gundersen HJ, Boysen M, Reith A. Comparison of semiautomatic digitizer-tablet and simple point counting performance in morphometry. Virchows Arch [B] Cell Pathol Incl Mol Pathol. 1981;37:317–325. doi: 10.1007/BF02892580. [DOI] [PubMed] [Google Scholar]
- Gundersen HJ, Bagger P, Bendtsen TF, et al. The new stereological tools: disector, fractionator, nucleator and point-sampled intercepts and their use in pathological research. APMIS. 1988;96:857–881. doi: 10.1111/j.1699-0463.1988.tb00954.x. [DOI] [PubMed] [Google Scholar]
- Gundersen HJ, Jensen EBV, Kiêu K, et al. The efficiency of systematic sampling in stereology – reconsidered. J Microsc. 1999;193:199–211. doi: 10.1046/j.1365-2818.1999.00457.x. [DOI] [PubMed] [Google Scholar]
- Halici Z, Bilen H, Albayrak F, et al. Does telmisartan prevent hepatic fibrosis in rats with alloxan-induced diabetes? Eur J Pharmacol. 2009a;614:146–152. doi: 10.1016/j.ejphar.2009.04.042. [DOI] [PubMed] [Google Scholar]
- Halici Z, Dursun H, Keles ON, et al. Effect of chronic treatment of haloperidol on the rat liver: a stereological and histopathological study. Naunyn-Schmied Arch Pharmacol. 2009b;379:253–261. doi: 10.1007/s00210-008-0362-z. [DOI] [PubMed] [Google Scholar]
- Hatton WJ, Von Bartheld CS. Analysis of cell death in the trochlear nucleus of the chick embryo: calibration of the optical disector counting method reveals systematic bias. J Comp Neurol. 1999;409:149–169. [PubMed] [Google Scholar]
- Helander KG. Thickness variation within individual paraffin and glycol methacrylate sections. J Microsc. 1983;132:223–227. doi: 10.1111/j.1365-2818.1983.tb04276.x. [DOI] [PubMed] [Google Scholar]
- Howard CV, Reed MG. Unbiased Stereology. Three-Dimensional Measurements in Microscopy. 2nd edn. Oxford: Garland Science/Bios Scientific Publishers; 2005. [Google Scholar]
- Jack EM, Cruz-Orive LM, Waechter F, et al. Unbiased estimation of cell and nuclear volume in preneoplastic and uninvolved tissue from the same rat liver using the nucleator. Acta Stereol. 1989;8:257–262. [Google Scholar]
- Jack EM, Bentley P, Bieri F, et al. Increase in hepatocyte and nuclear volume and decrease in the population of binucleated cells in preneoplastic foci of rat liver: a stereological study using the nucleator method. Hepatology. 1990;11:286–297. doi: 10.1002/hep.1840110220. [DOI] [PubMed] [Google Scholar]
- Jensen EB, Gundersen HJ. The rotator. J Microsc. 1993;170:35–44. [Google Scholar]
- Karbalay-Doust S, Noorafshan A. Stereological study of the effects of nandrolone decanoate on the mouse liver. Micron. 2009;40:471–475. doi: 10.1016/j.micron.2008.12.006. [DOI] [PubMed] [Google Scholar]
- Kondo F, Wada K, Kondo Y. Morphometric analysis of hepatocellular carcinoma. Virchows Arch [A] 1988;413:425–430. doi: 10.1007/BF00716991. [DOI] [PubMed] [Google Scholar]
- Kordower JH. Making the counts count: the stereology revolution. J Chem Neuroanat. 2000;20:1–2. doi: 10.1016/s0891-0618(00)00079-x. [DOI] [PubMed] [Google Scholar]
- Ladekarl M. Objective malignancy grading: a review emphasizing unbiased stereology applied to breast tumors. APMIS. 1998;79:1–34. [PubMed] [Google Scholar]
- Lemmens MAM, Steinbusch HWM, Rutten BPF, et al. Advanced microscopy techniques for quantitative analysis in neuromorphology and neuropathology research: current status and requirements for the future. J Chem Neuroanat. 2010;40:199–209. doi: 10.1016/j.jchemneu.2010.06.005. [DOI] [PubMed] [Google Scholar]
- Malarkey DE, Johnson K, Ryan L, et al. New insights into functional aspects of liver morphology. Toxicol Pathol. 2005;33:27–34. doi: 10.1080/01926230590881826. [DOI] [PubMed] [Google Scholar]
- Mandarim-de-Lacerda CA. Stereological tools in biomedical research. An Acad Braz Cienc. 2003;75:469–486. doi: 10.1590/s0001-37652003000400006. [DOI] [PubMed] [Google Scholar]
- Marcos R, Rocha E. Counting GFAP-marked Ito cells using the unbiased disector principle. In: Wisse E, Knook DL, Zanger R, Arthur MJP, editors. Cells of the Hepatic Sinusoid. Vol. 8. Leiden: Kupffer Cell Foundation; 2001. pp. 203–204. [Google Scholar]
- Marcos R, Rocha E, Henrique R, et al. A new approach to an unbiased estimate of the Hepatic Stellate Cell Index in the rat liver: an example in healthy conditions. J Histochem Cytochem. 2003;51:1101–1104. doi: 10.1177/002215540305100814. [DOI] [PubMed] [Google Scholar]
- Marcos R, Monteiro RAF, Rocha E. Estimation of the number of stellate cells in a liver with the smooth fractionator. J Microsc. 2004;215:174–182. doi: 10.1111/j.0022-2720.2004.01366.x. [DOI] [PubMed] [Google Scholar]
- Marcos R, Monteiro RAF, Rocha E. Design-based stereological estimation of hepatocyte number, by combining the smooth optical fractionator and immunocytochemistry with anticarcinoembryonic antigen polyclonal antibodies. Liver Int. 2006;26:116–124. doi: 10.1111/j.1478-3231.2005.01201.x. [DOI] [PubMed] [Google Scholar]
- Mayhew TM, Gundersen HJG. If you assume, you can make an ass out of u and me: a decade of the disector for stereological counting of particles in 3D space. J Anat. 1996;188:1–15. [PMC free article] [PubMed] [Google Scholar]
- Mazonakis M, Damilakis J, Mantatzis M, et al. Stereology versus planimetry to estimate the volume of malignant liver lesions on MR imaging. Magn Reson Imaging. 2004;22:1011–1016. doi: 10.1016/j.mri.2004.02.012. [DOI] [PubMed] [Google Scholar]
- Mouton PR. Principles and Practices of Unbiased Stereology. An Introduction for Bioscientists. Baltimore, MD: John Hopkins University Press; 2002. [Google Scholar]
- Neves RH, Alencar AC, Aguila MB, et al. Hepatic stereology of Schistosomiasis mansoni infected-mice fed a high-fat diet. Mem Inst Oswaldo Cruz. 2006;101:253–260. doi: 10.1590/s0074-02762006000900039. [DOI] [PubMed] [Google Scholar]
- Nyengaard JR. Stereologic methods and their application in kidney research. J Am Soc Nephrol. 1999;10:1100–1123. doi: 10.1681/ASN.V1051100. [DOI] [PubMed] [Google Scholar]
- Ochs M. A brief update on lung stereology. J Microsc. 2006;222:188–200. doi: 10.1111/j.1365-2818.2006.01587.x. [DOI] [PubMed] [Google Scholar]
- Odaci E, Bilen H, Hacimuftuoglu A, et al. Hepatocyte numbers in rats. A stereological and histopathological study. Arch Med Res. 2009;40:139–145. doi: 10.1016/j.arcmed.2009.02.006. [DOI] [PubMed] [Google Scholar]
- Pakkenberg B, Gundersen HJ. Total number of neurons and glial cells in human brain nuclei estimated by the disector and the fractionator. J Microsc. 1988;150:1–20. doi: 10.1111/j.1365-2818.1988.tb04582.x. [DOI] [PubMed] [Google Scholar]
- Roberts N, Puddephat MJ, Mcnulty V. The benefit of stereology for quantitative radiology. Br J Radiol. 2000;73:679–697. doi: 10.1259/bjr.73.871.11089458. [DOI] [PubMed] [Google Scholar]
- Rocha E, Monteiro RA, Oliveira MH, et al. The hepatocytes of the brown trout (Salmo trutta f. fario: a quantitative study using design-based stereology. Histol Histopathol. 2001;16:423–437. doi: 10.14670/HH-16.423. [DOI] [PubMed] [Google Scholar]
- Rocha E, Rocha MJ, Lobo-da-Cunha A, et al. The hepatocytes of the brown trout (Salmo trutta fario): a stereological study of some cytoplasmic components with the breeding cycle. Microsc Res Tech. 2010;73:766–778. doi: 10.1002/jemt.20820. [DOI] [PubMed] [Google Scholar]
- Rohr HP, Lfithy J, Gudat F, et al. Stereology of liver biopsies from healthy volunteers. Virchows Arch [A]: Path Anat Histol. 1976;371:251–263. doi: 10.1007/BF00433072. [DOI] [PubMed] [Google Scholar]
- Sahin B, Ergur H. Assessment of the optimum section thickness for the estimation of liver volume using magnetic resonance images: a stereological gold standard study. Eur J Radiol. 2006;27:96–101. doi: 10.1016/j.ejrad.2005.07.006. [DOI] [PubMed] [Google Scholar]
- Sahin B, Emirzeoglu M, Uzun A, et al. Unbiased estimation of the liver volume by the Cavalieri principle using magnetic resonance images. Eur J Radiol. 2003;47:164–170. doi: 10.1016/s0720-048x(02)00152-3. [DOI] [PubMed] [Google Scholar]
- Santos M, Marcos R, Santos N, et al. An unbiased stereological study on subpopulations of rat liver macrophages and on their numerical relation with the hepatocytes and stellate cells. J Anat. 2009;214:744–751. doi: 10.1111/j.1469-7580.2009.01055.x. [DOI] [PMC free article] [PubMed] [Google Scholar]
- Scherle W. A simple method for volumetry of organs in quantitative stereology. Mikroskopie. 1970;26:57–60. [PubMed] [Google Scholar]
- Schmitz C, Hof PR. Recommendations for straightforward and rigorous methods of counting neurons based on a computer simulation approach. J Chem Neuroanat. 2000;20:93–114. doi: 10.1016/s0891-0618(00)00066-1. [DOI] [PubMed] [Google Scholar]
- Sørensen FB. Stereological estimation of the mean and variance of nuclear volume from vertical sections. J Microsc. 1992;162:203–229. doi: 10.1111/j.1365-2818.1991.tb03132.x. [DOI] [PubMed] [Google Scholar]
- Souza-Mello V, Mandarim-de-Lacerda CA, Aguila MB. Hepatic structural alteration in adult programmed offspring (severe maternal protein restriction) is aggravated by post-weaning high-fat diet. Br J Nutr. 2007;98:1159–1169. doi: 10.1017/S0007114507771878. [DOI] [PubMed] [Google Scholar]
- Stark AK, Gundersen HJ, Gardi JE, et al. The saucor, a new stereological tool for analysing the spatial distributions of cells, exemplified by human neocortical neurons and glial cells. J Microsc. 2011;242:132–147. doi: 10.1111/j.1365-2818.2010.03447.x. [DOI] [PubMed] [Google Scholar]
- Sterio DC. The unbiased estimation of number and sizes of arbitrary particles using the disector. J Microsc. 1984;134:127–136. doi: 10.1111/j.1365-2818.1984.tb02501.x. [DOI] [PubMed] [Google Scholar]
- Tandrup T. Unbiased estimates of number and size of rat dorsal root ganglion cells in studies of structure and cell survival. J Neurocytol. 2004;33:173–192. doi: 10.1023/b:neur.0000030693.91881.53. [DOI] [PubMed] [Google Scholar]
- Unal D, Aksak S, Halici Z, et al. Effects of diabetes mellitus on the rat liver during menopausal period. J Mol Hist. 2011;42:273–287. doi: 10.1007/s10735-011-9331-9. [DOI] [PubMed] [Google Scholar]
- Valenca SS, Gouveia L, Pimenta WA, et al. Effects of oral nicotine on rat liver stereology. Int J Morphol. 2008;26:1013–1022. [Google Scholar]
- Vertemati M, Minola E, Goffredi M, et al. Computerized morphometry of the cirrhotic liver: comparative analysis in primary biliary cirrhosis, alcoholic cirrhosis, and posthepatitic cirrhosis. Microsc Res Tech. 2004;65:113–121. doi: 10.1002/jemt.20110. [DOI] [PubMed] [Google Scholar]
- Vertemati M, Sabatella G, Minola E, et al. Morphometric analysis of primary graft non-function in liver transplantation. Histopathology. 2005;46:451–459. doi: 10.1111/j.1365-2559.2005.02110.x. [DOI] [PubMed] [Google Scholar]
- Vertemati M, Vizzotto L, Moscheni C, et al. A morphometric model to minimize subjectivity in the histological assessment of hepatocellular carcinoma and its precursors in cirrhosis. Microsc Res Tech. 2008;71:606–613. doi: 10.1002/jemt.20595. [DOI] [PubMed] [Google Scholar]
- Vizzotto L, Vertemati M, Gambacorta M, et al. Analysis of histological and immunohistochemical patterns of the liver in posthepatitic and alcoholic cirrhosis by computerized morphometry. Mod Pathol. 2002;15:798–806. doi: 10.1097/01.MP.0000024365.92937.5E. [DOI] [PubMed] [Google Scholar]
- Von Bartheld CS. Counting particles in tissue sections: choices of methods and importance of calibration to minimize biases. Histol Histopathol. 2002;17:639–648. doi: 10.14670/HH-17.639. [DOI] [PubMed] [Google Scholar]
- Weibel ER, Paumagartner D. Integrated stereological and biochemical studies on hepatocytic membranes. J Cell Biol. 1978;77:584–597. doi: 10.1083/jcb.77.2.584. [DOI] [PMC free article] [PubMed] [Google Scholar]
- Weibel ER, Stäubli W, Gnägi HR, et al. Correlated morphometric and biochemical studies on the liver cell. J Cell Biol. 1969;42:68–91. doi: 10.1083/jcb.42.1.68. [DOI] [PMC free article] [PubMed] [Google Scholar]
- West MJ, Slomianka L, Gundersen HJ. Unbiased stereological estimation of the total number of neurons in the subdivisions of the rat hippocampus using the optical fractionator. Anat Rec. 1991;231:482–497. doi: 10.1002/ar.1092310411. [DOI] [PubMed] [Google Scholar]
- Wisse E, Braet F, Duimel H, et al. Fixation methods for electron microscopy of human and other liver. World J Gastroenterol. 2010;16:2851–2866. doi: 10.3748/wjg.v16.i23.2851. [DOI] [PMC free article] [PubMed] [Google Scholar]
- Yörükoglu K, Aktas S, Güler C, et al. Volume-weighted mean nuclear volume in renal cell carcinoma. Urology. 1998;52:44–47. doi: 10.1016/s0090-4295(98)00135-6. [DOI] [PubMed] [Google Scholar]