Abstract
Here we present a detailed study of the major events in the retinal histogenesis in a slow-developing elasmobranch species, the small-spotted catshark, during embryonic, postnatal and adult stages using classical histological and immunohistological methods, providing a complete neurochemical characterization of retinal cells. We found that the retina of the small-spotted catshark was fully differentiated prior to birth. The major developmental events in retinal cell differentiation occurred during the second third of the embryonic period. Maturational features described in the present study were first detected in the central retina and, as development progressed, they spread to the rest of the retina following a central-to-peripheral gradient. While the formation of both plexiform layers occurs simultaneously in the retina of the most common fish models, in the small-spotted catshark retina the emergence of the outer plexiform layer was delayed with respect to the inner plexiform layer. According to the expression of the markers used, retinal cell differentiation followed a vitreal-to-scleral gradient, with the exception of Müller cells that were the last cell type generated during retinogenesis. This vitreal-to-scleral progression of neural differentiation seems to be specific to slow-developing fish species.
Keywords: cell differentiation, development, elasmobranch, immunohistochemistry, retinogenesis
Introduction
The retina is probably the most widely studied tissue for the determination of the mechanisms involved in cell fate determination in the nervous system. It begins as a pseudostratified neuroepithelium consisting of a single sheet of undifferentiated neuroepithelial cells with uniform morphology that generate most of the retinal cell types (Turner & Cepko, 1987; Malicki, 2004). The topography of cytogenesis in the developing vertebrate retina can be analysed by monitoring the chronotopographical appearance of the layered retinal structure and functional synapses, the cessation of the mitotic activity in the ventricular layer of the retina, and the appearance of a variety of neurochemical molecules selectively expressed by retinal cell types (Sharma & Ungar, 1980; Rapaport & Stone, 1983; Robinson et al. 1985; Stone et al. 1985; Young, 1985; Harman & Beazley, 1987; Prada et al. 1991; Reese et al. 1996; Bytyqi & Layer, 2005; Candal et al. 2005a; Francisco-Morcillo et al. 2006; Bejarano-Escobar et al. 2009, 2010). Thus, the pattern of cessation of cytogenesis, monitored by the disappearance of mitotic figures in the ventricular surface of the retina, is closely coincident in space and time with the development of the outer plexiform layer (OPL; Rapaport & Stone, 1983; Robinson et al. 1985; Stone et al. 1985; Harman & Beazley, 1987). Antibodies against neuron- and glial-specific molecules are well suited to verifying the presence of functional synapses and to describing the onset of retinal cell differentiation. Thus, the onset of functional synapses can be followed immunohistochemically using antibodies against the transmembrane synaptic vesicle glycoprotein SV2 (Okada et al. 1994; Bergmann et al. 1999; Bejarano-Escobar et al. 2010). Antigens like TUJ1, against neuron-specific class III β-tubulin (Snow & Robson, 1994, 1995; Francisco-Morcillo et al. 2005; Sharma & Netland, 2007) or Islet1 (Isl1) transcription factor (Austin et al. 1995; Galli-Resta et al. 1997; Francisco-Morcillo et al. 2005, 2006; Edqvist et al. 2006; Elshatory et al. 2007; Bejarano-Escobar et al. 2009, 2010) are expressed in different subpopulations of cells in the adult retinal tissue, but are considered as early markers of ganglion cell differentiation because they are selectively expressed by the first postmitotic neuroblasts during their migration from the germinal epithelium in the outer retina to more vitreal layers. Calbindin (CB), a member of the family of calcium-binding proteins, has been detected in many retinal neurons in the adult and developing retinal tissue (Hamano et al. 1990; Pasteels et al. 1990; Ellis et al. 1991; Vecino et al. 1993; Francisco-Morcillo et al. 2006; Hendrickson et al. 2007). Photoreceptor maturation has been monitored with antibodies against opsins (Hagedorn et al. 1998; Candal et al. 2005a; Villar-Cheda et al. 2008; Bejarano-Escobar et al. 2009, 2010). The α-subunit of the guanine nucleotide-binding protein Go (Goα) is exclusively present in ON bipolar cells (Vardi et al. 1993; Vardi, 1998; Haverkamp & Wassle, 2000; Elshatory et al. 2007). Glutamine synthetase (GS) is specifically expressed by Müller cells in the adult and developing retina (Mack et al. 1998; Peterson et al. 2001; Lillo et al. 2002; Bejarano-Escobar et al. 2009, 2010).
The maturation of the vertebrate retina begins in the posterior eye cup and follows a central-to-peripheral sweep, as has been described in fish (Sharma & Ungar, 1980; Vecino et al. 1993; Hagedorn et al. 1998; Doldán et al. 1999; Hu & Easter, 1999; Peterson et al. 2001; Candal et al. 2005a,b; Kitambi & Malicki, 2008; Bejarano-Escobar et al. 2009, 2010), amphibians (Holt et al. 1988), reptiles (Francisco-Morcillo et al. 2006), birds (Prada et al. 1991; Snow & Robson, 1994; Francisco-Morcillo et al. 2005) and mammals (Rapaport et al. 1985, 2004; Young, 1985; Reese et al. 1996). However, not all cell phenotypes are generated at the same time. Retinogenesis in vertebrates proceeds in a precise chronological order, with the seven principal cell types generated in successive phases (Kahn, 1974; Sharma & Ungar, 1980; Young, 1985; Holt et al. 1988; LaVail et al. 1991; Prada et al. 1991; Rapaport et al. 2004; Francisco-Morcillo et al. 2006; Bejarano-Escobar et al. 2009, 2010). Thus, retinal ganglion cells are generated first, followed in overlapping phases by horizontal cells, cone photoreceptor cells, amacrine cells, rod photoreceptor cells, bipolar cells and, finally, Müller glial cells (Young, 1985; Marquardt & Gruss, 2002; Rapaport et al. 2004; Lamb et al. 2007). However, in some fish species, autoradiographic and immunohistochemical techniques have revealed that the disappearance of proliferative activity and the expression of several neuronal retinal markers set up approximately according to a vitreal to scleral gradient of cell differentiation (Sharma & Ungar, 1980; Vecino et al. 1993; Doldán et al. 1999; Candal et al. 2005b; Harahush et al. 2009; Ferreiro-Galve et al. 2010a).
Although an extensive literature already exists on fish retinal differentiation (Vecino et al. 1993; Doldán et al. 1999; Fishelson & Baranes, 1999; Hu & Easter, 1999; Peterson et al. 2001; Candal et al. 2005a,b, 2008; Ferreiro-Galve et al. 2008, 2010a,b; Kitambi & Malicki, 2008; Bejarano-Escobar et al. 2009, 2010; Harahush et al. 2009), most of them are conducted in bony-fish, and data concerning gene expression patterns, birthdates, differentiation and the ontogenic expression of selective neuromarkers in specific cell populations in the retina of elasmobranchs are sparse (Fishelson & Baranes, 1999; Sauka-Spengler et al. 2001; Plouhinec et al. 2005; Ferreiro-Galve et al. 2008, 2010a,b; Harahush et al. 2009). Oviparous sharks present attributes typically associated with precocial species, such as large egg size, small egg number, slow ontogeny and relatively large size at hatching. Moreover, recent studies show that, at hatching, the retinas of different shark species are fully developed, as in the rest of precocial fish species (Fishelson & Baranes, 1999; Ferreiro-Galve et al. 2008, 2010a,b; Harahush et al. 2009).
The aim of the present study was to elucidate the chronotopographical distribution of different cell markers during development of the retina in a single species of elasmobranch, the small-spotted catshark, also named the lesser-spotted dogfish, or simply dogfish, Scyliorhinus canicula (Linnaeus, 1758). We discuss our results in the context of the developmental profile described for the retina of different fish species as well as other classes of vertebrates.
Materials and methods
A total of 72 embryos, hatchlings and adults of the small-spotted catshark were included in the present study (Table 1). Fertilized eggs were obtained from adult females collected in the western Mediterranean by local fishing vessels. The eggs were transferred to the laboratory and maintained in an indoor tank of well-aereated seawater, kept clean by means of an external filter device. Nitrite concentration and water density were monitored during the experiment. The water temperature ranged from 15 °C to 18 °C. At this temperature the average time of incubation was 175 days. The eggs were opened after having roughly estimated the developmental degree of the embryos through the transparent walls of the capsule, and the embryos were then carefully removed. Embryos and newly hatched specimens were overanaesthetized with 0.04% tricaine methane sulphonate (MS-222; Sigma Chemical, Poole, UK) in elasmobranch buffer (EB: 16.38 g L−1 NaCl; 0.89 g L−1 KCl; 1.11 g L−1 CaCl2; 0.38 g L−1 NaHCO3; 0.06 g L−1 NaH2PO4; 21.6 g L−1 urea; pH 7.2) or sea water, respectively, and then fixed (see below). Digital images were captured with a Digital Camera DS-5Mc (Nikon) attached to a Stereoscopic Microscope SMZ-1000 (Nikon). Their total length, measured from the anterior end of the head to the tip of the tail, was between 18.0 and 400.0 mm (Table 1).
Table 1.
Specimens of small-spotted catshark included in the present study. The embryos are given according to the developmental stage (St) of Ballard et al. (1993), and their age (from ‘day 1’, the first day of incubation) and body length (the distance between the tip of the snout and the end of the caudal fin).
| Specimens | Body length (mm) | n |
|---|---|---|
| St25 | 18 | 2 |
| St27 | 19–22 | 3 |
| St28 | 22–23 | 4 |
| St29 | 22–31 | 5 |
| St30 | 29–31 | 6 |
| St31 | 30–34 | 6 |
| St32-early | 42–60 | 8 |
| St32-late | 61–75 | 8 |
| St33 | 75–84 | 10 |
| St34 | 80–85 | 8 |
| Hatching (P0) | 85–92 | 10 |
| Adult | 400 | 2 |
The degree of development of the embryos was estimated according to the stages (St) established by Ballard et al. (1993). The stages are based on external anatomical features, and are numbered from 1 (fertilization and beginning of the zygote segmentation) to 34 (just before hatching). The embryos included in the present study ranged from St25 to St34. We divided St32 into St32-early and St32-late because: first, it is a long stage of about 50 days at 15–18 °C, during which numerous changes take place gradually at variable rates (Ballard et al. 1993); second, many morphological, histological and neurochemical differences relating to the visual system were found in the present St32 embryos; and third, differentiation of many retinal cell types occurs during this stage. Figure 1 shows embryos belonging to several developmental stages and also a new hatched specimen.
Fig. 1.
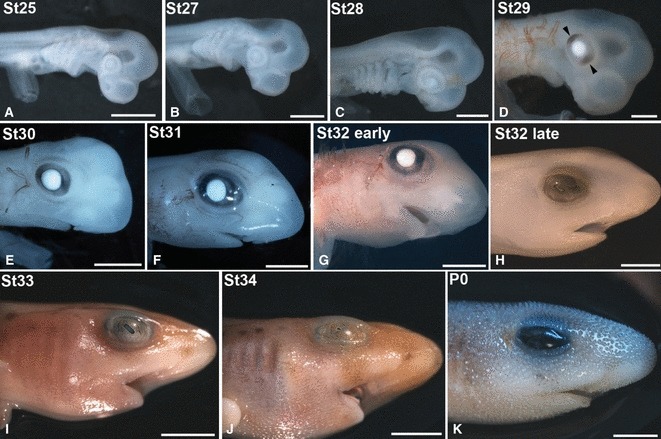
Stereo microscope images of embryos (A–J), according to developmental stages (St) of Ballard et al. (1993), and a newly hatched specimen (K) of small-spotted catshark illustrating the external gross anatomical changes of the eye. The optic anlagen are prominent at St25 (A). A faint pigmentation in the RPE is first observed at St29 (arrowheads in D). At St30, the eye is circled with pigment (E). Stage 32 is subdivided into St32-early and St32-late (G, I). At St32-early, black, conspicuous pigmentation has completely encircled the eye (G). At St 32-late, the eye has attained a mature appearance (H) and a faint pigmentation is visible on the body. P0, newly hatched specimen. Scale bars: 2 mm (A–D); 4 mm (E, F); 6 mm (G); 7 mm (H); 10 mm (I–K).
Tissue processing
Histogenetic processes in the small-spotted catshark retina were examined in semi-thin (morphological analysis) and cryostat sections (immunohistochemical analysis). Embryos and hatchlings were fixed by immersion in different fixative solutions (see below). Adult individuals were previously perfused in situ with EB followed by the fixative solution.
For morphological analysis, some embryos and postnatal specimens were immersed in a mixture of 2% glutaraldehyde and 2% paraformaldehyde (PFA) in EB for 8 h at 4 °C. They were then rinsed in EB, postfixed in 2% osmium tetroxide for 2 h, dehydrated in a graded series of acetone and propylene oxide, and embedded in Spurr's resin. Serial frontal 2-μm sections were cut in a Reichert Jung microtome. The sections were stained with 1% toluidine blue in 1% aqueous borax.
For immunohistochemical analysis, embryos and hatchlings were fixed by immersion in 4% PFA in EB or in methanol/acetone/water (2 : 2 : 1), for 12–24 h, depending on their size, at 4 °C. Adult sharks were previously perfused in situ with EB followed by 4% PFA in EB, and postfixed by immersion for 6 h at 4 °C in the same fixative. The eyes were removed and immersed for 12 h in the same fixative solution. Tissues were gradually hydrated and immersed in phosphate-buffered saline, then cryoprotected, soaked in embedding medium, frozen and freeze-mounted onto aluminium sectioning blocks. Cryostat sections, 15 μm thick, were cut in the frontal plane. Sections through different retinal areas were thaw-mounted on SuperFrost©Plus slides (Menzel-Glaser, Germany), air-dried and stored at −80 °C until use.
Immunohistochemical studies
Primary and secondary antibodies used in the present study are summarized in Table 2. All primary antibodies used in this report were widely used in neuroanatomical studies in the central nervous system of different groups of vertebrates. They cross-react with antigens present in the small-spotted catshark tissue, showing similar staining patterns to those previously described in the fish retina and in the retina of other vertebrates.
Table 2.
Immunoreagents, working dilutions and sources of antibodies used in the present study.
| Primary antibody | Working dilution | Antibody suppliers (Reference) |
|---|---|---|
| Mouse anti-glutamine synthetase monoclonal antibody | 1 : 200 | Chemicon (Ref. MAB302) |
| Mouse anti-Islet-1 monoclonal antibody (clone 39.4D5) | 1 : 5 | Developmental Studies Hybridoma Bank (DSHB) |
| Mouse anti-SV2 monoclonal antibody | 1 : 10 | DSHB |
| Mouse anti-TUJ1 monoclonal antibody | 1 : 100 | Abcam (Ref. ab14545) |
| Rabbit anti-bovine rod opsin polyclonal antibody, CERN-922 | 1 : 1000 | Gift from Dr Willem J. DeGrip |
| Rabbit anti-calbindin polyclonal antibody | 1 : 1000 | Swant (Ref. CB-38a) |
| Rabbit anti-calretinin polyclonal antibody | 1 : 2000 | Swant (Ref. 7699-4) |
| Rabbit anti-Goα polyclonal antibody | 1 : 500 | Millipore (Ref. 07-634) |
| Rabbit anti-phospho-Histone H3 polyclonal antibody | 1 : 500 | Millipore (Ref. 06-570) |
| Secondary antibodies | ||
| Alexa Fluor 488 goat-anti-mouse IgG antibody | 1 : 200 | Molecular Probes, the Netherlands (Ref. A-11001) |
| Alexa Fluor 594 goat-anti-rabbit IgG antibody | 1 : 200 | Molecular Probes, the Netherlands (Ref. A-11012) |
| Anti-mouse IgG biotin conjugate | 1 : 100 | Sigma (Ref. B-7264) |
| Anti-rabbit IgG biotin conjugate | 1 : 50 | Sigma (Ref. B-7389) |
Single- and double-immunohistochemical studies were performed as described in Bejarano-Escobar et al. (2009, 2010). Control experiments were performed by omitting the primary antibodies and were always negative. Sections were coverslipped with Mowiol for observation. In all cases, the sections were observed using an epifluorecence, brightfield Nikon EOS-600 microscope, and photographed with a digital camera (Axiocam HRc). Some of the double-immunolabellings were photographed with a Nikon D-Eclipse C1 confocal laser-scanning microscope. Graphical enhancement and preparation for publication were performed in Adobe Photoshop (v.CS4).
Results
Formation of retinal layers and disappearance of the mitotic activity in the ventricular zone
The development of retinal lamination was analysed in toluidine blue-stained semi-thin sections. We labelled the small-spotted catshark cryostat sections with antibodies to a cell cycle-related protein, anti-phosphohistone H3 (pHisH3), which labels cells in the M phase (Ajiro et al. 1996; Fischer & Reh, 2000). The neural retina remained undifferentiated during the earliest stages of development included in the present study (St25–29). Thus, at St29 the neuroretina consisted of a neuroblastic layer (NbL) of densely packed cells with abundant mitotic figures in the scleral-most region (Figs 2A,B and 3A), which is consistent with the known position of M-phase retinal progenitors. At St31, while a massively proliferating retinal neuroepithelium was observed in the peripheral retina, the central sensory retina consisted of a ganglion cell layer (GCL) separated from the neuroblastic cell mass by a thin inner plexiform layer (IPL; Fig. 2C,D). Most of the mitotic figures were observed in the ventricular side of the retina (Figs 2C,D and 3B,C), although ‘ectopic mitoses’ primarily located within the inner region of the NbL were occasionally observed (Figs 2C,D and 3B,C). The mitotic spindles of dividing cells in the inner NbL did not appear to be preferentially oriented in any particular plane. At St32-late the developing OPL became apparent in the central and mid-peripheral parts of the retina (Fig. 2E,F), but was not distinguishable in the peripheral region (Fig. 2E,G). At this stage, pHisH3-immunoreactive cells were restricted to the scleral surface of mid-peripheral and peripheral areas (Fig. 3D,E). At the hatching stage (P0), the typical multilayered structure of the vertebrate retina was observed in the central region (Fig. 2H). The neuroepithelial organization of the pure-proliferating ciliary marginal zone (CMZ) was observed in the peripheral-most retina (Fig. 2I). Adjacent to this region, we distinguished the transition zone (TZ) described by Ferreiro-Galve et al. (2010a) in the shark retina, formed by an IPL that separated the presumptive GCL and the outer NbL (Fig. 2I). pHisH3-immunoreactive mitotic figures were restricted in newly hatched animals to the scleral parts of the CMZ and TZ (Fig. 3F).
Fig. 2.
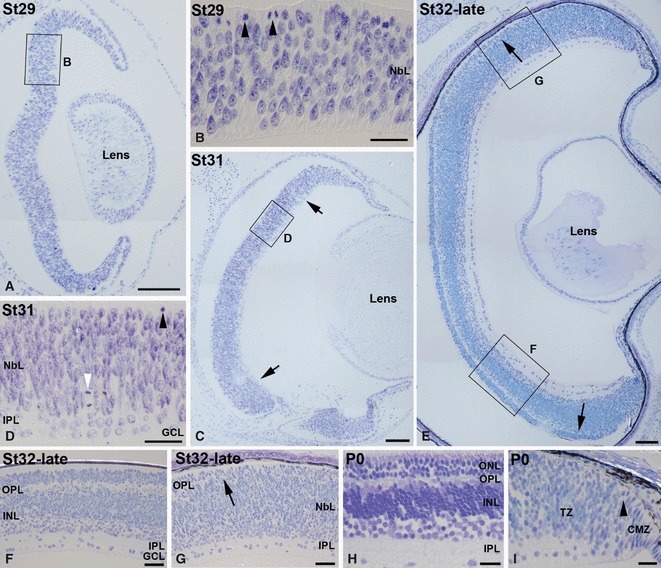
Toluidine blue-stained semi-thin transverse sections showing emergence of the retinal layers in the developing small-spotted catshark retina. Boxed areas in (A, C, E) are shown at higher magnification in (B, D, F, G). (A, B) At St29 retinal lamination was absent and the retina was occupied by a neuroepithelium with abundant mitotic figures in the scleral surface (arrowheads in B). (C, D) At St31 retinal lamination was restricted to the central retina (delimited by arrows in C), showing a GCL and an external NbL with abundant mitotic figures in the scleral-most region (black arrowhead in D) and sparse extra-ventricular mitosis (white arrowhead in D). These nuclear layers are separated by a non-cellular layer, the presumptive IPL. (E–G) At St32-late, the two plexiform layers were clearly distinguished (E–G) except in the peripheral retina, where only the presumptive GCL, IPL and external NbL were observable (E, G). (H, I) At hatching (P0) the typical cytoarchitecture of the adult retina was clearly observable (H), with the exception of the peripheral-most region, occupied by the CMZ, and a special tissue denominated transition zone, where the OPL was not evident (I). Sparse mitotic figures were observable in the peripheral retina (arrowhead in I). Scale bars: 100 μm (A, C); 200 μm (E); 25 μm (B, D, F–I). CMZ, ciliary marginal zone; GCL, ganglion cell layer; INL, inner nuclear layer; IPL, inner plexiform layer; NbL, neuroblastic layer; ONL, outer nuclear layer; OPL, outer plexiform layer; TZ, transition zone.
Fig. 3.
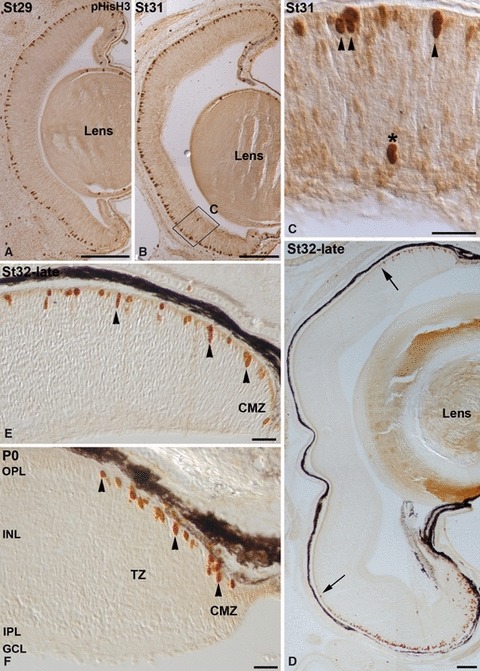
pHisH3 immunoreactivity distribution in the developing small-spotted catshark retina. The boxed area in (B) is shown at higher magnification in (C). (A–C) Between St29 and St31, numerous pHisH3-positive mitotic cells were distributed throughout the ventricular surface (A–C; arrowheads in C). Occasionally, extraventricular mitoses were observed in more internal layers of the retina (asterisk in C). (D, E) At St32-late pHisH3 immunoreactivity disappeared from the central retina, becoming restricted to mid-peripheral and peripheral areas (delimited by arrows in D; arrowheads in E). (F) At P0 mitotic immunoreactive figures were only detected in the peripheral-most retina (arrowheads). Scale bars: 100 μm (A, B, D); 25 μm (C, E, F). CMZ, ciliary marginal zone; GCL, ganglion cell layer; INL, inner nuclear layer; IPL, inner plexiform layer; OPL, outer plexiform layer; TZ, transition zone.
Neurochemical study
Expression patterns in the mature shark retina
We selected several antibodies against neurochemical macromolecules selectively expressed by retinal cell types to monitor the cell differentiation process in the small-spotted catshark retina. Some of these antibodies, such as TUJ1 or Isl1, are considered early markers of ganglion cell differentiation in the retinal tissue. However, with the advance of development, these proteins are expressed by cells other than retinal ganglion cells. Therefore, we investigated the developmental expression of all markers used and identified the cell types expressing them to gain a better understanding of whether preferred expression of them in certain retinal neurons plays a cell-specific role, or whether it is only a part of an intrinsic developmental program. The expression patterns for the different cell markers in the mature tissue are reported first so as to establish a set of referents with which to compare other stages. Essentially, the same labelling for the different antibodies was observed in P0 and adult small-spotted catshark retinas, therefore only images of P0 shark retinas are shown. Thus, immunoreactivity against TUJ1 antibody was intense in cells located at the scleral-most part of the inner nuclear layer (INL) including their projections in the OPL (Fig. 4A,B). Calretinin (CR), a horizontal cell marker in the developing and adult shark retina (Ferreiro-Galve et al. 2010b), colocalized with TUJ1 in this retinal region (Fig. 5A–C). In addition, strong TUJ1 staining was present in scarce radially oriented cell processes located in the INL, in amacrine cell bodies, in the IPL, and in the optic fibre layer (OFL; Fig. 4A,B). Moreover, intense immunoreactivity was found in fascicles of axons that leave the eye through the optic nerve head (ONH; Fig. 4B). Isl1 expression was detected in the nuclei of some horizontal, bipolar and amacrine cells, and in most of the ganglion cells (Fig. 4C). Both the OPL and IPL were heavily immunostained with the anti-SV2 antibody (Fig. 4D). Faint immunoreactivity was also observed in cell processes throughout the INL (Fig. 4D). Numerous CB-immunoreactive bipolar and amacrine cells were observed (Fig. 4E). Many of the CB-immunoreactive bipolar cells exhibited thick processes (Landolt's club) that ran towards the outer limiting membrane (OLM; Fig. 4E). Both the OPL and IPL appeared also faintly immunostained (Fig. 4E). Colocalization experiments for TUJ1 and CB revealed that TUJ1-immunoreactive horizontal cells never expressed CB (Fig. 5D–F). Furthermore, double-labelling experiments also revealed that both the bipolar and amacrine CB-immunoreactive cells were distinct from the bipolar and amacrine Isl1-positive cells, and no double-labelled cells were detected (Fig. 5G–I). Rod opsin-immunoreactive perikarya were located at various levels within the outer nuclear layer (ONL; Fig. 4F). Occasional opsin-immunoreactive cells were observed in the INL (Fig. 4F). Goα-immunoreactive bipolar cell perikarya were observed in the scleral-most part of the INL (Fig. 4G). Immunoreactivity was also observed in their thick axonal (inner) processes running to the IPL, and in both the OPL and the IPL (Fig. 4G). All Goα-expressing bipolar cells also expressed Isl1 (Fig. 5J–L). GS-immunoreactive Müller cell perikarya were arranged in a single row and located in the vitreal half of the INL (Fig. 4H). Two immunoreactive processes emerged from the cell body towards the OLM and the inner limiting membrane (ILM; Fig. 4H). Müller cell processes that branched in the OPL, near the photoreceptor nuclei, appeared moderately immunostained (Fig. 4H). Therefore, the antibodies used in the present study stain most of the cell types that one can find in the adult small-spotted catshark retina.
Fig. 4.
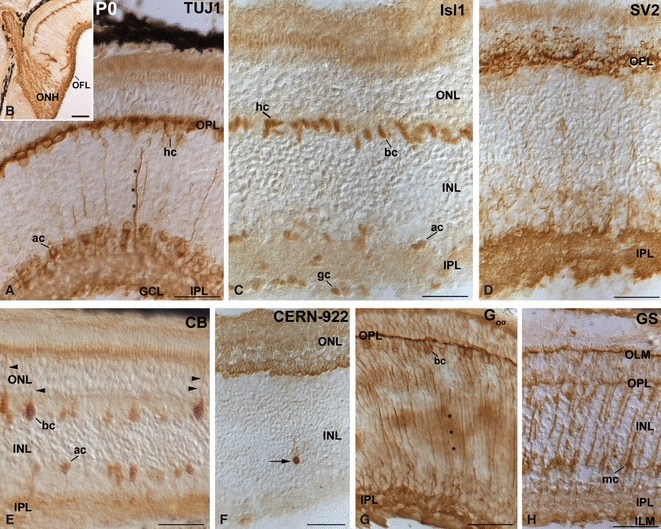
Patterns of expression of cell markers in the small-spotted catshark retina at hatching (P0). (A, B) TUJ1 immunoreactivity was detected in many horizontal and amacrine cells, in sparse ganglion cells, in fine processes oriented along the vitreo-scleral axis (asterisks), and in the OFL. Strong immunoreactive ganglion cell axons were also observed in the ONH (B). (C) Isl1 immunoreactivity was detected in the nuclei of subpopulations of horizontal, bipolar, amacrine and ganglion cells. (D) The IPL and OPL were highly immunoreactive to the SV2 antibody. Fine processes distributed throughout the INL appeared faintly immunostained. (E) Immunoreactivity against CB was mainly detected in bipolar and amacrine cells. Many bipolar cells exhibited apical processes that ran towards the OLM (arrowheads). Descending appendages from amacrine cells were also observed. The OPL and IPL appeared faintly immunostained. (F) Most of the photoreceptor cells were labelled with CERN-922 antibody. Occasional opsin-immunoreactive cells were observed in the INL (arrow). (G) Goα-immunopositive cell bodies were located in the scleral part of the INL. Fine long immunoreactive processes that reached the IPL (asterisks) were also immunolabelled. The IPL and OPL were immunoreactive. (H) GS staining was evident in cell somata located in the vitreal half of the INL, and in vitreal and scleral processes of radially oriented cells. The OLM, ILM and OPL also appeared stained. Scale bars: 25 μm (A, C–H); 100 μm (B). ac, amacrine cell; bc, bipolar cell; CB, calbindin; gc, ganglion cell; GCL, ganglion cell layer; hc, horizontal cell; ILM, inner limiting membrane; INL, inner nuclear layer; IPL, inner plexiform layer; mc, Müller cell; OFL, optic fibre layer; OLM, outer limiting membrane; ONH, optic nerve head; ONL, outer nuclear layer; OPL, outer plexiform layer.
Fig. 5.
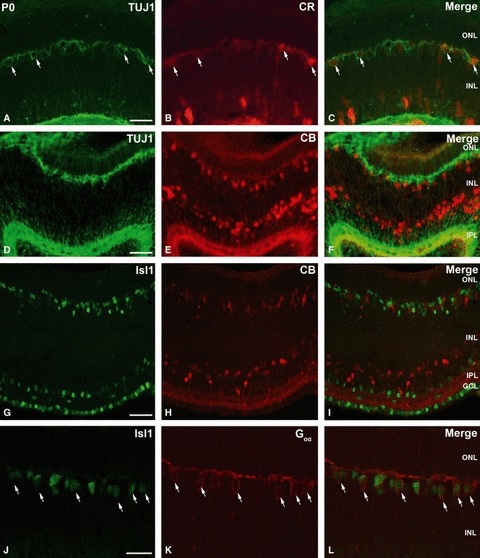
Photomicrographs of P0 small-spotted catshark retina to illustrate the colocalization of CR (green) and TUJ1 (red) (A–C), TUJ1 (green) and CB (red) (D–F), Isl1 (green) and CB (red) (G–I), and Goα (green) and Isl1 (red) (J–L). (A–C) Panels show localization of TUJ1 in CR-immunoreactive horizontal cells (arrows). (D–F) CB was not expressed in TUJ1-immunoreactive horizontal cells. (G–I) Panels illustrate the same section labelled for Isl1 and CB, where no colocalization was detected. (J–L) Goα-immunoreactive bipolar cells also expressed Isl1 (arrows). Scale bars: 25 μm (A–I); 15 μm (J–L). CB, calbindin; CR, calretinin; GCL, ganglion cell layer; INL, inner nuclear layer; IPL, inner plexiform layer; ONL, outer nuclear layer.
Neurochemical profiles during shark retinal ontogeny
No immunoreactivity was observed for any of the markers investigated in this study until St28 (not shown). By this stage, although the small-spotted catshark retina was occupied by a proliferating neuroepithelium with no apparent morphological signs of differentiated neurons, TUJ1 immunohistochemistry revealed two different types of labelled cells restricted to central regions of the retina (Fig. 6A–C). The first type has round somata near the vitreal surface (Fig. 6A,C), in close relationship with immunoreactive axons that run parallel to the vitreal surface of the neuroretina (Fig. 6A–C). These cells did not show processes extending towards the scleral surface, and therefore appeared to be post-migratory (Fig. 6C). The second type was bipolar shaped, showing ovoid somata located at various depths and vitreo-scleral processes spanning the neuroepithelium (Fig. 6A–C). At this stage, scarce faintly labelled Isl1-positive ovoid nuclei were dispersed over the NbL, some of them located in the vitreal-most region (Fig. 6D,E). At St29, TUJ1 (Fig. 7A–C) and Isl1 (Fig. 7D,E) expression reached more peripheral regions, and the labelled cells increased in number. The expression patterns were very similar to that observed in the previous stage, although many of the Isl1-positive cells were located in the vitreal margin of the central retina (Fig. 7D,E). At this stage the first SV2 immunoproducts were detected in slender cell processes oriented along the vitreo-scleral axis, mainly restricted to the central region of the retina (Fig. 7F,G). Strong immunoreactive ganglion cell axons were also observed in the optic nerve (Fig. 7F). The IPL became recognizable in a small region of the central retina at St30 (not shown), and it could be clearly observed at St31 with antibodies against SV2, reaching the mid-peripheral area (Fig. 8A,B). Isl1-positive cells were detected on either side of the developing IPL, corresponding to differentiating amacrine and ganglion cells (Fig. 8C,D). CB was first detected in the small-spotted catshark retina by this stage in cells located in the inner and outer regions of the NbL in the central retina (Fig. 8E), although the scleral population of immunoreactive cells disappeared in the peripheral region (Fig. 8F). The IPL also displayed a faint immunoreactivity (Fig. 8E,F). At St32-early the retinal layering was completed in the central retina with the emergence of the OPL (Fig. 2F) that already showed moderately SV2 immunoreactivity (Fig. 9A). At this stage most of the cell types located in the scleral region of the retina became differentiated. Thus, sparse horizontal cells and photoreceptors were labelled for the first time with TUJ1 (Fig. 9B) and CERN-922 (Fig. 9C,D) antibodies, respectively. However, photoreceptor cells showed morphological features of immaturity, with elongated cell bodies with no clear distinction between the inner and outer segments (Fig. 9D). At this stage, the first nuclei of horizontal/bipolar Isl1-immunoreactive cells could be distinguished (Fig. 9E), and the number of CB-immunoreactive bipolar cells progressively increased (Fig. 9F). At St32-late the expression patterns for TUJ1 (Fig. 10A), Isl1 (Fig. 10C), SV2 (Fig. 10E), CB (Fig. 10G) and CERN-922 (Fig. 10I) began to resemble those observed in the P0 retina in most of the retinal tissue, although features of immaturity were visible with the same markers in the peripheral retina (Fig. 10B,D,F,H,J, respectively). At St32-late, Goα staining was primarily seen in the central retina in faintly stained cell bodies located in the scleral-most part of the INL, from which dendrites emanated towards the OPL (Fig. 10K). Bipolar cell processes that extended into the IPL were also stained (Fig. 10K). By this stage the enzyme GS was also first detected, restricted to cell somata arranged in a single row located close to the vitreal region of the INL and to slender processes that emerged from the cell bodies towards the OLM and the ILM (Fig. 10L). The onset of the appearance and expression pattern of the various cell markers used are summarized in Fig. 11.
Fig. 6.
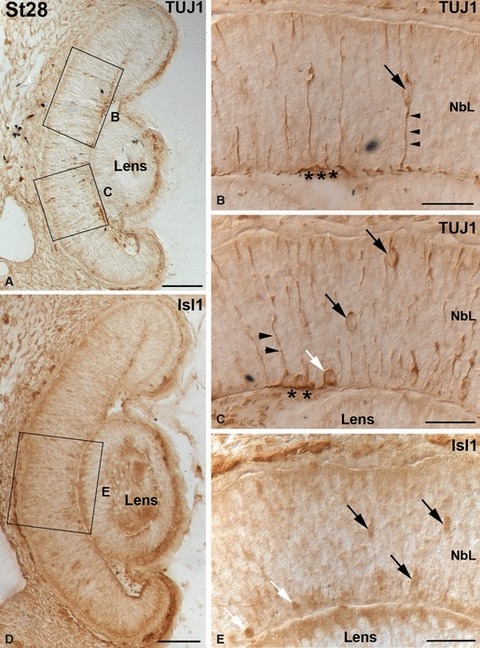
Early immunochemical markers in the embryonic small-spotted catshark retina at St28. The boxed areas in (A, D) are shown at higher magnification in (B, C, E). (A–C) The pattern of TUJ1 immunolabelling showed several postmitotic cells with large somata bordering the vitreal surface (white arrow in C). In the region of the presumptive OFL, several TUJ1-positive processes could also be seen (asterisks in B, C). Bipolar-shaped cells (A, black arrows in B, C) with processes oriented perpendicular to the vitreal and scleral surfaces (arrowheads in B, C) were also observed. (D–E) Ovoid nuclei were faintly labelled with anti-Isl1 antibody (D, black arrows in E). They were mainly concentrated in the central retina and dispersed over the neuroepithelium, although some of them were located close to the vitreal surface (white arrows in E). Scale bars: 100 μm (A, D); 25 μm (B, C, E). NbL, neuroblastic layer.
Fig. 7.
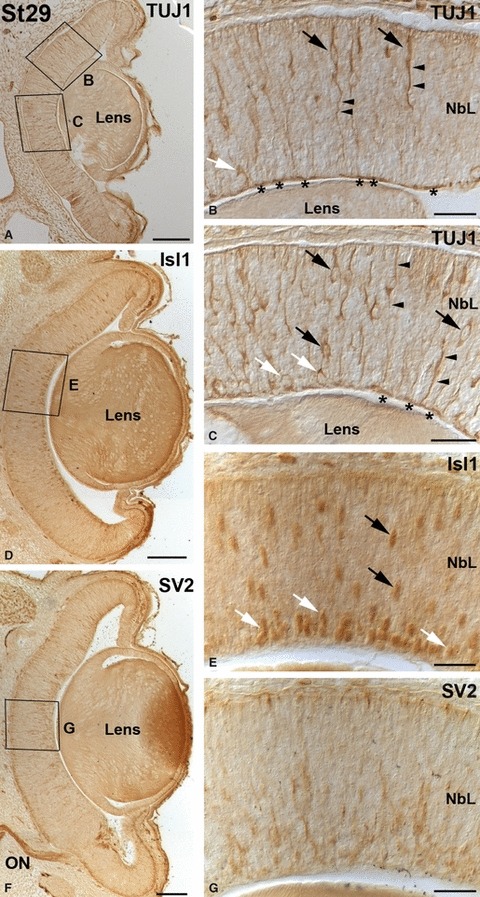
Early immunochemical markers in the embryonic small-spotted catshark retina at St29. The boxed areas in (A, D, F) are shown at higher magnification in (B, C, E, G). (A–C) Many TUJ1-positive somata were found in the central retina with their cell bodies located at varying distances from the vitreal surface (black arrows in B, C) and in the presumptive GCL (white arrows in B, C). Immunoreactive vitreo-scleral processes (arrowheads in B, C) and optic axons (asterisks in B, C) were distinguishable. (D, E) The number of Isl1-positive nuclei increased by this stage (D, arrows in E). Many of these immunoreactive nuclei were close to the inner surface of the neuroretina (white arrows in E). (F, G) Radial cell prolongations immunoreactive for SV2 were dispersed throughout the neuroepithelium by this stage, mainly in the central retina. Strong immunoreactive ganglion cell axons were observed in the optic nerve. Scale bars: 100 μm (A, D, F); 25 μm (B, C, E, G). NbL, neuroblastic layer; ON, optic nerve.
Fig. 8.
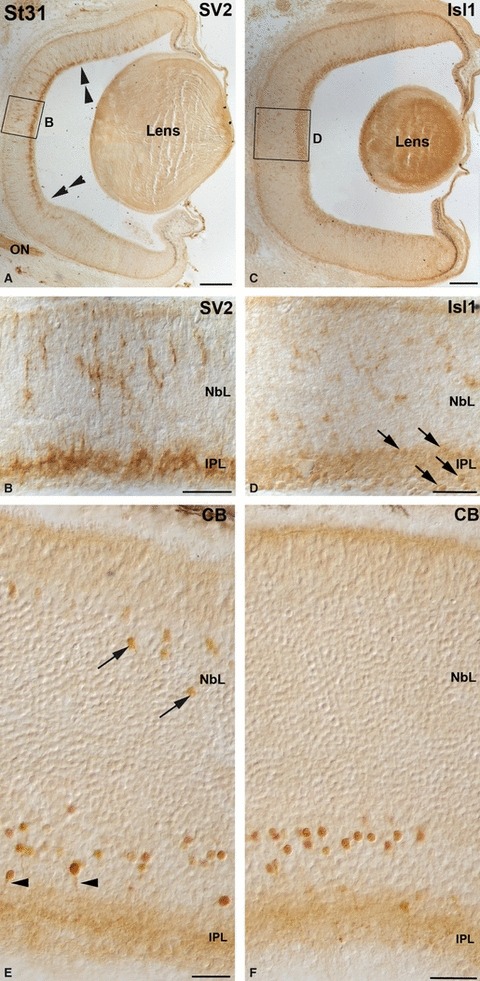
Immunochemical markers in the embryonic St31 small-spotted catshark retina. The boxed areas in (A, C) are shown at higher magnification in (B, D). (A, B) SV2 immunoreactivity was mainly confined to the IPL (delimited by double arrowheads), although radial cell processes were also immunostained (B). (C, D) Many Isl1-immunoreactive nuclei abutting either side of the anlage of the IPL (arrows in D) were observed by this stage. (E, F) CB was detected throughout the retina in abundant cell somas located in the presumptive amacrine cell layer. Many of these cells sent immunoreactive descending processes to the IPL (arrowheads in E), which appeared faintly immunostained too. Restricted to the central retina, scarce immunoreactive somas were detected in the scleral half of the NbL (arrows in E). Scale bars: 100 μm (A, C); 25 μm (B, D–F). CB, calbindin; IPL, inner plexiform layer; NbL, neuroblastic layer; ON, optic nerve.
Fig. 9.
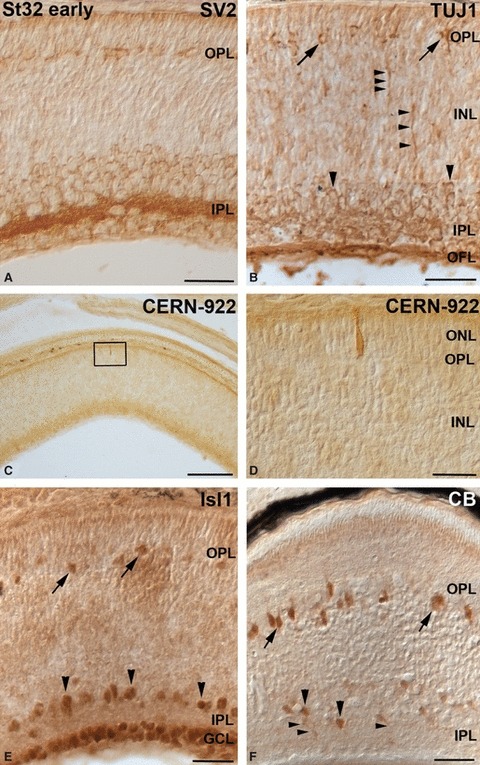
Neurochemical profiles in the embryonic central retina at St32-early. The boxed area in (C) is shown at higher magnification in (D). (A) SV2 antibody revealed the emergence of the OPL in the central retina. Furthermore, strong immunoreactivity was detected in the IPL. (B) The rounded TUJ1-immunoreactive somas, located close to the OPL, represented putative differentiating horizontal cells (arrows). Immunostaining was detected also in amacrine cells (large arrowheads), in descending cell prolongations (small arrowheads) located in the INL, IPL and OFL. (C, D) Scarce opsin-immunoreactive photoreceptor cells, showing morphological features of immaturity, were observed in the ONL. (E) Isl1 antibody recognized for the first time cell nuclei located in the outer region of the INL (arrows). Immunoreactivity was also found in most of the ganglion cells and in a subpopulation of amacrine cells located in the innermost region of the INL (arrowheads). (F) CB immunoproducts were found in somas located in the outer region of the INL (arrows), and in cell perikarya (large arrowheads) and their processes (small arrowheads) in the vitreal part of the INL. Scale bars: 25 μm (A, B, D–F); 100 μm (C). CB, calbindin; GCL, ganglion cell layer; INL, inner nuclear layer; IPL, inner plexiform layer; OFL, optic fibre layer; ONL, outer nuclear layer; OPL, outer plexiform layer.
Fig. 10.
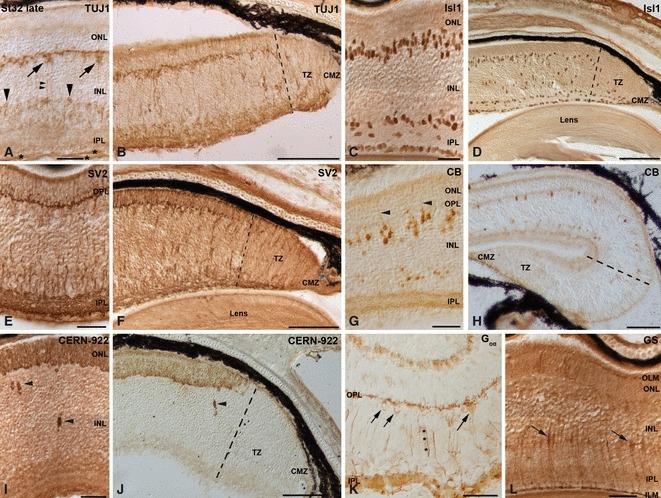
Neurochemical profiles in the central (A, C, E, G, I, K, L) and peripheral (B, D, F, H, J) embryonic small-spotted catshark retina at St32-late. (A–J) While the labelling patterns described for the different markers in the central and mid-peripheral retina resembled those observed at hatching day, the peripheral areas (delimited by dashed lines in B, D, F, H, J) resembled undeveloped retinas. Arrows in (A) point to immunoreactive horizontal cells. Large arrowheads in (A) point to immunoreactive amacrine cells. Small arrowheads point to fine immunoreactive processes descending the INL in (A), bipolar cells Landolt's club in (G) and opsin-immunoreactive cells in the INL in (I, J). (K) Bipolar cells with their cell bodies (arrows) located close to the OPL and their processes extended towards both OPL and IPL (asterisks) were detected for the first time with antibodies against Goα protein. (L) GS immunoreactivity was seen in the developing INL, with the stained cell bodies localized in the proximal part of the prospective INL (arrows), and two slender processes extending towards the OLM and the ILM. Scale bars: 25 μm (A, C, E, G, I, K, L); 100 μm (B, D, F, H, J). CB, calbindin; CMZ, ciliary marginal zone; GS, glutamine synthetase; ILM, inner limiting membrane; INL, inner nuclear layer; IPL, inner plexiform layer; OLM, outer limiting membrane; ONL, outer nuclear layer; OPL, outer plexiform layer; TZ, transition zone.
Fig. 11.
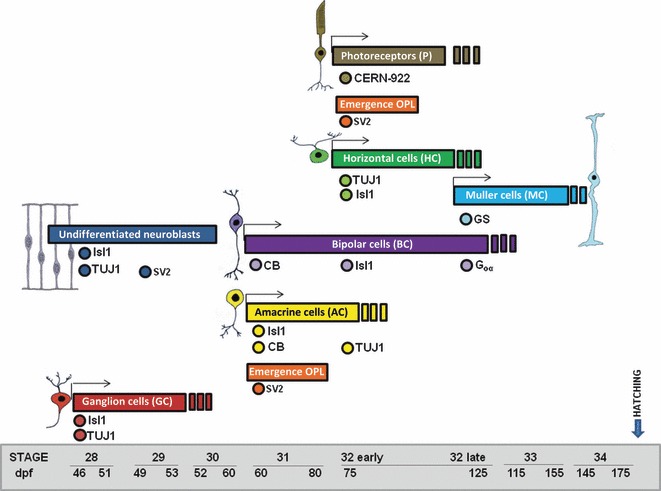
Schematic diagram of the onset of cell marker expression in the central retina for the different retinal cell types. The earliest detectable time of cell marker onset in a cell population is indicated as dots. Note that sometimes not all cells within a certain cell population are necessarily labelled, for instance Is1 amacrine cells or CB bipolar/amacrine cells. The time course of expression of different cell markers showed a vitreal to scleral progression of cell differentiation in the shark retina. CB, calbindin; GS, glutamine synthetase; OPL, outer plexiform layer
Taken together, our findings indicate that different immunoreactivities appeared progressively in the developing small-spotted catshark retina following a central-to-peripheral gradient. Moreover, retinal cell differentiation followed a vitreal-to-scleral gradient in this species, with the exception of Müller cells that were the last cell type generated during retinogenesis.
Discussion
Ontogenetic processes in the retina of fish species commonly used as models for retinal development are difficult to define due to the rapid development to maturity. In contrast, small-spotted catshark is a precocial elasmobranch species showing an embryological development lasting 175 days. The present study shows that retinal cell differentiation in this species begins at St28 (embryonic day 46, E46), and at time of release the retina is fully differentiated. The analysis of this precocial slow-developing fish with large eyes allows examination of details that may be underestimated in fast-developing fish with small eyes. Therefore, the retina of small-spotted catshark constitutes an exceptional model in which to study cell retinogenesis due to the protracted embryonic period relative to other fish species. The results obtained in the present study are discussed below.
Gradients of histogenesis and cell differentiation in the small-spotted catshark retina
The general pattern of ripening of the retinal layers and the appearance of neurochemical profiles in the developing small-spotted catshark retina follow a central to peripheral gradient as in the rest of vertebrates (Sharma & Ungar, 1980; Young, 1985; Prada et al. 1991; Vecino et al. 1993; Reese et al. 1996; Doldán et al. 1999; Hu & Easter, 1999; Peterson et al. 2001; Candal et al. 2005a,b, 2008; Francisco-Morcillo et al. 2006; Kitambi & Malicki, 2008; Bejarano-Escobar et al. 2009, 2010). The disappearance of the mitotic activity in the ventricular surface of the retina, followed in the present study with antibodies against pHisH3, parallels the central to peripheral sweep of differentiation, as has been reported in the retina of mammals (Rapaport & Stone, 1983; Robinson et al. 1985; Stone et al. 1985; Harman & Beazley, 1987). With this marker, we found sparse ‘ectopic mitoses’ located vitreally in the NbL of the small-spotted catshark developing retina. ‘Ectopic mitoses’ have previously been described in the developing retina of various vertebrate species (Robinson et al. 1985; Smirnov & Puchkov, 2004; Godinho et al. 2007; Boije et al. 2009). Recently, Boije et al. (2009) have demonstrated that all or a clear majority of vitreal mitoses are undertaken by the horizontal cell committed precursors in the chick retina.
Additionally, our results reveal that different maturational features also progressed in a vitreal to scleral manner. Thus, we showed that the OPL evolved much later (St32-early) than the IPL (St30). This delay in the OPL formation with respect to the IPL has been described in the retina of chick (Drenhaus et al. 2007) and different mammals (Young, 1985; Reese et al. 1996; Rapaport et al. 2004). However, the emergence of both plexiform layers occurred simultaneously in the retina of different fish (Vecino et al. 1993; Doldán et al. 1999; Kitambi & Malicki, 2008; Bejarano-Escobar et al. 2009, 2010) and the turtle Mauremys leprosa (Francisco-Morcillo et al. 2006).
Furthermore, the immunohistochemical analysis shows that the neuronal differentiation process progresses in a vitreal to scleral direction in the developing small-spotted catshark retina, coinciding with previous studies conducted in the brown-banded bamboo shark (Chiloscyllium punctatum) retina, assessed by light and transmission-electron microscopy (Harahush et al. 2009). These data agree with studies conducted in the fish retina that showed a gradual loss of proliferative cells in a vitreo-scleral fashion (Sharma & Ungar, 1980; Negishi et al. 1990; Hagedorn & Fernald, 1992; Candal et al. 2005a). However, Müller cells in the developing small-spotted catshark constitute the cell type that differentiated last, in agreement with previous studies of the retinas of different vertebrates (Young, 1985; Prada et al. 1991; Rapaport et al. 2004; Francisco-Morcillo et al. 2006; Bejarano-Escobar et al. 2009, 2010). Structural analyses in the mammalian retina suggest nearly simultaneous differentiation of the Müller cells and the ganglion cells (Uga & Smelser, 1973; Kuwabara & Weidman, 1974). More recently, an ultrastructural study developed in the embryonic retina of the brown-banded bamboo shark, Chiloscyllium punctatum (Harahush et al. 2009), has shown that Müller cell somata or their processes are present at early stages of retinal development, simultaneously with ganglion cell differentiation. These authors claim that the early presence of Müller cells within the retina provides a scaffold for the orientation and migration of differentiating neuroblasts. We did not observe cells exhibiting the typical morphological features of Müller cells in carefully examined toluidine blue-stained semi-thin sections of the developing small-spotted catshark retina before St32-late, the moment at which they started to express GS. The determination of the timing of Müller cell differentiation in the fish retina and identification of new early markers represent interesting avenues for future research.
Neurochemical profiles during small-spotted catshark retinal differentiation
Although the precise involvement of the antigens described in the present study in retinal development is unclear, their patterns of expression indicate that many of them may be necessary for neuronal and glial differentiation. Some of them allowed us to identify retinal cells in the pre-laminated retina, such as TUJ1 (Watanabe et al. 1991; Snow & Robson, 1994, 1995; Sharma & Netland, 2007) and Isl1 (Austin et al. 1995; Galli-Resta et al. 1997; Francisco-Morcillo et al. 2005, 2006; Edqvist et al. 2006; Elshatory et al. 2007; Bejarano-Escobar et al. 2009, 2010) that have been reported to be early markers for ganglion cells. Thus, TUJ1-immunoreactive cells were first detected in the developing small-spotted catshark retina in large somata bordering the presumptive ILM. In the region of the presumptive OFL, several TUJ1-positive processes can also be seen. Moreover, spindle-shaped cells distributed throughout the neuroepithelium sending axon-like processes into the region of the OFL were labelled too. Abundant Isl1-immunoreactive nuclei coincide chronotopographically with TUJ1-labelled cells. The first cells generated during development of the vertebrate retina are the ganglion cells (Kahn, 1974; Young, 1985; Prada et al. 1991; Snow & Robson, 1994; Hu & Easter, 1999; McCabe et al. 1999; Francisco-Morcillo et al. 2006; Bejarano-Escobar et al. 2009, 2010). Therefore, the first differentiating ganglion cells in the small-spotted catshark retina appeared at St28.
Coinciding with the emergence of the IPL, subpopulations of Isl1- and CB-immunoreactive amacrine cells were arranged along the inner region of the NbL. In all vertebrates investigated, Isl1 is present in a subpopulation of amacrine cells even during early stages of development (Galli-Resta et al. 1997; Edqvist et al. 2006; Francisco-Morcillo et al. 2006; Elshatory et al. 2007; Bejarano-Escobar et al. 2009, 2010). CB is present in subpopulations of amacrine cells in the retina of fish (Vecino et al. 1993; Weruaga et al. 2000; Villar-Cheda et al. 2006; Graña et al. 2008; Morona et al. 2011) and other vertebrates (Pasteels et al. 1990; Ellis et al. 1991; Pochet et al. 1991; Völgyi et al. 1997; Deng et al. 2001; Loeliger & Rees, 2005; Francisco-Morcillo et al. 2006; Morona et al. 2007). However, many of the studies conducted on fish retinas have reported that CB is absent from amacrine cells (Doldán et al. 1999; Weruaga et al. 2000; Huesa et al. 2002).
CB immunoreactivity is typical in bipolar cells in vertebrates from lampreys through mammals (Pasteels et al. 1990; Pochet et al. 1991; Vecino et al. 1993; Doldán et al. 1999; Weruaga et al. 2000; Deng et al. 2001; Chiquet et al. 2002; Cuenca et al. 2002; Huesa et al. 2002; Francisco-Morcillo et al. 2006; Villar-Cheda et al. 2006; Morona et al. 2011), with the exception of nocturnal primates and rodents (Wässle et al. 1998; Chiquet et al. 2002). CB-immunoreactive bipolar cells were found in the developing retina of small-spotted catshark from St31 onwards, although the number of labelled cells and immunostaining intensity increased markedly with development. Many of these labelled cells send out Landolt's club processes that terminate amidst the epithelial cell processes and in close relation to photoreceptors, as has been described in sturgeon (Huesa et al. 2002) and sea lamprey (Villar-Cheda et al. 2006). We used another two antibodies that identified bipolar cells in the shark retina, Goα and Isl1. We found that bipolar cells expressing Goα also expressed Isl1, as has been described in the mouse retina (Elshatory et al. 2007). However, CB and Isl1 did not overlap in bipolar cells.
We have studied the maturation of horizontal cells by using the appearance of TUJ1 and Isl1 antigens as markers, in coherence with the results described previously (Edqvist et al. 2006; Francisco-Morcillo et al. 2006; Sharma & Netland, 2007; Bejarano-Escobar et al. 2009, 2010). However, Isl1 is not expressed in horizontal cells in the developing and adult mouse retina (Elshatory et al. 2007). Both markers were first detected in presumptive horizontal cells by St32-early, coinciding with the emergence of the OPL.
Finally, the first opsin-expressing photoreceptors were detected at St32-early in the presumptive ONL. In addition, labelled cells were also observed in the INL of embryonic and perinatal specimens, extending long processes along the vitreo-scleral axis. These ectopic opsin-immunoreactive cells have been also described during development of the rat retina (Gunhan-Agar et al. 2000; Gunhan et al. 2003). The presence of these neurons outside their normal retinal layers reflects migration errors during early development (Gunhan et al. 2003).
Conclusions
Elasmobranchs occupy a key phylogenetic position as an out-group to osteichthyans, and therefore knowledge of their retinal organization and development is essential to assess the ancestral condition in gnathostomes and evolution of retinogenesis in vertebrates. In summary, the present findings, together with data from the literature, indicate that: first, the protracted gestational period, which is comparable to that of humans and other large mammals, of small-spotted catshark make it a highly valuable model for developmental studies of the visual system; second, small-spotted catshark retina is fully differentiated and functional prior to birth; third, retinal maturational features follow a central-to-peripheral gradient, as in other classes of vertebrates; and fourth, the vitreal-to-scleral progression of histogenesis and neural differentiation in the fish retina seems to be specific to slow-developing species.
Acknowledgments
We express our gratitude to María Salud Holguín Arévalo and Manuel Ramírez for their excellent technical assistance. We thank Dr María Victoria Alarcón, ‘Centro de Investigación Finca la Orden’, Junta de Extremadura, for assistance with confocal microscopy. Special thanks are also due to the skippers of the fishing vessels ‘Torrejaral’ and ‘Rafael y Antonio’. R.B.E. is a recipient of a PhD studentship from the Junta de Extremadura. This work was supported by Grants from the Spanish Ministerio de Ciencia y Tecnología (BFU2007-67540) and Junta de Extremadura (PRI06A195).
References
- Ajiro K, Yoda K, Utsumi K, et al. Alteration of cell cycle-dependent histone phosphorylations by okadaic acid. Induction of mitosis-specific H3 phosphorylation and chromatin condensation in mammalian interphase cells. J Biol Chem. 1996;271:13 197–13 201. doi: 10.1074/jbc.271.22.13197. [DOI] [PubMed] [Google Scholar]
- Austin CP, Feldman DE, Ida JA, et al. Vertebrate retinal ganglion cells are selected from competent progenitors by the action of Notch. Development. 1995;121:3637–3650. doi: 10.1242/dev.121.11.3637. [DOI] [PubMed] [Google Scholar]
- Ballard WW, Mellinger J, Lechenault H. A series of normal stages for development of Scyliorhinus canicula, the lesser spotted dogfish (Chondrichthyes: Scyliorhinidae. J Exp Zool. 1993;267:318–336. [Google Scholar]
- Bejarano-Escobar R, Blasco M, DeGrip WJ, et al. Cell differentiation in the retina of an epibenthonic teleost, the Tench (Tinca tinca, Linneo 1758) Exp Eye Res. 2009;89:398–415. doi: 10.1016/j.exer.2009.04.007. [DOI] [PubMed] [Google Scholar]
- Bejarano-Escobar R, Blasco M, DeGrip WJ, et al. Eye development and retinal differentiation in an altricial fish species, the senegalese sole (Solea senegalensis, Kaup 1858) J Exp Zool B Mol Dev Evol. 2010;314:580–605. doi: 10.1002/jez.b.21363. [DOI] [PubMed] [Google Scholar]
- Bergmann M, Grabs D, Rager G. Developmental expression of dynamin in the chick retinotectal system. J Histochem Cytochem. 1999;47:1297–1306. doi: 10.1177/002215549904701009. [DOI] [PubMed] [Google Scholar]
- Boije H, Edqvist PH, Hallbook F. Horizontal cell progenitors arrest in G2-phase and undergo terminal mitosis on the vitreal side of the chick retina. Dev Biol. 2009;330:105–113. doi: 10.1016/j.ydbio.2009.03.013. [DOI] [PubMed] [Google Scholar]
- Bytyqi AH, Layer PG. Lamina formation in the Mongolian gerbil retina (Meriones unguiculatus. Anat Embryol (Berl) 2005;209:217–225. doi: 10.1007/s00429-004-0443-9. [DOI] [PubMed] [Google Scholar]
- Candal E, Anadón R, DeGrip WJ, et al. Patterns of cell proliferation and cell death in the developing retina and optic tectum of the brown trout. Brain Res Dev Brain Res. 2005a;154:101–119. doi: 10.1016/j.devbrainres.2004.10.008. [DOI] [PubMed] [Google Scholar]
- Candal EM, Caruncho HJ, Sueiro C, et al. Reelin expression in the retina and optic tectum of developing common brown trout. Brain Res Dev Brain Res. 2005b;154:187–197. doi: 10.1016/j.devbrainres.2004.10.014. [DOI] [PubMed] [Google Scholar]
- Candal E, Ferreiro-Galve S, Anadón R, et al. Morphogenesis in the retina of a slow-developing teleost: emergence of the GABAergic system in relation to cell proliferation and differentiation. Brain Res. 2008;1194:21–27. doi: 10.1016/j.brainres.2007.11.065. [DOI] [PubMed] [Google Scholar]
- Chiquet C, Dkhissi-Benyahya O, Chounlamountri N, et al. Characterization of calbindin-positive cones in primates. Neuroscience. 2002;115:1323–1333. doi: 10.1016/s0306-4522(02)00327-5. [DOI] [PubMed] [Google Scholar]
- Cuenca N, Deng P, Linberg KA, et al. The neurons of the ground squirrel retina as revealed by immunostains for calcium binding proteins and neurotransmitters. J Neurocytol. 2002;31:649–666. doi: 10.1023/a:1025791512555. [DOI] [PubMed] [Google Scholar]
- Deng P, Cuenca N, Doerr T, et al. Localization of neurotransmitters and calcium binding proteins to neurons of salamander and mudpuppy retinas. Vision Res. 2001;41:1771–1783. doi: 10.1016/s0042-6989(01)00060-8. [DOI] [PubMed] [Google Scholar]
- Doldán MJ, Prego B, de Miguel Villegas E. Immunochemical localization of calretinin in the retina of the turbot (Psetta maxima) during development. J Comp Neurol. 1999;406:425–432. doi: 10.1002/(sici)1096-9861(19990419)406:4<425::aid-cne1>3.0.co;2-1. [DOI] [PubMed] [Google Scholar]
- Drenhaus U, Voigt T, Rager G. Onset of synaptogenesis in the plexiform layers of the chick retina: a transmission electron microscopic study. Microsc Res Tech. 2007;70:329–335. doi: 10.1002/jemt.20414. [DOI] [PubMed] [Google Scholar]
- Edqvist PH, Myers SM, Hallbook F. Early identification of retinal subtypes in the developing, pre-laminated chick retina using the transcription factors Prox1, Lim1, Ap2alpha, Pax6, Isl1, Isl2, Lim3 and Chx10. Eur J Histochem. 2006;50:147–154. [PubMed] [Google Scholar]
- Ellis JH, Richards DE, Rogers JH. Calretinin and calbindin in the retina of the developing chick. Cell Tissue Res. 1991;264:197–208. doi: 10.1007/BF00313956. [DOI] [PubMed] [Google Scholar]
- Elshatory Y, Deng M, Xie X, et al. Expression of the LIM-homeodomain protein Isl1 in the developing and mature mouse retina. J Comp Neurol. 2007;503:182–197. doi: 10.1002/cne.21390. [DOI] [PMC free article] [PubMed] [Google Scholar]
- Ferreiro-Galve S, Candal E, Carrera I, et al. Early development of GABAergic cells of the retina in sharks: an immunohistochemical study with GABA and GAD antibodies. J Chem Neuroanat. 2008;36:6–16. doi: 10.1016/j.jchemneu.2008.04.004. [DOI] [PubMed] [Google Scholar]
- Ferreiro-Galve S, Rodríguez-Moldes I, Anadón R, et al. Patterns of cell proliferation and rod photoreceptor differentiation in shark retinas. J Chem Neuroanat. 2010a;39:1–14. doi: 10.1016/j.jchemneu.2009.10.001. [DOI] [PubMed] [Google Scholar]
- Ferreiro-Galve S, Rodríguez-Moldes I, Candal E. Calretinin immunoreactivity in the developing retina of sharks: comparison with cell proliferation and GABAergic system markers. Exp Eye Res. 2010b;91:378–386. doi: 10.1016/j.exer.2010.06.011. [DOI] [PubMed] [Google Scholar]
- Fischer AJ, Reh TA. Identification of a proliferating marginal zone of retinal progenitors in postnatal chickens. Dev Biol. 2000;220:197–210. doi: 10.1006/dbio.2000.9640. [DOI] [PubMed] [Google Scholar]
- Fishelson L, Baranes A. Ocular development in the oman shark, Iago omanensis (Triakidae), Gulf of Aqaba, Red Sea. Anat Rec. 1999;256:389–402. doi: 10.1002/(SICI)1097-0185(19991201)256:4<389::AID-AR6>3.0.CO;2-L. [DOI] [PubMed] [Google Scholar]
- Francisco-Morcillo J, Sánchez-Calderón H, Kawakami Y, et al. Expression of Fgf19 in the developing chick eye. Brain Res Dev Brain Res. 2005;156:104–109. doi: 10.1016/j.devbrainres.2004.12.011. [DOI] [PubMed] [Google Scholar]
- Francisco-Morcillo J, Hidalgo-Sánchez M, Martín-Partido G. Spatial and temporal patterns of proliferation and differentiation in the developing turtle eye. Brain Res. 2006;1103:32–48. doi: 10.1016/j.brainres.2006.05.052. [DOI] [PubMed] [Google Scholar]
- Galli-Resta L, Resta G, Tan SS, et al. Mosaics of islet-1-expressing amacrine cells assembled by short-range cellular interactions. J Neurosci. 1997;17:7831–7838. doi: 10.1523/JNEUROSCI.17-20-07831.1997. [DOI] [PMC free article] [PubMed] [Google Scholar]
- Godinho L, Williams PR, Claassen Y, et al. Nonapical symmetric divisions underlie horizontal cell layer formation in the developing retina in vivo. Neuron. 2007;56:597–603. doi: 10.1016/j.neuron.2007.09.036. [DOI] [PubMed] [Google Scholar]
- Graña P, Anadón R, Yáñez J. Immunocytochemical study of calretinin and calbindin D-28K expression in the retina of three cartilaginous fishes and a cladistian (Polypterus) Brain Res Bull. 2008;75:375–378. doi: 10.1016/j.brainresbull.2007.10.015. [DOI] [PubMed] [Google Scholar]
- Gunhan E, van der List D, Chalupa LM. Ectopic photoreceptors and cone bipolar cells in the developing and mature retina. J Neurosci. 2003;23:1383–1389. doi: 10.1523/JNEUROSCI.23-04-01383.2003. [DOI] [PMC free article] [PubMed] [Google Scholar]
- Gunhan-Agar E, Kahn D, Chalupa LM. Segregation of on and off bipolar cell axonal arbors in the absence of retinal ganglion cells. J Neurosci. 2000;20:306–314. doi: 10.1523/JNEUROSCI.20-01-00306.2000. [DOI] [PMC free article] [PubMed] [Google Scholar]
- Hagedorn M, Fernald RD. Retinal growth and cell addition during embryogenesis in the teleost, Haplochromis burtoni. J Comp Neurol. 1992;321:193–208. doi: 10.1002/cne.903210203. [DOI] [PubMed] [Google Scholar]
- Hagedorn M, Mack AF, Evans B, et al. The embryogenesis of rod photoreceptors in the teleost fish retina, Haplochromis burtoni. Brain Res Dev Brain Res. 1998;108:217–227. doi: 10.1016/s0165-3806(98)00051-0. [DOI] [PubMed] [Google Scholar]
- Hamano K, Kiyama H, Emson PC, et al. Localization of two calcium binding proteins, calbindin (28 kD) and parvalbumin (12 kD), in the vertebrate retina. J Comp Neurol. 1990;302:417–424. doi: 10.1002/cne.903020217. [DOI] [PubMed] [Google Scholar]
- Harahush BK, Hart NS, Green K, et al. Retinal neurogenesis and ontogenetic changes in the visual system of the brown banded bamboo shark, Chiloscyllium punctatum (Hemiscyllidae, Elasmobranchii) J Comp Neurol. 2009;513:83–97. doi: 10.1002/cne.21953. [DOI] [PubMed] [Google Scholar]
- Harman AM, Beazley LD. Patterns of cytogenesis in the developing retina of the wallaby Setonix brachyurus. Anat Embryol (Berl) 1987;177:123–130. doi: 10.1007/BF00572536. [DOI] [PubMed] [Google Scholar]
- Haverkamp S, Wassle H. Immunocytochemical analysis of the mouse retina. J Comp Neurol. 2000;424:1–23. [PubMed] [Google Scholar]
- Hendrickson A, Yan YH, Erickson A, et al. Expression patterns of calretinin, calbindin and parvalbumin and their colocalization in neurons during development of Macaca monkey retina. Exp Eye Res. 2007;85:587–601. doi: 10.1016/j.exer.2007.07.011. [DOI] [PubMed] [Google Scholar]
- Holt CE, Bertsch TW, Ellis HM, et al. Cellular determination in the Xenopus retina is independent of lineage and birth date. Neuron. 1988;1:15–26. doi: 10.1016/0896-6273(88)90205-x. [DOI] [PubMed] [Google Scholar]
- Hu M, Easter SS. Retinal neurogenesis: the formation of the initial central patch of postmitotic cells. Dev Biol. 1999;207:309–321. doi: 10.1006/dbio.1998.9031. [DOI] [PubMed] [Google Scholar]
- Huesa G, Yánez J, Anadón R. Calbindin and calretinin immunoreactivities in the retina of a chondrostean, Acipenser baeri. Cell Tissue Res. 2002;309:355–360. doi: 10.1007/s00441-002-0608-x. [DOI] [PubMed] [Google Scholar]
- Kahn AJ. An autoradiographic analysis of the time of appearance of neurons in the developing chick neural retina. Dev Biol. 1974;38:30–40. doi: 10.1016/0012-1606(74)90256-5. [DOI] [PubMed] [Google Scholar]
- Kitambi SS, Malicki JJ. Spatiotemporal features of neurogenesis in the retina of medaka, Oryzias latipes. Dev Dyn. 2008;237:3870–3881. doi: 10.1002/dvdy.21797. [DOI] [PMC free article] [PubMed] [Google Scholar]
- Kuwabara T, Weidman TA. Development of the prenatal rat retina. Invest Ophthalmol. 1974;13:725–739. [PubMed] [Google Scholar]
- Lamb TD, Collin SP, Pugh EN., Jr Evolution of the vertebrate eye: opsins, photoreceptors, retina and eye cup. Nat Rev Neurosci. 2007;8:960–976. doi: 10.1038/nrn2283. [DOI] [PMC free article] [PubMed] [Google Scholar]
- LaVail MM, Rapaport D, Rakic P. Cytogenesis in the monkey retina. J Comp Neurol. 1991;309:86–114. doi: 10.1002/cne.903090107. [DOI] [PubMed] [Google Scholar]
- Lillo C, Velasco A, Jimeno D, et al. The glial design of a teleost optic nerve head supporting continuous growth. J Histochem Cytochem. 2002;50:1289–1302. doi: 10.1177/002215540205001002. [DOI] [PubMed] [Google Scholar]
- Loeliger M, Rees S. Immunocytochemical development of the guinea pig retina. Exp Eye Res. 2005;80:9–21. doi: 10.1016/j.exer.2004.08.003. [DOI] [PubMed] [Google Scholar]
- Mack AF, Germer A, Janke C, et al. Muller (glial) cells in the teleost retina: consequences of continuous growth. Glia. 1998;22:306–313. [PubMed] [Google Scholar]
- Malicki J. Cell fate decisions and patterning in the vertebrate retina: the importance of timing, asymmetry, polarity and waves. Curr Opin Neurobiol. 2004;14:15–21. doi: 10.1016/j.conb.2004.01.015. [DOI] [PubMed] [Google Scholar]
- Marquardt T, Gruss P. Generating neuronal diversity in the retina: one for nearly all. Trends Neurosci. 2002;25:32–38. doi: 10.1016/s0166-2236(00)02028-2. [DOI] [PubMed] [Google Scholar]
- McCabe KL, Gunther EC, Reh TA. The development of the pattern of retinal ganglion cells in the chick retina: mechanisms that control differentiation. Development. 1999;126:5713–5724. doi: 10.1242/dev.126.24.5713. [DOI] [PubMed] [Google Scholar]
- Morona R, Moreno N, López JM, et al. Comparative analysis of calbindin D-28K and calretinin in the retina of anuran and urodele amphibians: colocalization with choline acetyltransferase and tyrosine hydroxylase. Brain Res. 2007;1182:34–49. doi: 10.1016/j.brainres.2007.07.102. [DOI] [PubMed] [Google Scholar]
- Morona R, Northcutt RG, González A. Immunohistochemical localization of calbindin D28k and calretinin in the retina of two lungfishes, Protopterus dolloi and Neoceratodus forsteri: colocalization with choline acetyltransferase and tyrosine hydroxylase. Brain Res. 2011;1368:28–43. doi: 10.1016/j.brainres.2010.10.098. [DOI] [PubMed] [Google Scholar]
- Negishi K, Stell WK, Takasaki Y. Early histogenesis of the teleostean retina: studies using a novel immunochemical marker, proliferating cell nuclear antigen (PCNA/cyclin) Brain Res Dev Brain Res. 1990;55:121–125. doi: 10.1016/0165-3806(90)90112-c. [DOI] [PubMed] [Google Scholar]
- Okada M, Erickson A, Hendrickson A. Light and electron microscopic analysis of synaptic development in Macaca monkey retina as detected by immunocytochemical labelling for the synaptic vesicle protein, SV-2. J Comp Neurol. 1994;339:535–558. doi: 10.1002/cne.903390406. [DOI] [PubMed] [Google Scholar]
- Pasteels B, Rogers J, Blachieer F, et al. Calbindin and calretinin localization in retina from different species. Vis Neurosci. 1990;5:1–16. doi: 10.1017/s0952523800000031. [DOI] [PubMed] [Google Scholar]
- Peterson RE, Fadool JM, McClintock J, et al. Muller cell differentiation in the zebrafish neural retina: evidence of distinct early and late stages in cell maturation. J Comp Neurol. 2001;429:530–540. doi: 10.1002/1096-9861(20010122)429:4<530::aid-cne2>3.0.co;2-c. [DOI] [PubMed] [Google Scholar]
- Plouhinec JL, Leconte L, Sauka-Spengler T, et al. Comparative analysis of gnathostome Otx gene expression patterns in the developing eye: implications for the functional evolution of the multigene family. Dev Biol. 2005;278:560–575. doi: 10.1016/j.ydbio.2004.11.019. [DOI] [PubMed] [Google Scholar]
- Pochet R, Pasteels B, Seto-Ohshima A, et al. Calmodulin and calbindin localization in retina from six vertebrate species. J Comp Neurol. 1991;314:750–762. doi: 10.1002/cne.903140408. [DOI] [PubMed] [Google Scholar]
- Prada C, Puga J, Pérez-Méndez L, et al. Spatial and temporal patterns of neurogenesis in the chick retina. Eur J Neurosci. 1991;3:559–569. doi: 10.1111/j.1460-9568.1991.tb00843.x. [DOI] [PubMed] [Google Scholar]
- Rapaport DH, Stone J. The topographic of cytogenesis in the developing retina of the cat. J Neurosci. 1983;3:1824–1834. doi: 10.1523/JNEUROSCI.03-09-01824.1983. [DOI] [PMC free article] [PubMed] [Google Scholar]
- Rapaport DH, Robinson SR, Stone J. Cytogenesis in the developing retina of the cat. Aust N Z J Ophthalmol. 1985;13:113–124. doi: 10.1111/j.1442-9071.1985.tb00412.x. [DOI] [PubMed] [Google Scholar]
- Rapaport DH, Wong LL, Wood ED, et al. Timing and topography of cell genesis in the rat retina. J Comp Neurol. 2004;474:304–324. doi: 10.1002/cne.20134. [DOI] [PubMed] [Google Scholar]
- Reese BE, Johnson PT, Baker GE. Maturational gradients in the retina of the ferret. J Comp Neurol. 1996;375:252–273. doi: 10.1002/(SICI)1096-9861(19961111)375:2<252::AID-CNE6>3.0.CO;2-1. [DOI] [PubMed] [Google Scholar]
- Robinson SR, Rapaport DH, Stone J. Cell division in the developing cat retina occurs in two zones. Brain Res Dev Brain Res. 1985;19:101–109. doi: 10.1016/0165-3806(85)90235-4. [DOI] [PubMed] [Google Scholar]
- Sauka-Spengler T, Baratte B, Shi L, et al. Structure and expression of an Otx5-related gene in the dogfish Scyliorhinus canicula: evidence for a conserved role of Otx5 and Crx genes in the specification of photoreceptors. Dev Genes Evol. 2001;211:533–544. doi: 10.1007/s00427-001-0191-2. [DOI] [PubMed] [Google Scholar]
- Sharma RK, Netland PA. Early born lineage of retinal neurons express class III beta-tubulin isotype. Brain Res. 2007;1176:11–17. doi: 10.1016/j.brainres.2007.07.090. [DOI] [PubMed] [Google Scholar]
- Sharma SC, Ungar F. Histogenesis of the goldfish retina. J Comp Neurol. 1980;191:373–382. doi: 10.1002/cne.901910305. [DOI] [PubMed] [Google Scholar]
- Smirnov EB, Puchkov VF. Characteristics of cellular proliferation in the developing human retina. Neurosci Behav Physiol. 2004;34:643–648. doi: 10.1023/b:neab.0000028299.76009.1c. [DOI] [PubMed] [Google Scholar]
- Snow RL, Robson JA. Ganglion cell neurogenesis, migration and early differentiation in the chick retina. Neuroscience. 1994;58:399–409. doi: 10.1016/0306-4522(94)90046-9. [DOI] [PubMed] [Google Scholar]
- Snow RL, Robson JA. Migration and differentiation of neurons in the retina and optic tectum of the chick. Exp Neurol. 1995;134:13–24. doi: 10.1006/exnr.1995.1032. [DOI] [PubMed] [Google Scholar]
- Stone J, Egan M, Rapaport DH. The site of commencement of retinal maturation in the rabbit. Vision Res. 1985;25:309–317. doi: 10.1016/0042-6989(85)90055-0. [DOI] [PubMed] [Google Scholar]
- Turner DL, Cepko CL. A common progenitor for neurons and glia persists in rat retina late in development. Nature. 1987;328:131–136. doi: 10.1038/328131a0. [DOI] [PubMed] [Google Scholar]
- Uga S, Smelser GK. Electron microscopic study of the development of retinal Mullerian cells. Invest Ophthalmol. 1973;12:295–307. [PubMed] [Google Scholar]
- Vardi N. Alpha subunit of Go localizes in the dendritic tips of ON bipolar cells. J Comp Neurol. 1998;395:43–52. [PubMed] [Google Scholar]
- Vardi N, Matesic DF, Manning DR, et al. Identification of a G-protein in depolarizing rod bipolar cells. Vis Neurosci. 1993;10:473–478. doi: 10.1017/s0952523800004697. [DOI] [PubMed] [Google Scholar]
- Vecino E, García-Briñón J, Velasco A, et al. Calbindin D-28K distribution in the retina of the developing trout (Salmo fario L.) Neurosci Lett. 1993;152:91–95. doi: 10.1016/0304-3940(93)90491-3. [DOI] [PubMed] [Google Scholar]
- Villar-Cheda B, Ábalo XM, Anadón R, et al. Calbindin and calretinin immunoreactivity in the retina of adult and larval sea lamprey. Brain Res. 2006;1068:118–130. doi: 10.1016/j.brainres.2005.11.014. [DOI] [PubMed] [Google Scholar]
- Villar-Cheda B, Ábalo XM, Villar-Cervino V, et al. Late proliferation and photoreceptor differentiation in the transforming lamprey retina. Brain Res. 2008;1201:60–67. doi: 10.1016/j.brainres.2008.01.077. [DOI] [PubMed] [Google Scholar]
- Völgyi B, Pollak E, Buzas P, et al. Calretinin in neurochemically well-defined cell populations of rabbit retina. Brain Res. 1997;763:79–86. doi: 10.1016/s0006-8993(97)00405-8. [DOI] [PubMed] [Google Scholar]
- Wässle H, Peichl L, Airaksinen MS, et al. Calcium-binding proteins in the retina of a calbindin-null mutant mouse. Cell Tissue Res. 1998;292:211–218. doi: 10.1007/s004410051052. [DOI] [PubMed] [Google Scholar]
- Watanabe M, Rutishauser U, Silver J. Formation of the retinal ganglion cell and optic fiber layers. J Neurobiol. 1991;22:85–96. doi: 10.1002/neu.480220109. [DOI] [PubMed] [Google Scholar]
- Weruaga E, Velasco A, Briñón JG, et al. Distribution of the calcium-binding proteins parvalbuminin, calbindin D-28k and calretinin in the retina of two teleosts. J Chem Neuroanat. 2000;19:1–15. doi: 10.1016/s0891-0618(00)00046-6. [DOI] [PubMed] [Google Scholar]
- Young RW. Cell proliferation during postnatal development of the retina in the mouse. Brain Res. 1985;353:229–239. doi: 10.1016/0165-3806(85)90211-1. [DOI] [PubMed] [Google Scholar]


