Abstract
The kinetics of osteogenic cells within secondary osteons have been examined within a 2-D model. The linear osteoblast density of the osteons and the osteocyte lacunae density were compared with other endosteal lamellar systems of different geometries. The cell density was significantly greater in the endosteal appositional zone and was always flatter than the central osteonal canals. Fully structured osteons compared with early structuring (cutting cones) did not show any significant differences in density. The osteoblast density may remain constant because some of them leave the row and become embedded within matrix. The overall shape of the Haversian system represented a geometrical restraint and it was thought to be related to osteoblast–osteocyte transformation. To test this hypothesis of an early differentiation and recruitment of the osteoblast pool which completes the lamellar structure of the osteon, the number and density of osteoblasts and osteocyte lacunae were evaluated. In the central canal area, the mean osteoblast linear density and the osteocyte lacunae planar density were not significantly different among sub-classes (with the exclusion of the osteocyte lacunae of the 300–1000 μm2 sub-class). The mean number of osteoblasts compared with osteocyte lacunae resulted in significantly higher numbers in the two sub-classes, no significant difference was seen in the two middle sub-classes with the larger canals, and there were significantly lower levels in the smallest central canal sub-class. The TUNEL technique was used to identify the morphological features of apoptosis within osteoblasts. It was found that apoptosis occurred during the late phase of osteon formation but not in osteocytes. This suggests a regulatory role of apoptosis in balancing the osteoblast–osteocyte equilibrium within secondary osteon development. The position of the osteocytic lacunae did not correlate with the lamellar pattern and the lacunae density in osteonal radial sectors was not significantly different. These findings support the hypothesis of an early differentiation of the osteoblast pool and the independence of the fibrillar lamellation from osteoblast–osteocyte transformation.
Keywords: apoptosis, osteoblast, osteocyte, secondary osteon
Introduction
The secondary osteons of cortical bone are formed by two sequential processes. Resorption is carried out by osteoclasts on the front of the advancing cutting cone, and apposition by osteoblasts. The latter cells become progressively enclosed by matrix which they have produced and subsequently are transformed into osteocytes. These changes have been interpreted as a continuum of differentiation (Bonucci, 1990; Franz-Odendaal et al., 2006), characterized by cells with intermediate characters, termed pre-osteocytes or osteoid-osteocytes (Palumbo, 1986). There is evidence that the loss of alignment of some cells from the osteoblast row, and their transformation into osteocytes, is correlated with a reduction of their synthetic activity (Marotti, 1976; Marotti et al., 1992). In transverse histological section, the concentric geometry of the Haversian system relies on osteoblast–osteocyte transformation. Osteoblasts in different phases of activity, and mesenchymal stem cells destined to be transformed into osteoblasts, are present in high numbers in periosteal tissue, endosteum and within the marrow. A further source of osteogenic cells is the vascular buds which follow the head of the cutting cone when it seeps into the mass of cortical bone during remodelling. Quantitative histological studies on bone formation have been carried out on human cancellous bone (Frost, 1969; Merz & Schenk, 1970).
The kinetics of the osteogenic cells has also been previously investigated using autoradiographic techniques (Owen, 1963; Owen & MacPherson, 1963) in the growing periosteal surface of the femur of young rabbits, where the main site of cell proliferation was the layer of pre-osteoblasts. No data, however, is available on the osteoblast–osteocyte kinetics within the closed system of the cortical secondary osteons, where there are no direct connections with the rich pool of osteoblastic cells found in the marrow and on the periosteal and endosteal surfaces. Here, the only source of osteoblasts lining the central canal of the forming osteon is the vascular buds and the connective tissue filling the canal. These remain behind following the cutting head osteoclasts (Parfitt, 1984, 1994).
The cutting cone closed system appears particularly appropriate for evaluating the kinetics of the osteogenic cells in secondary osteon remodelling. Its morphology suggests that behind the osteoclasts of the cutting head, there is an initial differentiation of a pool of osteoblasts, before the concentric lamellar structure of the osteon is completed (Pazzaglia et al., 2011). We used a morphometric approach, assessing cell density within the geometrical parameters of the system, to evaluate what determines the architecture of the Haversian system. By comparing the lamellar systems of secondary osteons and the endosteal surface of the marrow canal, we were able to evaluate lamellar systems characterized by different geometry.
Materials and methods
The study was carried out on the tibias of six male New Zealand white rabbits (Charles River Italia, Calco, Bergamo, Italy) of approximately 8 months of age, with a body weight between 3.0 and 3.5 kg. The care and use of experimental animals was consistent with procedures and regulations of the Italian Health Ministry. The rabbits were anaesthetized with ketamine chlorhydrate (Imagel) and xylazine (Rompum). The aorta and the vena cava were exposed through a midline abdominal incision. A 1.5-mm catheter was inserted in the aorta between the diaphragm and the origin of the renal arteries. The aorta was then tightly ligated with two knots around the catheter. The rabbit was euthanized with a further dose of the anaesthetic just prior to initiating perfusion of the vascular tree. The rabbits were injected with 300 mL of formaldehyde solution (2%) with a hand syringe at a pressure of 150–200 mmHg until the lower limbs were completely perfused. This process took approximately 5 s. To increase the pressure within the extracortical vascular tree, the vena cava was clamped with forceps prior to infusion: this procedure balanced the difference in resistance to perfusion between the extra-cortical and intra-cortical system. Using this technique, complete perfusion of the intra-cortical sector vessels can be achieved without dilation of the injected vessels (Pazzaglia et al., 1997).
Following infusion, the skin of the limbs was excised and both tibias were dissected from soft tissues and stored in neutral formaldehyde (10%). They were then decalcified in Osteosoft (Merck Sharp & Dohme) at 37 °C for 2 months. The proximal diaphysis (the segment between the tibio-fibular junction and a transverse plane about 5 mm below the proximal growth plate cartilage) was cut with a blade in a plane perpendicular to the major axis of the bone in four segments about 3 mm thick (four for each tibia). The sections were embedded in paraffin blocks in such a way that the sections were cut perpendicular to the longitudinal axis of the diaphysis, serially cut with a microtome and stained with haematoxylin–eosin.
The specimens were observed in bright field, in phase contrast and under linearly polarized light with the conventional 90° angle between polarizing and analyzing planes using an Olympus BX51 microscope. Digital images were captured with a telecamera Colorview IIIu mounted on the microscope.
DNA fragmentation in apoptotic cells within the lamellar systems of the cortex was identified by using the Dead End Colorimetric TUNEL System (Promega, Madison, WI, USA). Briefly, bone paraffin sections were deparaffinized, rehydrated through graded ethanol washes, and rinsed with phosphate-buffered saline (PBS). Proteinase K (20 μg mL−1) digestion was applied as a pre-treatment for 40 min at room temperature. Incubation with the rTdT reaction mix was performed for 1 h at 37 °C in accordance with the instructions provided by the manufacturer. Before the incubation with a streptavidin-HRP solution (diluted 1 : 500 in PBS, 30 min), a treatment with 3% hydrogen peroxide (5 min) was necessary to inhibit endogenous peroxidases. A signal was developed using a DAB solution. Negative (replacement of rTdT enzyme with water in rTdT reaction mix) and positive (sample treatment with 5 U mL−1 DNase I for 10 min) controls were performed. After mounting the coverslips with PBS/glycerol (1 : 1 dilution), slides were examined with an Olympus BH2 microscope and images were acquired with a DS-5M-L1 digital camera system (Nikon, Tokyo, Japan).
Morphometry
Only the canals cut in a plane transverse, or approximately transverse, to the long axis of the bone were considered in standard haematoxylin–eosin slides. Of these, a ratio between the minor and major diameter of >0.5 was used to select the longitudinal canals (Jowsey, 1966). The radius of the osteon with respect to the reversal line perimeter and that of the central canal was calculated as one-quarter the sum of the major and minor diameter, respectively. Each value assigned was the mean of two measurements. Another selection criterion was an intact outer perimeter delineated by a reversal line (Fig. 1A,B).
Fig. 1.
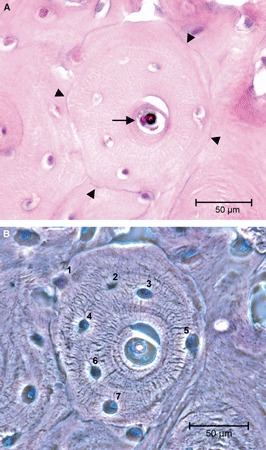
(A) Light microscopy in bright field illustrating a completely structured osteon satisfying the inclusion criteria for class ‘complete’, namely an uninterrupted reversal line at the periphery (arrowheads) and resting lining cells on the surface of the central canal (arrow). (B) Light microscopy in phase contrast, same field as (A), utilized to count osteocytes lacunae (=osteocytes) (haematoxylin–eosin). Bar: 50 μm.
Measurements were performed on the digital images using the program cell (Soft Imaging System, GmbH, Munster, Germany). For each of the four diaphyseal segments in 12 tibias (two for each rabbit), two slides were selected (those without foldings and well spread on the glass slide). The study was therefore carried out on a total of 96 slices with 303 secondary osteons, which met the selection criteria.
The following parameters were assessed in the osteons analyzed:
Osteon outer perimeter at the reversal line (μm).
Osteon inner perimeter or central canal perimeter (μm).
Osteon radius (μm), calculated as one-quarter the sum of the major and minor diameter.
Central canal radius (μm), calculated as one-quarter the sum of the central canal major and minor diameter.
Total osteon area (μm2).
Central canal area (μm2).
Osteon matrix area [difference between the total osteon area and the central canal area (μm2)].
Number of osteoblasts on the osteon inner perimeter (#).
Number of osteocytic lacunae within the osteon matrix area (#).
From these parameters we calculated:
The linear density of the osteoblasts on the osteon inner perimeter (#/μm).
The density of the osteon osteocytic lacunae (#/μm2).
The mean value ± standard deviation (SD) of the parameters assessed in each tibia was then calculated over the whole set of 12 tibias. According to the geometrical and morphological parameters, the secondary osteons were separated into three classes and a fourth control group was added, selecting zones of the endosteum with active apposition:
Complete: Completely structured osteons, with no active osteoblasts lining along the osteon inner perimeter and an un-notched outer perimeter (Fig. 1A,B).
Initial: Initial or early structuring osteons, with an osteon matrix area smaller than 10% of the total osteon area (Fig. 2A).
Intermediate: Intermediate structuring osteons, which included all un-notched secondary osteons not pertaining to the first two classes (Fig. 2B). Five sub-classes of the central canal area in this class of osteons were determined in such a way that each sub-class contained a similar number of observations (300–1000 μm; 1001–2000 μm; 2001–5000 μm; 5001–10 000 μm; >10 000 μm). These were introduced to test the osteoblast/osteocytic lacunae balance in a larger set of intermediate stages of osteon completion.
Endosteal: Endosteal appositional zone of the marrow canal, the depth of which was delimited by the most recent reversal line and by the row of active osteoblasts. The lateral margins were arbitrarily assigned but with an extension equal to the mean outer perimeter of the osteons. These zones were randomly selected on the endosteal perimeter (Fig. 2C) and their radius was calculated at low magnification (4×) on the whole section of the cortex as one-quarter the sum of the major and minor diameter of the endosteal perimeter.
Fig. 2.
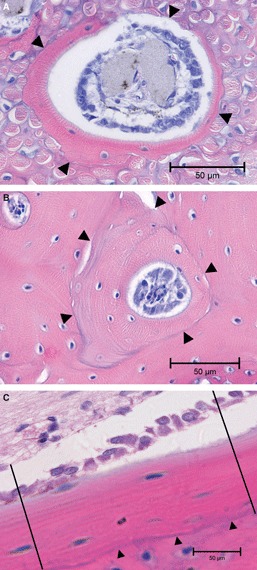
(A) Light microscopy in bright field illustrating an early structuring osteon satisfying the inclusion criteria for class B, namely the row of active osteoblasts on the canal dug by the cutting cone and a matrix area <10% of the total osteonal area. The thick collagen bundles in the bone matrix are a peculiar feature of the anterior tibial diaphysis due to the insertion of the patellar tendon on the tibial tuberosity. (arrowheads = reversal line). (B) Light microscopy in bright field, illustrating an intermediate structuring osteon satisfying the inclusion criteria for this class, namely an uninterrupted reversal line at the periphery (arrowheads) and a row of active osteoblasts on the central canal surface. (C) Light microscopy in bright field, illustrating an endosteal appositional zone with a limiting reversal line toward the outer bone surface (arrowheads) and the row of active osteoblasts on the endosteal surface. The lateral margins of the zone have been arbitrarily traced with two lines perpendicular to the endosteal surface (haematoxylin–eosin). Bar: 50 μm.
The total osteon and the central canal area of each osteon defined its class. This corresponded to the phase of its development (complete, initial and intermediate) and to a specific value of concavity of the concentric front of apposition. This latter value increases as osteon in-filling progresses. The surface available to lining osteoblasts conversely gradually reduced and this reduction was proportional to the difference between the mean outer and inner radii (Fig. 3). Intermediate structuring osteons were divided into five sub-classes of the central canal area in such a way that each sub-class contained a similar number of observations. The topographic distribution of osteocyte lacunae within the matrix area was assessed only in completely structured osteons (A). Four radial sectors were chosen in terms of two perpendicular lines, which formed a 45° angle with the major and minor diameter and passed through the centre of the osteon. The lines intercepted the border of the central canal and the peripheral reversal line, therefore delineating four radial sectors marked clockwise from the top right as I, II, III and IV (Fig. 4). The mean density of osteocytic lacunae was evaluated in each of the four radial sectors and compared among sectors.
Fig. 3.
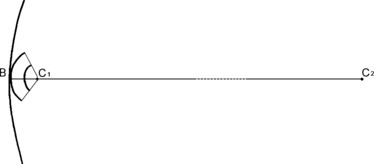
Schematic illustrating the radii of curvature of the osteon at the beginning and at the end of the closure process. This is compared with the radius of curvature of the endosteal appositional zone, which is of an order of magnitude varying from 20.5× for class ‘initial’ osteons to 41× for class ‘complete’ osteons. (C1B = osteon class A radius; C2B = marrow canal radius).
Fig. 4.
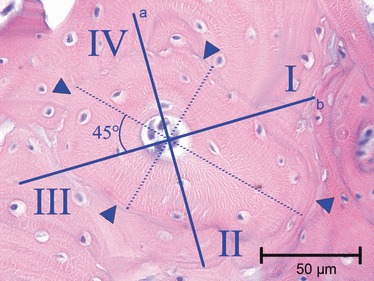
Light microscopy in bright field, illustrating how class ‘complete’ osteons were divided into sectors: the two perpendicular lines (A) and (B) form a 45° angle with the major and minor diameters and are traced through the central canal. The reversal line (arrowheads) is the peripheral border of the sector (haematoxylin–eosin). Bar: 50 μm.
Statistical analysis
The mean osteocytic lacunar density and the mean density of osteoblasts aligned on the central canal perimeter were compared using Student's t-test between all classes of complete, initial and intermediate osteons and the endosteal appositional zone. The frequency distribution of osteocytic lacunae, osteoblasts, relative densities for central canal sub-classes of intermediate structuring osteons were evaluated with the Pearson chi-square test (non-parametric). The distribution of osteocytic lacunae in the four radial sectors of completely structured osteons was compared with anova.
The measured parameters were examined independently by two observers (M.M. and F.S.). Inter-observer and intra-observer precision in linear measurements and in the count of cells and osteocytic lacunae was expressed as the coefficient of variation (CV) of repeated measurements on a percentage basis. The inter-observer precision was 2.6 and 3.7%, respectively, for the two independent measurements. The intra-observer precision was 1.4–2.5 and 2.7–0.9%, respectively.
Results
The hypothesis of an initial differentiation of a pool of osteoblasts was tested in a 2-D model of the secondary osteon development by comparing the osteoblast–osteocyte balance during the completion of osteon structures. There were 303 secondary osteons in the different phases of development: 122 (40.26%) completely structured osteons (A), 84 (27.72%) early structuring osteons (B) and 97 (32.02%) intermediate structuring osteons (C).
The endosteal appositional zones (D) were concave like the internal surface of the osteons but their mean radius, calculated as one-quarter the sum of the major and minor diameter of the medullary canal at the level of the examined section, was significantly higher (P < 0.001) than the mean outer perimeter radius of the osteons of all classes (Table 1). The endosteal zones mean radius varied from 20.5 to 41 times that of initial structuring and completely structured osteons, respectively (Fig. 3). In the latter, the mean inner radius was 3.5% of the outer osteonal radius, which corresponded to a mean circumference reduction of 227.3 ± 116.1 μm (73.5% of the initial osteon perimeter). In contrast, intermediate osteons had a mean outer radius greater than class ‘complete’, but the percentage reduction was lower (1.75%) because the inner radius was greater (Table 1).
Table 1.
Mean outer and inner radius of osteons (for endosteal appositional zone D, the mean marrow canal radius was measured). Mean matrix area, mean osteocytic lacunae and osteoblasts linear density of endosteal appositional zones of classes A, B and C osteons (when assessable).
| No. of osteons (n) | Mean outer radius (mm) | Mean inner radius (mm) | Mean matrix area (mm2) | Mean osteocytic lacunae density (n mm−2) | Mean osteoblast linear density (n mm−2) | |
|---|---|---|---|---|---|---|
| Endosteal appositional zone D | 19 | 1744.0 ± 130.8* | – | 6139.0 ± 6719.0 | 0.0019 ± 0.0005 | 0.08 ± 0.023* |
| Osteon class A | 122 | 42.24 ± 12.95* | 12.05 ± 3.99* | 5324.1 ± 3271.0 | 0.0016 ± 0.0007 | – |
| Osteon class B | 84 | 84.75 ± 70.92* | – | – | – | 0.003 ± 0.03* |
| Osteon class C | 97 | 63.20 ± 49.75* | 35.99 ± 34.52 | 5722.2 ± 3282.1 | 0.0015 ± 0.0008 | 0.006 ± 0.03* |
P < 0.001.
There were no significant differences (P = 0.503) of mean osteoblast linear density between initial and intermediate osteons, whereas in the endosteal appositional zone the density was significantly greater than in initial and intermediate classes, respectively (both P < 0.001). The class of osteons which had completed apposition was not comparable because, according to the selection criteria, they had no active osteoblasts on the central canal surface. The mean osteocytic lacunae density was not significantly higher (P = 0.075) in endosteal zones than in completely and intermediate structuring osteons, with no significant differences (P = 0.325) between the latter.
During the time interval represented by the completion of the osteon (from class ‘initial’ to class ‘complete’), the osteoblasts lining the central canal become osteocytes. No significant difference was found when the mean density of class A osteocytic lacunae was compared with the mean osteoblast linear density (Table 1).
Within the five sub-classes of intermediate osteons, the frequency of the mean osteoblast linear density was not significantly different in any sub-class. The frequency of the mean osteocytic lacunae density was significantly higher (P < 0.001) in the smaller sub-classes (300–1000 μm2), but not significant in the other sub-classes (Fig. 5). Comparing the mean numbers of osteocytic lacunae and osteoblasts in the same sub-classes of the central canal area of intermediate osteons, the mean number of osteoblasts decreased as the lamellar apposition advanced (smaller central canal area sub-classes). The mean number of osteoblasts was significantly greater than that of the osteocytic lacunae in the two largest sub-classes (5001–10 000 μm2 and >10 000 μm2; P < 0.001 in both), not significant in sub-classes 2001–5000 μm2 and 1001–2000 μm2 (P = 0.244 and P = 0.203, respectively) and significantly lower (P = 0.005) in the smallest central canal area sub-class (300–1000 μm2) (Fig. 6). In completely structured osteons, there were no significant differences of the mean density and of the mean number of osteocytic lacunae in radial sectors I, II, III, IV (Table 2) and the osteocytic lacunae were randomly positioned relative to the bright and dark bands of the osteon in polarized light. Often the position could not be assessed because of the large plump shape of the lacuna which extended across several bands. The lacunae were otherwise observed either inside the thickness of bright or dark bands (Fig. 7A,B) or occasionally between a dark and a bright band.
Fig. 5.
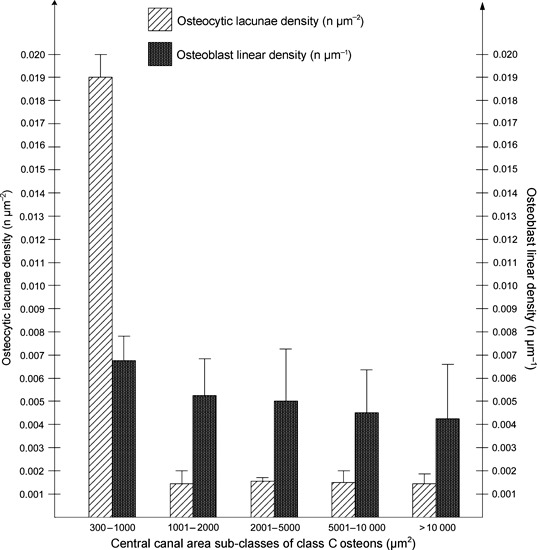
Distribution of the mean osteocytic lacunae and osteoblast linear density within the central canal area sub-classes of class C osteons.
Fig. 6.
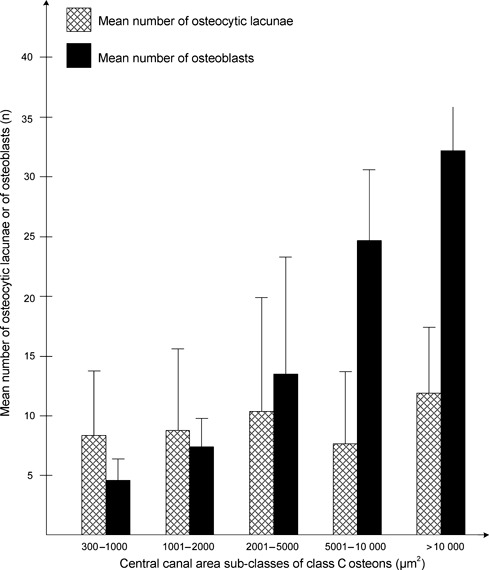
Distribution of the mean number and of osteocytic lacunae and osteoblasts within central canal area sub-classes of class C osteons.
Table 2.
Distribution of the mean number and density of osteocytic lacunae in radial sectors of class A osteons.
| Radial sector | No. of osteons | Mean no. of osteocytic lacunae | Mean density of osteocytic lacunae (n mm−2) |
|---|---|---|---|
| I | 122 | 2.24 ± 1.64 | 0.0017 ± 0.0011 |
| II | 122 | 2.16 ± 1.77 | 0.0014 ± 0.0009 |
| III | 122 | 1.86 ± 1.48 | 0.0013 ± 0.0009 |
| IV | 122 | 2.04 ± 1.61 | 0.0014 ± 0.0011 |
Fig. 7.
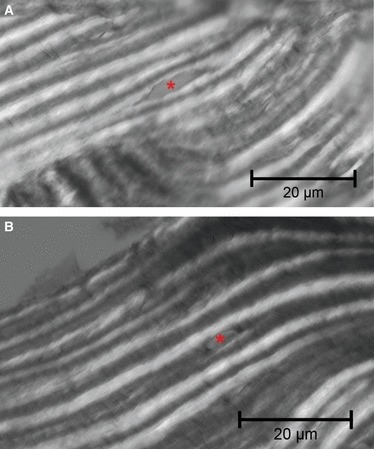
Light microscopy in polarized light with an osteocytic lacuna positioned within (A) bright band and (B) dark band (haematoxylin–eosin). Bar: 20 μm.
TUNEL staining positive cells for degraded DNA were frequently present inside the central canal of secondary osteons which had almost completed their lamellar sequence. The same osteons did not show a positive reaction within the osteocytes (Fig. 8).
Fig. 8.
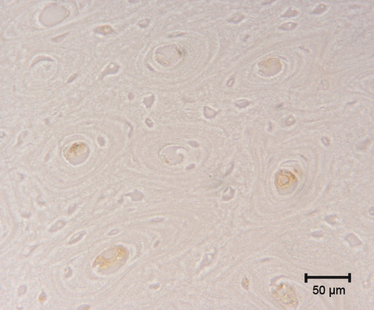
TUNEL staining. Positive cells for degraded DNA can be observed inside the central canal of secondary osteons which have almost completed their sequence of lamellae. No positive reaction is present in osteocytes of the same osteons. Bar: 50 μm.
Discussion
The structuring canal system of the rabbit cortical bone provided a model for the analysis of the osteoblast–osteocyte kinetics during the development of secondary osteons. The number of osteons studied was a fraction of the total number because only those with a ratio of the minor and major diameter of >0.5 with an intact perimeter satisfied the inclusion criteria. These restrictions had to be imposed to improve the precision of linear and area measurements. These parameters are influenced by the obliquity of the section plane with respect to the Haversian canal axis (Jowsey, 1966). In each image, the percentage of eliminated osteons varied from 0 to 10%. Indeed, the secondary osteons in rabbit tibia are clearly longitudinally oriented, less densely packed, smaller and have a more regular outline than in human cortical bone (Pazzaglia et al., 2007, 2008).
There were fewer completely structured osteons than initial and intermediate osteons because, in the former, all the osteons which had completed their lamellar organization were included. The continuous process of remodelling meant that there was a higher probability that their perimeter was eroded by new cutting cones developing. The distribution of osteon classes and the percentage of the class ‘complete’, however, were not used as an index of the remodelling rate of the slice of the examined diaphysis (Pazzaglia et al., 2010c) because of the limitation introduced by the second selection criterion (un-notched outer perimeter in all the classes). The purpose was not to measure the remodelling and the lamellar apposition rate (Ilnicki et al., 1966; Polig & Jee, 1990; Martin, 1994) but rather to investigate the osteoblast–osteocyte dynamics within the developing secondary osteons.
The kinetics of the osteogenic cells has been studied by Owen (1963) and Owen & MacPherson (1963) in histological sections of young rabbit femurs using autoradiographic techniques to investigate the rate at which cells enter and leave the three periosteal compartments: pre-osteoblasts, osteoblasts and osteocytes. The authors suggested that the number of cells added to the layers of pre-osteoblasts and osteoblasts, must balance the number leaving the same surface to become included within the bone as osteocytes. They also found that the osteoblasts in the Haversian canal stay on the surface much longer than in the periosteum and that they also lay down bone at a relatively slower rate. Further, it was observed that the osteoblasts may remain on the bone surface indefinitely, or may eventually be embedded as osteocytes, without any loss of pre-osteoblasts and osteoblasts by cell death.
Jaworski & Hooper (1980) used tritiated thymidine label in the ribs of Beagle dogs. They observed osteoblast recruitment in the Haversian system early in the first 14–24 h behind the cutting head, with the first labelled osteocytes appearing 9 days later in the distal closing cone. In these studies the geometry of the system was not considered. However, this parameter cannot be ignored in a study based on the osteogenic cell number and density within the secondary osteons. The surface available for the osteoblast apposition is predetermined by the size and shape of the tunnel dug by the cutting cone. The lamellae can form a complete ring or a sector arc when the osteoblasts are lining the concave surface and subsequently a progressive reduction of space becomes available for the aligned osteoblasts as the lamellar apposition advances. In a theoretical model of a perfectly circular osteon (Fig. 9) the space available is proportional to radial variation as osteon in-filling proceeds. Application to this model of the mean difference of the outer and inner radii of class ‘complete’ osteons corresponded to a circumference reduction of 73.5% of the initial osteon perimeter.
Fig. 9.
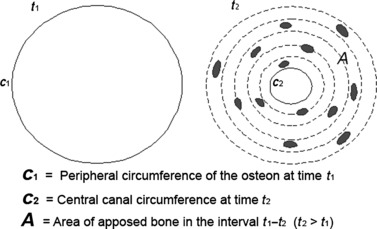
Scheme of the 2-D osteon geometrical model, depicting on the left a class B osteon at time t1 when lamellar apposition is starting and on the right the same osteon at time t2 (transformed in a class A1) when lamellar apposition has been completed.
The mean osteoblast linear density of class ‘initial’ and ‘intermediate’ osteons and the mean osteocytic lacunae density of class ‘complete’ and ‘intermediate’ osteons showed no significant differences in the actual situation depicted by the morphometric analysis of the histological sections. Instead, the endosteal zone analyzed in terms of the same parameters used for class ‘initial’ vs. ‘intermediate’ and ‘complete’ vs. ‘intermediate’ showed a significantly greater osteoblast linear density (P < 0.001). In contrast, the differences of osteocytic lacunae densities were not significant. These data reveal that the reduction of the central canal radius during osteon completion (corresponding to an increment of concavity of the appositional surface) does not influence either osteoblast or osteocyte density in the region of the apposed matrix. The endosteal zone has a much higher radius of curvature, 20.5–41 times that of the central canals, and the osteoblast linear density was significantly greater than the same parameter of the secondary osteons. This suggests that the geometry of the system has no, or a limited, influence on the osteogenic cell density. Other factors such as pre-differentiated or stem cell availability from the marrow, or the vascular anatomy, may explain this difference.
Due to the particular geometry of the osteonal system, with a short radius of curvature and a continuous reduction in the process of concentric apposition, the osteoblasts and the osteocytic lacunae (i.e. the osteocytes) can be kept constant. This is because some osteoblasts become misaligned with respect to the other osteoblasts of the same row and are embedded within the matrix. This process has been correlated to the secretion area of the osteoblast and to the extension of the contact of the osteocyte vascular processes with the osteoblasts of the row (Palumbo et al., 1990; Marotti et al., 1992). The mechanism that controls the transition of an osteoblast from the row to the osteocyte ‘position’ is not analyzed properly in 2-D transverse sections but is better appreciated observing the sheet of osteoblasts lining the inner surface of the Haversian canal with the SEM fractured surface technique (Pazzaglia et al., 2010a). That technique confirmed the 2-D geometrical mode of secondary osteons sectioned transversely to their longitudinal axis: time t1 marked the beginning of the concentric lamellar apposition and time t2 the end, when all the osteoblasts have been transformed into osteocytes or resting bone-lining cells on the vascular canal surface (Fig. 9). The model represents an approximation of the real shape: the measurements carried out on the real anatomical structure and applied to the model were affected by the bias of the shape discrepancy. The two parameters (linear osteoblast density and osteocyte density), however, are independent of the shape.
The structuring secondary osteon, unlike the endosteum or the periosteum, is peculiar in that it is a closed system. This means that osteogenic cell recruitment can only occur from the vascular buds which follow the cutting head osteoclasts or, in case of the osteocytes, which have been exposed by the same osteoclasts (Pazzaglia et al., 2011).
The cutting cone morphology and the spatial arrangement of the cells within suggest that an initial pool of osteoblasts differentiate from the pericytic cells around the vessel and spread on the surface of this sector of the cone (Fig. 10). Moreover, the osteoblasts recruited from the vascular buds, once they have started matrix deposition, cannot drift on the canal surface because they are anchored by the membrane processes penetrating the canalicula and their only freedom of displacement is in a radial direction towards the central vessel (Pazzaglia et al., 2010a). These observations are consistent with a pattern where the early differentiated osteoblasts must complete their circular apposition without a change of position along the canal. This therefore supports the hypothesis of an early differentiation and recruitment of the osteoblast pool without any further addition of cells by surface movement. The class ‘initial’ osteons represents the initial phase with the whole pool of differentiated cells distributed on the surface of the tunnel dug by the osteoclasts and no or few osteocytes. The class ‘complete’ represents the final phase, when all the osteoblasts have been transformed into osteocytes or in resting bone-lining cells of the central canal. The class ‘intermediate’, however, covers the intermediate phases where the number of osteoblasts and osteocytes should progressively balance. To test this hypothesis, the mean linear density of osteoblasts and the mean planar density of osteocytic lacunae were compared in sub-classes of central canal area of class ‘intermediate’ osteons. Sub-classes of the central canal area represent a larger set of intermediate stages of the osteon completion (Pazzaglia et al., 2010a). The observation of a balance between the osteoblast linear density and the osteocytic lacunae density and apoptotic changes in a percentage of osteoblasts would document that no new cells have been inserted into the system, allowing the monolayer layout to be maintained in all the phases of osteon development.
Fig. 10.

Scheme of the cutting cone geometry showing the internal relationship of the vascular loop with the distribution of the different cell types. The scheme was drawn from images obtained with the SEM fractured cortex technique (Pazzaglia et al., 2010b). Once the recruited osteoblasts have started matrix apposition, their position on the canal surface is set and the only displacement of the cell can be along radial vectors directed toward the central vessel. Oscl, osteoclasts of the cutting head; Ostcy1, osteocytes exposed by the osteoclasts and available for remodulation to osteoblasts; Ostcy2, osteocytes of lamellar cortex; Ostb, osteoblasts recruited from the vascular loop which adhered to the surface of the tunnel and started lamellar apposition; Rblc, resting bone-lining cells, corresponding to the remaining osteoblasts of the pool when lamellar apposition has been completed.
Two potential weaknesses could exist with regard to the method chosen to test the hypothesis of the initial pool of osteoblast recruitment:
osteoblast and osteocytic lacunae density have different physical dimensions (#/μm and #/μm2); however, the comparison is justified by the fact that it refers to same cell (the osteoblast transforming into osteocyte) within a closed system and that the 2-D assessment of osteocytic lacunae density was carried out on the same section where the linear density of osteoblasts was performed;
resting lining cells on the central canal surface of the completely structured osteons cannot be evaluated with the employed histological methods.
The osteoblast linear density was higher than the osteocytic lacunae density (Fig. 5), therefore the osteoblast–osteocyte balance can be determined by the percentage of osteoblasts transforming into resting bone-lining cells at the end of the osteon closure and by those undergoing apoptosis. The environment of the cortical cutting cones we examined is certainly very different from the marrow and from the trabecular basic multicellular units (BMUs) because of the scarcity of osteoblasts marrow stroma-derived precursors. However, we could observe a positive TUNEL reaction in the osteoblasts of those osteons which had nearly completed their lamellar structure, but not in those transformed into osteocytes.
It has been suggested that osteoblasts and osteocytes could be a major regulator of skeletal homeostasis in general and of the BMUs in particular (Landry et al., 1997; Hock et al., 2001; Jilka et al., 2007) and this control mechanism within the BMU has been referred to the balance of mitosis and apoptosis of the stroma-derived precursors of marrow osteoblast (Hughes & Boyce, 1997). The counting of the osteogenic cells we performed within the cutting cone (concerning differentiated osteoblasts lining the canal surface and actively committed to matrix deposition and the number of osteocytes deduced from that of the lacunae) could be balanced by the apoptosis of a percentage of osteoblasts. In the latter cells, the stereotyped sequence of the morphological features of apoptosis (Hughes & Boyce, 1997) was recognized only in osteoblasts in the late phases of the osteon completion. These findings supported the initial recruitment of a pool of osteoblasts and also confirmed a regulatory role of osteoblast apoptosis in the balance of osteoclasts–osteocytes within the cortical osteons. We could not observe apoptotic changes in lacunar osteocytes as reported in human bone by Noble et al. (1997). This would require that a certain percentage of osteocyte lacunae in the recently completed osteons remain empty because there is no known biological mechanism by which a new osteocyte could penetrate an already formed lamella.
Among the signalling pathways that regulate bone formation, sclerostin expressed by osteocytes has been the subject of much interest because of its role in bone modelling and remodelling at the level of the BMU (Van Bezooijen et al., 2004; Poole et al., 2005; Moester et al., 2010), where the protein expressed by the newly embedded osteocytes at the onset of osteoid mineralization may serve as a negative feedback to osteoblasts to prevent over-filling of the BMU. A similar feedback mechanism may be hypothesized in the in-filling process of the secondary osteons and it fits with our observation that apoptotic osteoblasts were frequently present inside the central canal of osteons which had almost completed their lamellar apposition. The precise mechanism by which sclerostin secreted by osteocytes inhibits Wnt-mediated bone formation is still unclear; however, it has been shown that the protein decreases the life span of osteoblasts by stimulating apoptosis (Sutherland et al., 2004).
Our findings are in contrast with the observations of Metz et al. (2003), who found a correlation between the osteonal osteocyte density, wall width and individual osteon porosity in ulnar cortices of the sheep labelled with fluorochromes. In the sheep model, the secondary osteons fill the whole thickness of the cortex and are bigger than in rabbit cortex. A further explanation of this discrepancy may rise from the method of measurement, as the authors estimated the volumetric density of osteocyte lacunae in relatively thick sections (100 μm). In a study with micro-CT, Hannah et al. (2010) found that the distribution of the measured volumes of osteocytic lacunae had two distinct peaks. However, those authors could not express the density evaluation because the external perimeter of the osteon cannot be determined with the method they used.
The matrix apposition by osteoblasts in secondary remodelling has the common feature of a lamellar pattern. It is structured in concentric layers within the osteon or in almost flat, parallel layers on the endosteal and periosteal surfaces. Each lamella is characterized by the orientation of its collagen fibrils and the general assemblage of this structure is usually represented with the twisted plywood model (Jones et al., 1975; Weiner et al., 1999; Ascenzi et al., 2004; Pazzaglia et al., 2011). Synthesis, extrusion and spatial organization of collagen fibrils are an expression of osteoblast activity within the forming osteon and at the other sites of bone growth and remodelling. Kerschnitzki et al. (2011) proposed that the formation of a highly oriented collagen matrix requires an alignment of osteoblasts on a solid substrate, where they collectively build new matrix. Without such a substrate, osteoblasts act in isolation and only form matrices without the larger scale order being apparent, but this is not observed in the secondary osteons or in the periosteal/endosteal lamellar systems. As concerns the osteoblast–osteocyte kinetics, the findings of Kerschnitzki et al. (2011) support the hypothesis of an early differentiation of the pool of osteoblasts which line up on the substrate and will complete the lamellar structure of the osteon.
So far it has been shown that the osteoblast committed to be transformed into osteocyte reduces its volume, the collagen synthesis and the secretory surface below the cell (Palumbo et al., 1990; Marotti et al., 1992), but these aspects have not been considered in the perspective of the synchronous and coordinated activity of a predetermined pool of osteogenic cells. We have previously documented that the pool of osteoblasts formed a network with their processes below the sheet of cells lying on the Haversian canal surface, and this particular cell pattern could be the mechanism which controls the regular orientation of the lamellar fibrils. According to this model, the change in direction of the collagen fibrils in the next lamella should be considered a phasic sequence of the synchronous activity of the osteoblast pool. This in turn can re-modulate the processes network below them at each renewal of apposition (Pazzaglia et al., 2010a). Our observations of a random distribution of the osteocytic lacunae in radial sectors of the osteon or of the position with respect to dark or bright bands in polarized light microscopy (corresponding to layers of parallel fibrils) are not discrepant with the earlier reported findings (Palumbo et al., 1990; Marotti et al., 1992). We have documented that the osteoblast–osteocyte transformation is not determined by the geometrical restraint of the osteon concavity, as the same occurs in the endosteal appositional zones where the radius of curvature is much higher. The question arises whether the position of the osteoblast committed to be transformed into an osteocyte could have any correlation with the phases of apposition and the change of the fibrils orientation in the sequential lamellae.
In this study a random distribution of the lacunae in radial sectors of the osteon and the absence of a regular position of the osteocytic lacunae relative to the bright and dark bands was observed in polarized light. A lacunar elongation parallel to the direction of the collagen has been suggested by microscopic observations (Marotti, 1979) and confirmed in a mathematical model of the osteon (Ascenzi et al., 2004). Furthermore, in the latter paper, the authors showed polarized microscopy figures of alternating osteon morphotype with osteocytic lacunae which appeared to be positioned either between neighbouring dark/bright bands or within the thickness of the band. These observations are consistent not only with the hypothesis that the osteoblast–osteocyte transformation is not determined by the geometric restraint of the osteon concavity, but also that the latter and the fibrillar organization of the lamellae are two independent phenomena controlled by different mechanisms.
Further research is needed to explore the structural organization of the intercellular matrix in Haversian bone and its relationship with the osteogenic cell kinetics.
Acknowledgments
This study was supported by research funds of Brescia University, Dipartimento di Specialità Chirurgiche, Scienze Radiologiche e Medico-forensi. The authors declare that they have no conflict of interest.
References
- Ascenzi MG, Andreuzzi M, Kabo JM. Mathematical modelling of human secondary osteons. Scanning. 2004;26:25–35. doi: 10.1002/sca.4950260105. [DOI] [PubMed] [Google Scholar]
- Bonucci E. The basic multicellular unit of bone. J Miner Electrolyte Metab. 1990;4:115–125. [Google Scholar]
- Franz-Odendaal T, Hall BK, Witten PK. Buried alive: how osteoblasts become osteocytes. Dev Dyn. 2006;235:176–190. doi: 10.1002/dvdy.20603. [DOI] [PubMed] [Google Scholar]
- Frost HM. Tetracycline-based histological analysis of bone remodelling. Calcif Tissue Res. 1969;3:211–237. doi: 10.1007/BF02058664. [DOI] [PubMed] [Google Scholar]
- Hannah KM, Thomas CD, Clement JG, et al. Bimodal distribution of osteocyte lacunar size in the human femoral cortex as revealed by micro-CT. Bone. 2010;47:866–871. doi: 10.1016/j.bone.2010.07.025. Epub 2010 August 3. [DOI] [PubMed] [Google Scholar]
- Hock JM, Krishnan V, Onyia JE, et al. Osteoblast apoptosis and bone turnover. J Bone Miner Res. 2001;16:975–984. doi: 10.1359/jbmr.2001.16.6.975. [DOI] [PubMed] [Google Scholar]
- Hughes DE, Boyce BF. Apoptosis in bone physiology and pathology. J Clin Pathol Mol Pathol. 1997;50:132–137. doi: 10.1136/mp.50.3.132. [DOI] [PMC free article] [PubMed] [Google Scholar]
- Ilnicki L, Epner BN, Frost HM, et al. The radial rate of osteon closure evaluated by means of in vivo tetracycline labelling in beagle dog rib. J Lab Clin Med. 1966;67:447–454. [PubMed] [Google Scholar]
- Jaworski ZF, Hooper C. Study of cell mimetics within evolving secondary Haversian systems. J Anat. 1980;131:91–102. [PMC free article] [PubMed] [Google Scholar]
- Jilka RL, Weinstein RS, Parfitt AM, et al. Quantifying osteoblast and osteocyte apoptosis: challenges and rewards. J Bone Miner Res. 2007;22:1492–1501. doi: 10.1359/jbmr.070518. [DOI] [PubMed] [Google Scholar]
- Jones SJ, Boyde A, Pawley JB. Osteoblasts and collagen orientation. Cell Tissue Res. 1975;159:73–80. doi: 10.1007/BF00231996. [DOI] [PubMed] [Google Scholar]
- Jowsey J. Studies of Haversian systems in man and some animals. J Anat. 1966;100:857–864. [PMC free article] [PubMed] [Google Scholar]
- Kerschnitzki M, Wagermaier W, Roschger P, et al. The organization of the osteocyte network mirrors the extracellular matrix orientation in bone. J Struct Biol. 2011;173:303–311. doi: 10.1016/j.jsb.2010.11.014. Epub 2010 November 23. [DOI] [PubMed] [Google Scholar]
- Landry P, Sadasivan K, Marino A, et al. Apoptosis is co-ordinately regulated with osteoblast formation during bone healing. Tissue Cell. 1997;29:413–419. doi: 10.1016/s0040-8166(97)80027-4. [DOI] [PubMed] [Google Scholar]
- Marotti G. Decrement in volume of osteoblasts during osteon formation and its effect on the size of the corresponding osteocytes. In: Meunier PJ, editor. Bone Histomorphometry. Levallois: Armour Montagu; 1976. pp. 385–397. [Google Scholar]
- Marotti G. Osteocyte orientation in human lamellar bone and its relevance to the morphometry of periosteocytic lacunae. Metab Bone Dis Rel Res. 1979;1:325–333. [Google Scholar]
- Marotti G, Ferretti M, Muglia MA, et al. A quantitative evaluation of osteoblast-osteocyte relationships on growing endosteal surface of rabbit tibiae. Bone. 1992;13:363–368. doi: 10.1016/8756-3282(92)90452-3. [DOI] [PubMed] [Google Scholar]
- Martin RB. On the histologic measurement of osteonal BMU activation frequency. Bone. 1994;15:547–549. doi: 10.1016/8756-3282(94)90279-8. [DOI] [PubMed] [Google Scholar]
- Merz WA, Schenk RK. A quantitative histological study of bone formation in human cancellous bone. Acta Anat. 1970;76:1–65. doi: 10.1159/000143476. [DOI] [PubMed] [Google Scholar]
- Metz LN, Martin RB, Turnev AS. Histomorphometric analysis of the effects of osteocyte density on osteonal morphology and remodelling. Bone. 2003;33:753–759. doi: 10.1016/s8756-3282(03)00245-x. [DOI] [PubMed] [Google Scholar]
- Moester MJ, Papapoulos SE, Löwik CW, et al. Sclerostin: current knowledge and future perspectives. Calcif Tissue Int. 2010;87:99–107. doi: 10.1007/s00223-010-9372-1. Epub 2010 May 15. [DOI] [PMC free article] [PubMed] [Google Scholar]
- Noble BS, Stevens H, Loveridge N, et al. Identification of apoptotic changes in osteocytes in normal and pathological human bone. Bone. 1997;20:273–282. doi: 10.1016/s8756-3282(96)00365-1. [DOI] [PubMed] [Google Scholar]
- Owen M. Cell population kinetics of an osteogenic tissue: I. J Cell Biol. 1963;19:19–32. doi: 10.1083/jcb.19.1.19. [DOI] [PMC free article] [PubMed] [Google Scholar]
- Owen M, MacPherson S. Cell population kinetics of an osteogenic tissue: II. J Cell Biol. 1963;19:33–44. doi: 10.1083/jcb.19.1.33. [DOI] [PMC free article] [PubMed] [Google Scholar]
- Palumbo C. A three dimensional ultrastructural study of osteoid-osteocytes in the tibia of chick embryos. Cell Tissue Res. 1986;246:125–131. doi: 10.1007/BF00219008. [DOI] [PubMed] [Google Scholar]
- Palumbo C, Palazzini S, Zaffe D, et al. Osteocyte differentiation in the tibia of newborn rabbits: an ultrastructural study of the formation of cytoplasmic processes. Acta Anat (Basel) 1990;137:350–358. doi: 10.1159/000146907. [DOI] [PubMed] [Google Scholar]
- Parfitt AM. The cellular basis of bone remodeling: the quantum concept reexamined in light of recent advances in the cell biology of bone. Calcif Tissue Int. 1984;36(Suppl 1):S37–S45. doi: 10.1007/BF02406132. [DOI] [PubMed] [Google Scholar]
- Parfitt AM. Osteonal and hemi-osteonal remodeling: the spatial and temporal framework for signal traffic in adult human bone. J Cell Biochem. 1994;55:273–286. doi: 10.1002/jcb.240550303. [DOI] [PubMed] [Google Scholar]
- Pazzaglia UE, Andrini L, Di Nucci A. The reaction to nailing or cementing of the femur in rats. A microangiographic and fluorescence study. Int Orthop. 1997;21:267–273. doi: 10.1007/s002640050165. [DOI] [PMC free article] [PubMed] [Google Scholar]
- Pazzaglia UE, Bonaspetti G, Rodella LF, et al. Design, morphometry and development of the secondary osteonal system in the femoral shaft of the rabbit. J Anat. 2007;211:303–312. doi: 10.1111/j.1469-7580.2007.00782.x. [DOI] [PMC free article] [PubMed] [Google Scholar]
- Pazzaglia UE, Bonaspetti G, Ranchetti F, et al. A model of the intracortical vascular system of long bones and of its organization: an experimental study in rabbit femur and tibia. J Anat. 2008;213:183–193. doi: 10.1111/j.1469-7580.2008.00932.x. [DOI] [PMC free article] [PubMed] [Google Scholar]
- Pazzaglia UE, Congiu T, Marchese M, et al. The shape modulation of osteoblast-osteocyte transformation and its correlation with fibrillar organization in secondary osteons. A SEM study employing the graded osmic maceration technique. Cell Tissue Res. 2010a;340:533–540. doi: 10.1007/s00441-010-0970-z. [DOI] [PubMed] [Google Scholar]
- Pazzaglia UE, Congiu T, Ranchetti F, et al. Scanning electron microscopy study of bone intracortical vessels using an injection and fractured surfaces technique. Anat Sci Int. 2010b;85:31–37. doi: 10.1007/s12565-009-0049-7. [DOI] [PubMed] [Google Scholar]
- Pazzaglia UE, Zarattini G, Giacomini D, et al. Morphometric analysis of the canal system of cortical bone: an experimental study in the rabbit femur carried out with standard histology and micro-CT. Anat Histol Embryol. 2010c;39:17–26. doi: 10.1111/j.1439-0264.2009.00973.x. [DOI] [PubMed] [Google Scholar]
- Pazzaglia UE, Congiu T, Zarattini G, et al. The fibrillar organization of the osteon and the cellular aspects of its development. A morphological study carried out with SEM fractured cortex technique. Anat Sci Int. 2011;86:128–134. doi: 10.1007/s12565-010-0099-x. [DOI] [PubMed] [Google Scholar]
- Polig E, Jee WSS. A model of osteon closure in cortical bone. Calif Tissue Int. 1990;47:261–269. doi: 10.1007/BF02555907. [DOI] [PubMed] [Google Scholar]
- Poole KE, van Bezooijen RL, Loveridge N, et al. Sclerostin is a delayed secreted product of osteocytes that inhibits bone formation. FASEB J. 2005;19:1842–1844. doi: 10.1096/fj.05-4221fje. Epub 2005 August 25. [DOI] [PubMed] [Google Scholar]
- Sutherland MK, Geoghegan JC, Yu C, et al. Sclerostin promotes the apoptosis of human osteoblastic cells: a novel regulation of bone formation. Bone. 2004;35:828–835. doi: 10.1016/j.bone.2004.05.023. [DOI] [PubMed] [Google Scholar]
- Van Bezooijen RL, Roelen BA, Visser A, et al. Sclerostin is an osteocyte-expressed negative regulator of bone formation, but not a classical BMP antagonist. J Exp Med. 2004;199:805–814. doi: 10.1084/jem.20031454. [DOI] [PMC free article] [PubMed] [Google Scholar]
- Weiner S, Traub W, Wagner HD. Lamellar bone: structure–function relations. J Struct Biol. 1999;126:241–255. doi: 10.1006/jsbi.1999.4107. [DOI] [PubMed] [Google Scholar]


