

Abstract
Aged individuals with Down syndrome (DS) develop Alzheimer's disease (AD) neuropathology by the age of 40 years. The purpose of the current study was to measure age-associated changes in APP processing in 36 individuals with DS (5 months–69 years) and in 26 controls (5 months–100 years). Alpha-secretase significantly decreased with age in DS, particularly in cases over the age of 40 years and was stable in controls. The levels of C-terminal fragments of APP reflecting alpha-secretase processing (CTF-alpha) decreased with age in both groups. In both groups, there was significant increase in beta-secretase activity with age. CTF-beta remained constant with age in controls suggesting compensatory increases in turnover/clearance mechanisms. In DS, young individuals had the lowest CTF-beta levels that may reflect rapid conversion of beta-amyloid (Aβ) to soluble pools or efficient CTF-beta clearance mechanisms. Treatments to slow or prevent AD in the general population targeting secretase activity may be more efficacious in adults with DS if combined with approaches that enhance Aβ degradation and clearance.
Keywords: Alzheimer's disease, Beta-amyloid, Oldest old, Trisomy 21
1. Introduction
Individuals with Down syndrome (DS) develop Alzheimer disease (AD) pathology in a progressive age-dependent manner [26,34,35,68] and as such, are at high risk for the development of dementia [29,33]. Clinical signs of dementia are more commonly observed when individuals are over 50 years of age [4,29,49,63]. By age 40 years, however, all individuals with DS have neuropathological changes including senile plaques and neurofibrillary tangles consistent with AD [35,67,68]. Senile plaques contain the β-amyloid peptide that is derived from a longer precursor protein, β-amyloid precursor protein (APP), the gene for which is on chromosome 21. In the most common form of DS, trisomy 21, chromosome 21 (21q21.2) is present in triplicate and leads to overexpression of APP [52]. However, despite life-long overexpression of APP in brain and in peripheral lymphocytes [47,52], Aβ accumulation in plaques does not typically begin until after the age of 30 years [35]. However, Aβ within diffuse plaques and compact plaques has also been observed occasionally in the temporal cortex of individuals under 40 years (i.e. in childhood, teens and in early adulthood) [30,31]. These reports suggest that APP processing may lead to the production of nonamyloidogenic fragments at younger ages and shift to favor production of Aβ in later years.
APP is cleaved by alpha-secretase leading to a nonamyloidogenic pathway [56]. The amyloidogenic pathway leading to Aβ production occurs by sequential cleavage of APP by β-secretase and subsequently by γ-secretase [43,56]. β-secretase has now been identified as beta-site APP cleaving enzyme or BACE [65]. Once Aβ is cleaved from APP it may first appear in soluble form either within neurons or in the extracellular space. Higher levels of soluble Aβ are observed in DS fetal brain and in brains from adults up to 61 years of age than in tissue from controls [61]. Thus, individuals with DS exhibit higher levels of soluble Aβ, which may interact with both developmental and aging processes but conversion into more insoluble forms with age may be a critical event related to plaque accumulation. Additionally, Aβ degradation and clearance mechanisms may also be critically involved with the accumulation of plaques in DS with increasing age [16]. To our knowledge, no studies have shown age related increases in insoluble Aβ in the brains of DS subjects nor linked functional changes in secretase activity to Aβ. Further evidence that Aβ and APP processing play a critical role in AD pathogenesis and relevant for DS is a recent report of several families with early onset AD associated with duplication of the APP locus [51]. These individuals develop dementia around the age of 50 years and develop both parenchymal and vascular Aβ deposition.
We hypothesized that age-dependent increases in beta-secretase and/or decreases in alpha-secretase activity may be associated with increased production of amyloidogenic fragments of APP and with Aβ deposition. We predicted prior to the age of 30 years, when Aβ typically begins to accumulate in plaques, that secretase activity may be relatively stable. After this age, we hypothesized that secretase activity to show either decreases (alpha-secretase) or increases (beta-secretase). Thus, we assayed secretase activity in the midfrontal cortex of DS cases ranging in age from 5 months to 69 years in comparison to a series of control cases. Last, we measured Aβ1–40 and Aβ1–42 in formic acid soluble fractions of frozen frontal cortex to link Aβ to secretase activity. The midfrontal cortex was selected because it is vulnerable to age-associated AD pathology in DS and may be an early site of Aβ pathogenesis in DS [22].
2. Methods
2.1. Subjects
Frozen tissue blocks from the midfrontal cortex were obtained from a total of 35 individuals (22M, 13F) with DS ranging in age from 5 months to 69 years of age. A series of 18 control cases (11M, 7F) ranging in age from 5 months to 69 years were used as an age-matched group for comparison. An additional series of “oldest old” autopsy cases were also included to provide a broad range of ages for normal aging and included eight subjects ranging in age from 93 to 100 years (4M, 4F). DS and young or nondemented aged control cases were obtained from three sources: (1) the UCI-ADRC Brain tissue repository; (2) Brain and Tissue Banks for Developmental Disorders, University of Miami and; (3) The University of Washington Alzheimer's Disease Research Center. Detailed individual data are presented in Table 1. Either 10% buffered formalin or 4% paraformaldehyde fixed sections from the contralateral midfrontal cortex (Brodmann Area 9) was available for a total of 19/36 DS cases and for 20/26 control cases for immunohistochemistry. Frozen samples from the contralateral hemisphere and additional cases were taken from the same region but dissected into three blocks to assay Aβ concentration and secretase activity levels.
Table 1. Case demographics.
| Case | Age | Sex | PMI | Diagnosis | Formic acid (pM/mg) | IHC | ||
|---|---|---|---|---|---|---|---|---|
| Aβ1–42 | Aβ1–40 | AT8 | Aβ42 | |||||
| Controls | ||||||||
| 1 | 0.45 | M | 2 | Control | 107.90 | 19.50 | N/A | N/A |
| 2 | 2 | M | 10 | Control | 222.90 | 9.80 | 0.03 | N/A |
| 3 | 9 | F | 20 | Control | 79.90 | 18.80 | 0.26 | 0.00 |
| 4 | 13 | F | 17 | Control | 181.10 | 10.80 | 0.29 | 0.00 |
| 5 | 16 | F | 10 | Control | 105.30 | 13.50 | 0.28 | 0.02 |
| 6 | 19 | F | 7 | Control | 124.30 | 18.40 | 0.05 | 0.00 |
| 7 | 23 | M | 7 | Control | 194.50 | 8.10 | 0.04 | 0.02 |
| 8 | 34 | M | 6 | Control | 98.90 | 20.10 | 0.02 | 0.00 |
| 9 | 39 | M | 10.5 | Control | N/A | N/A | 0.02 | N/A |
| 10 | 41 | F | 5 | Control | 104.70 | 16.00 | 0.01 | N/A |
| 11 | 41 | M | 6 | Control | N/A | N/A | 0.48 | N/A |
| 12 | 42 | M | 18 | Control | 90.40 | 8.60 | 0.15 | 0.00 |
| 13 | 54 | F | 5 | Control | 174.00 | 20.00 | 0.02 | 0.00 |
| 14 | 64 | F | 8 | Control | 99.70 | 1.70 | 0.01 | 1.19 |
| 15 | 65 | M | 4.5 | Control | 349.00 | 123.60 | 0.02 | 11.89 |
| 16 | 66 | M | 10.4 | Control | 89.00 | 26.10 | 0.01 | 0.00 |
| 17 | 67 | M | 2.7 | Control | 76.40 | 10.80 | 1.52 | 0.00 |
| 18 | 69 | M | 6.6 | Control | N/A | N/A | 0.01 | 0.00 |
| Mean | 36.9 | 8.65 | 139.87 | 21.72 | 0.191 | 1.009 | ||
| Down syndrome | ||||||||
| 1 | 0.42 | F | 23 | DS | 222.50 | 12.50 | N/A | N/A |
| 2 | 1 | F | 28 | DS | 106.20 | 14.20 | 0.04 | 0 |
| 3 | 1 | F | 24 | DS | 199.50 | 18.50 | N/A | N/A |
| 4 | 1.9 | M | 18 | DS | 185.60 | 9.20 | N/A | N/A |
| 5 | 2 | M | 17 | DS | 84.00 | 6.70 | 0.10 | N/A |
| 6 | 10 | M | 17 | DS | 111.20 | 12.40 | N/A | N/A |
| 7 | 14 | M | 25 | DS | 55.10 | 29.70 | N/A | N/A |
| 8 | 15 | M | 14 | DS | 240.70 | 13.50 | N/A | N/A |
| 9 | 19 | M | 14 | DS | 172.20 | 10.70 | N/A | N/A |
| 10 | 23 | M | 15 | DS | 256.40 | 14.90 | N/A | N/A |
| 11 | 24 | M | 24 | DS | 157.40 | 24.60 | 0.01 | 0 |
| 12 | 31 | M | 4 | DS | N/A | N/A | 0.03 | a |
| 13 | 37 | M | 11 | DS+AD | N/A | N/A | 0.21 | 16.82 |
| 14 | 40 | M | 10 | DS+AD | 1021.70 | 1017.70 | 21.84 | 15.75 |
| 15 | 41 | M | 24 | DS | 974.70 | 19.40 | N/A | N/A |
| 16 | 42 | M | 16 | DS+AD | N/A | N/A | 0.02 | 14.2 |
| 17 | 44 | F | 16 | DS+AD | 2659.78 | 225.83 | N/A | N/A |
| 18 | 45 | F | 13 | DS | 259.20 | 138.30 | 0.24 | 12.61 |
| 19 | 46 | M | 6.3 | DS+AD | 652.40 | 771.20 | 29.60 | 17.01 |
| 20 | 47 | F | 5 | DS+AD | 805.80 | 697.40 | 30.47 | N/A |
| 21 | 47 | F | 24 | DS+AD | 357.80 | 30.30 | N/A | N/A |
| 22 | 48 | F | 1.5 | DS+AD | 545.70 | 1008.90 | 0.01 | 9.64 |
| 23 | 48 | M | 3 | DS+AD | 499.10 | 440.20 | 6.86 | 11.14 |
| 24 | 48 | F | 3.3 | DS+AD | 1621.44 | 181.20 | N/A | N/A |
| 25 | 49 | M | 5 | DS+AD | 790.27 | 328.07 | N/A | N/A |
| 26 | 50 | F | 5 | DS+AD | 831.30 | 190.60 | 49.08 | N/A |
| 27 | 51 | M | 20 | DS+AD | 896.60 | 1607.60 | N/A | N/A |
| 28 | 51 | M | 4.8 | DS+AD | 492.60 | 1405.40 | 43.22 | 23.7 |
| 29 | 54 | F | 5.25 | DS+AD | N/A | N/A | 1.91 | 7.54 |
| 30 | 55 | M | 3.1 | DS+AD | 1216.87 | 1304.42 | N/A | N/A |
| 31 | 58 | M | 3.3 | DS+AD | 1205.40 | 1337.60 | 29.25 | 22.56 |
| 32 | 60 | M | 3.3 | DS+AD | 1905.59 | 2241.33 | N/A | N/A |
| 33 | 61 | M | 10.5 | DS+AD | 818.00 | 366.70 | 56.19 | 14.79 |
| 34 | 62 | F | 3 | DS+AD | 633.68 | 3425.79 | 28.17 | 19.58 |
| 35 | 62 | F | 3 | DS+AD | 1330.00 | 1486.20 | N/A | N/A |
| 36 | 69 | F | 24 | DS+AD | N/A | N/A | N/A | 20.9 |
| Mean | 37.7 | 12.4 | 687.38 | 593.26 | 16.51 | 13.75 | ||
| Oldest old | ||||||||
| 1 | 93 | F | 2.2 | Control | N/A | N/A | N/A | N/A |
| 2 | 94 | M | 5.3 | Control | N/A | N/A | N/A | N/A |
| 3 | 95 | F | 3.2 | Control | N/A | N/A | N/A | N/A |
| 4 | 95 | F | 4.2 | Control | N/A | N/A | N/A | N/A |
| 5 | 96 | M | 3.8 | Control | N/A | N/A | N/A | N/A |
| 6 | 96 | F | 5 | Control | N/A | N/A | N/A | N/A |
| 7 | 97 | M | 7 | Control | N/A | N/A | N/A | N/A |
| 8 | 100 | M | 3.8 | Control | N/A | N/A | N/A | N/A |
| Mean | 95.8 | 4.31 | ||||||
PMI, post mortem interval in hours; IHC, immunohistochemistry; ELISA, cases used for Aβ and secretase experiments with individual values being reported for amounts of insoluble (formic acid extracted) Aβ1–40 and Aβ1–42; AT8/Aβ42, “loads” for individual subjects for AT8 (neurofibrillary tangles) and for Aβ1–42 (senile plaques); N/A, not available.
Diffuse plaques were observed and reported in a previous publication [21].
2.2. Immunolabeling experiments
Fixed samples from the midfrontal cortex were placed on blocks for sectioning. Free-floating 50 μm-thick serial sections were subsequently collected using a vibratome. Senile plaque formation was visualized using a polyclonal antibody against Aβ1–42 (Biosource International, CA) and neurofibrillary tangles were visualized using AT8 (Endogen, Woburn, MA) as published previously [23]. All sections to be incubated in anti-Aβ42 were pretreated with 90% formic acid for 4 min [27]. They were then treated with 3% hydrogen peroxide in 10% methanol in Tris solution for 30 min to block endogenous peroxidase activity prior to incubation in the primary antibody overnight at room temperature. Sections were subsequently incubated in either biotinylated anti-mouse or anti-rabbit IgG secondary antibodies, followed by incubation in avidin-biotin complex (Vector Laboratories, Burlingame, CA). Positive immunoreactivity was visualized using a brown 3,3′-diaminobenzidine (DAB) substrate kit (Vector Laboratories). Sections were mounted on glass slides, allowed to dry overnight, dehydrated in a series in increasing concentrations of alcohol and coverslipped with Depex mounting media. Controls were performed to rule out nonspecific immunostaining by eliminating the primary or secondary antibody. All controls were negative. In three control cases (#14–16), serial sections were also mounted on glass slides and stained with thioflavin-S using previously published methods [21] to establish if Aβ positive (cases #14 and 15) immunostaining represented diffuse (thio-S negative) or neuritic plaques (thio-S-positive) relative to a case without Aβ immunostaining (case #16).
2.3. Aβ ELISA
Aβ was sequentially extracted from approximately 200 mg of frozen midfrontal cortex in 0.1 M Tris pH 6.8 with 1% SDS and a Protease inhibitor Cocktail Kit (MP Biochemicals Inc.) containing 0.4 mg/ml AEBSF, 1mg/ml EDTA-Na2, 1 μg/ml Leupeptin and Pepstatin A at 1ml buffer/150 mg wet weight tissue using Potter Elevehjem 10 ml Wheaton glass tube and centrifuged at 4°C at 100,000 × g for 1h. The pellet was resuspended in 70% formic acid and sonicated on ice. After centrifugation at 4 °C at 100,000 × g for 1 h, the supernatant was collected and stored at −80 °C until assayed. Brain samples were run in triplicate on ELISA plates coated with a monoclonal anti-Aβ1–16 antibody (kindly provided by Dr. William Van Nostrand, Stony Brook University, Stony Brook, NY) and detection was by monoclonal HRP conjugated anti-Aβ1–40 (MM32-13.1.1) and anti-Aβ1–42 (MM40-21.3.1) antibodies (kindly provided by Dr. Christopher Eckman, Mayo Clinic Jacksonville, Jacksonville, CA) [9,28,37]. For standards, Aβ1–40 and Aβ1–42 (Bachem California, Inc., Torrance, CA) were used after a pretreatment with HFIP to prevent fibril formation.
2.4. Measurement of secretase activity
Two samples of frozen midfrontal cortex immediately adjacent to the sample taken for Aβ ELISAs were processed according to the protocols provided by the commercial supplier of the Secretase Activity Kits (R&D Systems, Inc., Minneapolis, MN) and reported in another publication [50]. The assay tests for secretase activity by providing secretase-specific peptide conjugated to the reporter molecules EDANS and DABCYL. In the uncleaved form, the fluorescent emissions from EDANS are quenched by the physical proximity of the DABCYL moiety. Cleavage of the peptide by secretase leads to a separation of the two reporter molecules and releases a fluorescent signal that is proportional to the enzymatic activity. All assays were completed in triplicate. α-and β-secretase activity was assayed after first conducting preliminary studies to establish the amount of protein to use and the duration of the reaction for individual assays. The data presented reflect the enzymatic activity of each secretase at a protein concentration and reading time that falls on the unsaturated and linear portion of the enzyme reaction curve. For the α-secretase activity assay, 150 μg frontal cortex total protein was used (3.0 μg/μl in 50 μl total, OD read at 25 min) and for β-secretase, 2.5 μg (0.05 μg/μl in 50 μl total, OD read at 25 min) was used.
2.5. Aβ and NFT load quantification
The procedure for obtaining Aβ loads has been reported previously [24]. Briefly, Aβ or NFT immunostaining was captured using a 2.5 photo eyepiece, a Sony high-resolution CCD video camera (XC-77), the built-in video capture capabilities of a Macintosh 8100/80AV, and NIH Image 1.59b5. For every case, 10 images (525 μm × 410 μm each) were captured with a 20× objective. Sampling consisted of five adjacent images from the superficial cortical layers and five from the deep cortical layers (for a total of 10 images per case × 24 cases = 240 samples). The cross-sectional area occupied by Aβ or AT8 in each individual image was quantified using gray scale thresholding, which separated positive staining from background and calculated the percentage of area occupied by Aβ immunoreactivity. These measures were intended to provide an estimate of the extent of senile plaque and neurofibrillary tangle accumulation for case characterization. Note that loads of less than 1% typically represents background levels of noise.
2.6. Total APP and C-terminal fragments Western blots and quantification
Total APP and C-terminal fragments were quantified from the same brain homogenate that Aβ was extracted, using the SDS soluble fraction. For total APP detection, samples were diluted in a loading buffer containing 2-mercaptoethanol (βME) as a reducing agent and SDS as a denaturing agent, were boiled 5 min, and loaded onto a 4–20% Tris-HCl criterion gel. The running buffer used is generic for the SDS-PAGE buffer system: Glycine-Tris-SDS. A 10 μg total protein was loaded in each well. Proteins were transferred onto polyvinylidene difluoride (Sequi-blot PVDF from BioRad) for immunoblotting. For detection of the C-terminal fragments (CTFs) of APP, samples were diluted in a loading buffer containing 20× XT reducing agent and 4× XT sample buffer, then were boiled 5 min, and loaded onto a 10% Bis-Tris Criterion gel that has a near neutral pH for improved protein stability. A 30 μg of total protein was loaded into each well. The running buffer used is XT-MES to improve the resolution of the low molecular proteins. Proteins were transferred onto nitrocellulose (Trans-blot 0.2 μm from BioRad) for immunoblotting.
For both Westerns, the membranes were blocked 1 h at room temperature in 5% non-fat milk in TTBS (10 mM Tris pH 7.6, 100 mM NaCl, and 0.1% Tween 20) then incubated overnight at 4 °C in mouse monoclonal anti-APP A4 Clone 22C11 1:2000 (Chemicon) for APP, or in CT20 at 1:500 (kindly provided by Dr. Pritam Das [40]) for the CTFs. CT20 (also called O443) detects CTF-α, CTF-β and CTF-γ and full length APP [48]. After a series of washes in TTBS, membranes were incubated for an hour at room temperature in horseradish peroxidase conjugated goat anti-mouse or anti-rabbit respectively (Biorad). Proteins were visualized using Supersignal West Pico chemoluminescent substrate (Pierce). Membranes were exposed to CL-XPosure film (Pierce) and for quantification, exposure times used were established as being below the saturation range in preliminary studies. Proteins of interest were quantified by measuring the intensity using Scion Image software and CTFs were expressed as a proportion of full length APP measured on the same Western blot experiments.
2.7. Data analysis
Initially a one-way analysis of variance (ANOVA) was used to test differences in average formic acid extracted Aβ, secretase activity and CTF among cases in four groups—young controls, aged controls, young DS, and aged DS. Age groups were separated into under 40 years and over 40 years with the rationale that virtually all individuals with DS have the neuropathology of AD after 40 years. Thus, this classification was used to represent pre-AD and post-AD pathology in the DS cases. Post hoc comparisons were made using a Bonferonni correction. Linear regression models were used to test whether age and/or post mortem interval (PMI), if included as covariates would change our initial conclusions. That is, the significance of the slope of these potential covariates with each outcome was tested as well as the need for an age-by-group (DS and CTL) or a PMI-by-group interaction term (to check the assumption of parallelism). Outcome measures of interest were Aβ or secretase activity and all initial models included age, group, and PMI as independent variables. To detect a significant relationship between Aβ with secretase activity both Pearson product moment correlations or partial correlations were calculated that corrected for age. When necessary, raw data were log transformed to satisfy the equality of variance assumption.
3. Results
As shown in Table 1, the average age of the control cases (mean = 36.9, S.E. = 5.6) was not significantly different from the DS cases (mean = 37.5, S.E. = 3.5), (t(51) < 1, p = 0.93). Control cases over the age of 90 years were of an average age of 95.8 years (S.E. = 0.75). The post mortem interval in the DS cases (mean = 12.4, S.E. = 1.4) was higher than in the controls (mean = 8.65, S.E. = 1.2) and the difference approached significance (t(51) = 1.70, p = 0.095). This is due to the long post mortem intervals in the youngest DS cases. Thus, in subsequent analyses, the effect of post mortem interval was evaluated for each outcome measure. If there was a significant contribution of PMI to an outcome measure of interest it was included as a covariate in subsequent analyses. Table 1 also shows plaque loads (Aβ42) and neurofibrillary tangle loads (AT8) for individual cases. In the control group, one 67-year-old subject (case #17) showed a moderate tangle load in the midfrontal cortex and two subjects, a 64 (case #14) and 67-year-old (case #15), showed mild plaque accumulation (data not shown). Thioflavine-S staining was negative in these two older control cases suggesting that plaques were of the diffuse subtype (data not shown). In the DS group, we observed little plaque and tangle formation by immunohistochemistry in three subjects 24 years and younger that had available fixed tissues. In a 31-year-old subject (case #12), we observed virtually no tangle accumulation but diffuse plaque accumulation as reported in a previous study [21] although fixed tissue from this case was not available for the current study (data not shown). In a 37-year-old case (case #13), significant plaque but not tangle accumulation was observed. In cases 40 years and older (n = 13 with available fixed tissues), plaques were consistently observed but neurofibrillary tangles were only observed in 10/13 cases (data not shown).
3.1. Aβ1–40/1–42 as a function of age
To detect age and group differences in formic acid extracted Aβ, subjects were first compared using a one-way ANOVA with four groups formed by diagnosis (DS versus CTL) and age (<40 years and >40 years) (Fig. 1). Post hoc comparisons with Bonferroni adjustment indicate that average Aβ1–40/1–42 concentration for young control cases, young DS cases and aged control cases did not differ but aged DS individuals had significantly higher average Aβ values (p < 0.0005) than those of the other groups. Thus, age was a significant factor in the accumulation of Aβ in DS but not in control cases.
Fig. 1.

Insoluble Aβ is higher in DS brain than in control brain after the age of 40 years of age. Both Aβ1–40 (A) and Aβ1–42 (B) are consistent in young controls, aged controls and in young individuals with DS. However, DS cases over the age of 40 years (old DS) show significantly higher formic acid extracted Aβ relative to the other three groups. Individual data points are shown, horizontal lines represent means and the top of the box illustrates the 75th percentile and the bottom the 25th percentile. Young controls <40 years, old controls >40 years, young DS <40 years, old DS >40 years.
We next checked whether or not the inclusion of PMI as a covariate would change our conclusions by fitting regression models with Aβ1–40 and Aβ1–42 as outcome measures and age, diagnosis group, and PMI as independent variables. Age-by-group (DS and CTL) and PMI-by-group interaction terms were also included to check for parallelism. For models of each outcomes measure, the age-by group interaction term was highly significant (p < 0.0005) indicating the groups were differentially affected by the aging process. Because of this, subsequent analyses to test diagnosis group differences (and also the influence of PMI) were stratified into younger and older age groups.
In agreement with our initial analyses, no differences between young DS and young control individuals were identified in average Aβ1–40 and Aβ1–42 concentrations and also, the PMI slope was not significant for either measure. However, when focusing on Aβ1–40 for aged control and aged DS individuals, PMI has a significant negative slope (F(1,17) = 9.9, p = 0.006) while the interaction between PMI and group was not significant. This suggests that in older subjects, Aβ1–40 declines as the PMI interval increases possibly suggesting instability in Aβ1–40 in these samples. In an ANCOVA after adjusting for PMI, a highly significant difference between DS and CTL groups in average Aβ remains (F(1,18) = 44.5, p < 0.0005). When modeling Aβ1–42, PMI was not a significant predictor, so our initial conclusion regarding significant DS /CTL differences is not altered.
Fig. 2 further shows the strong association between age and Aβ1–40 (r = 0.855, p < 0.0005) and Aβ1–42 (r = 0.890, p < .0005) in the DS subjects but not in the control subjects. If the Aβ1–40 calculations are adjusted to remove the effect of PMI, the partial correlation drops to 0.718 which still remains highly significant (p < 0.0005). Adjusting the correlation of age with Aβ1–42 for the effect of PMI, the partial correlation is 0.767 (p < 0.0005). The relatively stable amounts of Aβ1–40 and Aβ1–42 in controls and progressively increasing levels as a function of age in DS is also reflected in the ratio of Aβ1–42:Aβ1–40. In control cases, the ratio between Aβ1–40 and Aβ1–42 remains stable with age with approximately 80% of Aβ consisting of Aβ1–42. In contrast, in DS, the ratio of Aβ1–42 to Aβ1–40 is stable until after age 30 years and then shows a rapid decrease (Fig. 3). In three DS cases over the age of 40 years, Aβ40 level was higher than Aβ42 but overall, we observed higher levels of Aβ42 in the insoluble fraction than Aβ40.
Fig. 2.

Progressive rise in insoluble Aβ42 with age and a rapid rise in Aβ40 after 40 years of age in DS. Aβ40 remains constant with age in controls (A) but shows a rapid increase after the age of 40 years in DS (B). Aβ1–42 remains constant with age in controls (C) and rises progressively with age in DS (D).
Fig. 3.

A decrease in the ratio of Aβ1–42:Aβ1–40 occurs in individuals with DS after the age of 40 years. (A) The ratio of Aβ1–42:Aβ1–40 remains constant at greater than 80% in control subjects. (B) In contrast, the ratio of Aβ1–42 to Aβ1–40 is stable until approximately 40 years of age in DS and then shows a steep drop with increasing age.
3.2. Secretase activity
To detect age and group effects on alpha-secretase activity in the frontal cortex, a one-way ANOVA was used. Fig. 4A shows that there is considerable overlap in alpha-secretase activity across patient groups and age groups. Neither these age and group differences nor PMI contributed significantly to the outcome. To further confirm the lack of age effect in control cases, additional cases from individuals over the age of 90 years were included. Average values of alpha-secretase activity for control cases over 90 years of age did not differ significantly from those of young control cases or old control cases (F(2,20) = 0.64, p = 0.54). However, Fig. 4B shows a trend towards lower alpha-secretase activity with age when the individual ages of subjects were considered and classifying control subjects into two groups based on a cut off of 40 years may not be optimal for testing age effects. Thus, an ANOVA was repeated with age at death included as a covariate. With this approach, group differences (control versus DS) did not affect alpha-secretase activity but age was a significant covariate (F(1,42) = 8.75, p = 0.005). As shown in Fig. 4B, the contribution of age appears to be primarily within the DS group particularly in individuals over the age of 40 years. When alpha-secretase activity and age is analyzed in this subset of individuals, there is a significant negative correlation (r = −0.58, p = 0.009) with activity decreasing markedly with age.
Fig. 4.

Average alpha-secretase activity remains relatively stable in controls and in DS. (A) Alpha-secretase activity was similar in control and DS cases under the age of 40 years and over the age of 40 years. Further, control cases over the age of 90 years were not different from younger controls. Individual data points are shown, horizontal lines represent means and the top of the box illustrates the 75th percentile and the bottom the 25th percentile. Young controls <40 years, old controls >40 years, young DS <40 years, old DS >40 years. (B) Alpha-secretase is plotted as a function of age and shows relatively consistent activity levels in both controls and DS. Note that a subset of DS cases over 40 years of age has lower alpha-secretase activity.
A similar analysis was used to detect age and group effects on beta-secretase activity (Fig. 5A). Beta-secretase activity varied as a function of both group (control versus DS) and with age (F(3,41) = 25.97, p < 0.0005). Post hoc comparisons with Bonferroni adjustment show that aged controls had significantly higher average beta-secretase activity than that of young controls (p < 0.0005) and that aged DS cases had higher activity than young DS cases (p < 0.0005). We extended these findings out to include cases over the age of 90 years. A one-way ANOVA comparing young, old and 90+ cases showed a significant main effect of age (F(2,20) =13.0, p < 0.0005) and as Fig. 5B shows, beta-secretase activity appeared to be stable in normal aged controls even into advanced age but higher than young controls. To confirm that the PMI would not alter these conclusions, regression models as described above for Aβ1–40 and Aβ1–42 were undertaken to identify possible covariates and to check for parallelism. The positive slope for beta-secretase against age was highly significant (F(1,41) = 36.4, p < 0.0005) while the slope for PMI was negative (F(1,41) = 1.99, p = 0.165). The interaction terms were not significant. When age was used as a covariate in an ANCOVA, similar to the approach above, the DS average beta-secretase was significantly higher than that of the control group (F(1,42) = 9.5, p = 0.004). Thus, beta-secretase activity increased with age in both groups and reached higher levels overall, particularly in the aged DS cases relative to controls.
Fig. 5.
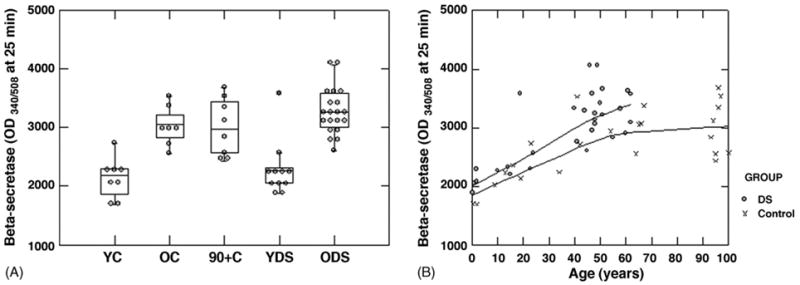
Beta-secretase activity increases with age in both controls and in DS cases. (A) Beta secretase activity increases with age in both controls and in DS, however, no further increases are observed in control cases when the age range is extended to include subjects over 90 years of age. Note that a subset of old DS cases had higher levels of beta-secretase than other cases. Individual data points are shown, horizontal lines represent means and the top of the box illustrates the 75th percentile and the bottom the 25th percentile. Young controls <40 years, old controls <40 years, young DS <40 years, old DS >40 years. (B) Beta-secretase activity is plotted as a function of age and illustrates the relatively parallel rise in activity with age in both controls and DS but maintenance of activity levels in individuals over 90 years of age.
3.3. Secretase-associated C-terminal fragments of APP and steady state levels of APP
To confirm and extend the results of the secretase activity assays, an antibody directed against the C-terminus of APP (CT-20) was used to identify alpha and beta-C-terminal fragments resulting from the cleavage of APP by individual enzymes (Fig. 6A). For these analyses, CTF-alpha or beta was corrected for total APP measured by CT20 and is expressed as a percentage. A one-way ANOVA reveals a significant main effect of age group (F(1,39) = 4.89, p = 0.034) on the accumulation of CTF-alpha in relation to total APP. There was general trend towards lower percentage of CTF-alpha to total APP in both normal and DS aged groups (Fig. 6B). When CTF-alpha levels are plotted as a function of age in the control (Fig. 6E) or the DS group (Fig. 6F), a significant decline with age can be observed in the DS cases (r = −0.44, p = 0.031) but no significant effect in controls (r = −0.30, p = 0.28). The statistical significance of the age effect in controls may be reduced due to increased individual variability observed in older subjects.
Fig. 6.

APP CTF-alpha and CTF-beta with age in controls and in DS. (A) A western blot illustrates CTF-alpha and CTF-beta decreasing and increasing, respectively in both controls and DS. β-actin illustrates relatively equal loading across all cases. (B) Quantification of Western blots after correcting for protein loading and expressed as a proportion of total full length APP from the larger set of samples reveals an age dependent decrease in CTF-alpha to total APP in old controls and a similar decline in old DS cases. (C) In contrast, CTF-beta to total APP did not appear to increase appreciably in control cases and appeared lower in young DS cases when quantified. (D) The ratio of CTF-beta to alpha rose with age in controls and in DS but was also lower overall in young DS cases. (E) In controls, CTFs of APP as a result of alpha- or beta-secretase shows stable CTF beta levels relative to total APP and a progressive decline in CTF-alpha. (F) In DS, a similar effect was observed except that the differences were more pronounced particularly in cases under 40 years of age. (G) The percentage of CTF-beta to CTF-alpha rose with age in controls but was variable in cases over 60 years of age. (H) In DS, the percentage of CTF-beta to alpha increased progressively with age. To detect CTF, the antibody CT20 was used and the specificity has been described previously [48].
The accumulation of CTF-beta as a percentage of total APP varied as a function of age group (F(1,39) = 14.25, p = 0.001) and of diagnostic group (F(1,39) = 19.21, p < 0.0005). But, there is no significant interaction between age group and diagnostic group (F(1,39) = 1.82, p = 0.186). Overall, young individuals with DS had the lowest percentage of CTF-beta to total APP (Fig. 6C). When CTF-beta is plotted as a function of age for each diagnostic group, there is significant increase in CTF-beta with age in DS (r = 0.69, p < 0.0005) and not in controls (Fig. 6E and F).
We next compared the percentage of CTF-beta to CTF-alpha as a function of age and diagnostic group. An ANOVA reveals a significant main effect of age group (F(1,29) = 18.23, p < .0005) and of diagnostic group (F(1,39) = 5.76, p = 0.022) but no interaction between these two variables. Fig. 6D shows that there was a large amount of individual variability in the old controls cases and that overall, the young DS cases had a lower CTF-beta to CTF-alpha percentage. When the controls are considered separately, there was no correlation between age and the percentage of CTF-beta to alpha (r = 0.38, p = 0.16), primarily due to the large spread in individual ratios in the oldest subjects (Fig. 6G). However, in DS cases the correlation was significant (r = 0.75, p < 0.0005) (Fig. 6H).
We further hypothesized that the level of CTFs would reflect secretase activity. Within the DS group, although there appeared to be little association between alpha-secretase activity measures and the levels of CTF-alpha, there was a significant correlation between beta-secretase activity and CTF-beta level (r = 0.57, p = 0.003).
To determine if one mechanism underlying increased formic acid extracted Aβ was associated with age-dependent increases in the steady state levels of total APP, Western blotting experiments were conducted. In general, DS cases exhibited higher steady state levels of APP relative to controls (Fig. 7A), but these levels were not statistically significantly different after correcting for total protein loading. Further, as reported previously, there appears to be no consistent changes in APP protein levels with age in either normal controls (r = −0.36, p = 0.19) or in DS (r = 0.25, p = 0.23) (Fig. 7B and C, respectively).
Fig. 7.

Steady state levels of APP show no direct relationship with age but are higher overall in the DS cases. (A) Full length APP was detected using 22C11 in this illustration showing that overall, individuals with DS had higher levels of APP but there were no apparent trends towards an increase or decrease in APP with age in either group. Total APP corrected for actin protein loading is plotted as a function of age for controls (B) and for individuals with DS (C) showing a lack of change with increasing age.
3.4. Association between plaque loads, Aβ and secretase activity
In control subjects, there was a significant correlation between plaque load and insoluble Aβ1–40 (r = 0.96, p < .0001) and insoluble Aβ1–42 (r = 0.96, p < .001) however, this was primarily driven by a single case #15 that was high in both plaque load and Aβ by ELISA. When corrected for age, these correlations remained. No other correlations were found between plaque load and secretase activity (alpha or beta) or level of CTFs. In DS subjects, plaque load was correlated with insoluble Aβ1–40 (r = 0.84, p = 0.001), insoluble Aβ1–42 (r = 0.96, p < 0.0001) but not with secretase activity or with CTF levels. Further, as in the control group, when corrected for age these correlations remained significant and higher plaque loads were associated with increasing levels of formic acid soluble Aβ1–40 and Aβ1–42.
Formic acid extracted Aβ1–42 and Aβ1–40 levels were significantly correlated with beta-secretase but not alpha-secretase activity in DS subjects. No correlations were observed in controls. In DS, there was no association between formic acid extracted Aβ1–40 (r = −0.13, p = 0.55) and Aβ1–42 (r = −0.26, p = 0.22) and alpha-secretase activity. Higher beta-secretase activity was associated with more extensive Aβ1–40 (r = 0.67, p < 0.0005) and Aβ1–42 (r = 0.74, p < 0.0005). However, when correcting for age, partial correlation coefficients were not significant suggesting that a significant part of the association between beta-secretase activity and the accumulation of Aβ was that both increase with age.
4. Discussion
In the most common form of DS, trisomy 21, three copies of chromosome 21 (21q21.2) leads to the overexpression of APP in brain and in peripheral lymphocytes [47,52]. As a consequence, plasma Aβ is significantly higher in individuals with DS (17–58 years) than in age-matched controls [8,38,55]. However, reports of further age-dependent increases in plasma Aβ in DS are variably reported as increased [38] or unchanged [8,55]. In CSF, there is an age dependent decrease in Aβ42 that may reflect increasing Aβ deposition in the brain [26].
Previous reports in DS also show age-dependent increases in soluble Aβ and intracellular Aβ in brain [20,25] that precedes the deposition of Aβ in plaques [7,61]. Soluble Aβ is higher in DS early in development and continues to rise with age [61]. The data presented in the current study extends these previous findings and shows that insoluble Aβ increases with age in DS but at older ages (>40 years) than that reported for soluble Aβ [61] and reaches significantly higher levels than in normal aging but closer to levels reported in AD [14,32]. We did not observe significant differences in the levels of insoluble Aβ in younger DS cases as compared to controls suggesting that insoluble Aβ reflects either an aging or a disease process. However, our ELISA capture antibody will not detect N-terminally truncated species of Aβ that have been previously reported to also rise with age in DS [30] and thus our measures may be conservative.
We next determined that total APP levels did not increase with age leading to the observed increases in insoluble Aβ in DS, which is consistent with previous reports [13,69] despite individuals with DS having higher APP levels than controls [52]. This led us to the hypothesis that the activity of enzymes involved with the cleavage of APP may shift with age to favor the production of amyloidogenic fragments [10,56,57]. In normal aging, beta-secretase activity increases [15] and correlates with increased amounts of insoluble Aβ1–40 and Aβ1–42 [15]. In AD autopsy samples, BACE protein and beta-secretase activity levels are increased relative to age-matched controls [14,32,62,69] and alpha-secretase activity is reduced [62]. However, in AD brain, beta-secretase activity does not correlate with insoluble Aβ peptide [14]. The current study confirms increased beta-secretase activity with normal aging but also in DS. Further, we did not observe a correlation between beta-secretase activity and insoluble Aβ when covarying for age. This is not entirely surprising given that insoluble Aβ may reflect accumulation over an extended period of times and may be more tightly coupled to degradation and clearance pathways [16]. Thus, Aβ accumulation in the DS brain may reflect both increased production and decreased degradation and clearance although the relative contributions of each of these pathways is unknown.
Increased beta-secretase activity in DS with age may reflect BACE1 activity [64], but also possibly BACE2, which has approximately a 64% amino acid similarity to BACE1 [1] and is present on chromosome 21 in the DS obligate region [1]. Developmentally, BACE2 protein levels are significantly higher in DS fetal tissue relative to controls [2]. In addition, in cultured fibroblasts from adults with DS, BACE2 mRNA (i.e. protein expression) was 2.6 fold higher than normal controls [2]. In the brain, BACE2 immunoreactivity was observed within frontal cortex neurons of adults with DS and AD but not in younger DS individuals nor in control cases [39]. However, overall, BACE2 is present in low levels in the brain [3,36] and within select subcortical brain nuclei and not as ubiquitously expressed as BACE1. Further, a recent paper suggests that the cleavage site on APP of BACE2 may be more consistent with alpha-secretase activity [12]. We also would have predicted that had BACE2 been a significant contributor to Aβ production in DS, then beta-secretase activity may have been significantly higher than controls; our observations did not support this hypothesis. Thus it is most likely that beta-secretase changes with age in DS reflect BACE1 rather than BACE2 activity.
To extend and confirm the results of the secretase activity assays, we measured protein levels of the resulting C-terminal fragments of APP representing alpha- or beta-secretase cleavage, CTF-alpha and CTF-beta, respectively. We observed unexpected dissociations between secretase activity levels and the levels of CTFs in relation to total APP that were different in controls and in DS. In normal aging, despite little or no change in alpha-secretase activity with age, we observed a decrease in CTF-alpha. Reduced CTF-alpha may be due to a shift of APP processing towards cleavage by beta-secretase. Although beta-secretase activity does increase with age in controls, which is consistent with previous reports [15], CTF-beta levels remained stable. A rapid cleavage of CTFs to Aβ in soluble pools, which were not measured in this study, or intact CTF clearance mechanisms in normal aging may account for this result. In DS, we observed age-dependent increases in beta-secretase activity that were consistent with an increase in CTF-beta, similar to previous reports [41,53]. These results suggest that in DS, increased CTF-beta levels more closely parallel reports in AD cases [69] rather than that observed in normal aging.
Increased APP CTF-beta with age in DS may be due to the combined effects of APP overexpression and increased beta-secretase activity that is not present in normal brain. APP overproduction in cell culture leads to abnormally large endosomes, increased Aβ40, Aβ42, and CTF-beta [17]. In DS brain, the number of neurons containing abnormally large endosomes rises from 21 to 40% between 5 months and 12 years of age [7]. However there is also evidence that APP overexpression alone may be insufficient to cause endosomal dysfunction suggesting that other genes on chromosome 21 may be a contributor [6].
An unexpected outcome in the current study was the lower amounts of CTF-beta in young DS cases relative to young controls. This is not due to lower beta-secretase or higher alpha-secretase activity relative to controls. There are two possible explanations. The first is that CTF-beta may be rapidly cleaved to form soluble Aβ, which we did not measure in the current study but in a previous report is increased in young DS brain [61]. Alternatively, lower CTF-beta may be associated with enhanced degradation and clearance mechanisms in DS that may subsequently be linked to the lack of Aβ plaque accumulation despite overexpression of full length APP. The pathways that may be involved with enhanced CTF-beta turnover in DS have yet to be determined but may involve the proteasome [42,44] and it is interesting to note that proteins involved with the 20S proteasome are increased in DS fetal brain tissue [11].
We had the opportunity to include several nondemented autopsy cases between the ages of 90 and 100 years to fully extend the range of age to study alpha- and beta-secretase activity in normal aging. We had hypothesized that the oldest old may be protected from Aβ accumulation by increased alpha-secretase activity or decreased beta-secretase activity. Individuals over the age of 90 years exhibited consistent alpha-and beta-secretase activities as individuals between 40 and 69 years of age but higher than young controls (<40 years). Despite these changes in enzyme activity, there was very little Aβ plaque accumulation in these successful agers as none of the subjects included in the study had sufficient pathology for a diagnosis of AD. However, it is possible that Aβ may be increased in insoluble or soluble pools that were not analyzed in the current study. Thus, against a background of increasing beta-secretase activity, there may be compensatory responses such as increased Aβ degradation and clearance that protects these individuals from developing AD pathology.
By combining previous studies and the results of the current study the temporal events in AD pathogenesis in DS can be further clarified. Early in development there is an overproduction of APP and soluble Aβ [61]. Soluble Aβ may reflect Aβ accumulating within neurons [20] in association with endosomes [5]. In the brains of DS individuals 30 years and older, intracellular Aβ begins to decline as extracellular Aβ accumulates in the form of diffuse plaques [5,20]. The data collected in the current study suggests that insoluble Aβ levels are similar in DS and controls under the age of 30 years but increases as individuals approach their 40s and as Aβ plaques begin to accumulate. Increased Aβ in the insoluble pools occurs at approximately the same age as a shift in APP processing to favor the production of amyloidogenic fragments. Overall, Aβ42 in the insoluble pool was higher than Aβ40, which is consistent with immunohistochemical studies of Aβ in the plaques of DS brain [30].
However, increased incidence of clinical signs of dementia in DS after the age of 50 years [29,54,63,66] appear to be at a later age than the first signs of significant insoluble Aβ accumulation or plaque accumulation and also after the first signs of neurofibrillary tangle pathology [35]. Thus, downstream events that may be directly or indirectly related to Aβ or tangle formation may lead to neuronal dysfunction and cognitive decline. For example, synaptic dysfunction may be a consequence of APP overexpression or increased Aβ [58,60], or other pathological molecular cascades may be engaged in DS that are associated with AD pathology such as neuroinflammation [18,19,21,59], endosomal dysfunction [6,7] and oxidative damage [45,46].
When these temporal events are considered together, DS involves the co-occurrence of features of aging and of AD pathogenesis. Treatments to slow or prevent AD in the general population targeting secretase activity may also be successful when translated to the DS population at high risk for developing the disease. However, beta-secretase activity is not significantly higher in aged DS cases than that observed in aged control cases, which do not accumulate significant insoluble Aβ. Thus, targeting secretase activity may be more efficacious for adults with DS if combined with interventions to promote degradation and clearance of insoluble Aβ.
Acknowledgments
Funding supported by UCI ADRC P50 AG16573, NIH/NIA AG21912, NIH/NIA AG 21055, “My Brother Joey Clinical Neuroscience Fund”, UW ADRC NIA P50 AG 05136-21 and a College of Medicine Committee on Research and Graduate Academic Program Award. The authors appreciate the helpful comments on the manuscript provided by Drs. Jorge Busciglio and Dr. Wayne Poon (UCI) and Drs. Paul Murphy and Jeffery Keller (U Kentucky). We are grateful to the families and individuals with Down syndrome that made this work possible.
References
- 1.Acquati F, Accarino M, Nucci C, Fumagalli P, Jovine L, Ottolenghi S, et al. The gene encoding DRAP (BACE2), a glycosylated transmembrane protein of the aspartic protease family, maps to the down critical region. FEBS Lett. 2000;468(1):59–64. doi: 10.1016/s0014-5793(00)01192-3. [DOI] [PubMed] [Google Scholar]
- 2.Barbiero L, Benussi L, Ghidoni R, Alberici A, Russo C, Schettini G, et al. BACE-2 is overexpressed in Down's syndrome. Exp Neurol. 2003;182:335–45. doi: 10.1016/s0014-4886(03)00049-9. [DOI] [PubMed] [Google Scholar]
- 3.Bennett BD, Babu-Khan S, Loeloff R, Louis JC, Curran E, Citron M, et al. Expression analysis of BACE2 in brain and peripheral tissues. J Biol Chem. 2000;275(27):20647–51. doi: 10.1074/jbc.M002688200. [DOI] [PubMed] [Google Scholar]
- 4.Bush A, Beail N. Risk factors for dementia in people with Down syndrome: issues in assessment and diagnosis. Am J Ment Retard. 2004;109(2):83–97. doi: 10.1352/0895-8017(2004)109<83:RFFDIP>2.0.CO;2. [DOI] [PubMed] [Google Scholar]
- 5.Cataldo AM, Petanceska S, Terio NB, Peterhoff CM, Durham R, Mercken M, et al. Abeta localization in abnormal endosomes: association with earliest Abeta elevations in AD and Down syndrome. Neurobiol Aging. 2004;25(10):1263–72. doi: 10.1016/j.neurobiolaging.2004.02.027. [DOI] [PubMed] [Google Scholar]
- 6.Cataldo AM, Petanceska S, Peterhoff CM, Terio NB, Epstein CJ, Villar A, et al. APP gene dosage modulates endosomal abnormalities of Alzheimer's disease in a segmental trisomy 16 mouse model of Down syndrome. J Neurosci. 2003;23(17):6788–92. doi: 10.1523/JNEUROSCI.23-17-06788.2003. [DOI] [PMC free article] [PubMed] [Google Scholar]
- 7.Cataldo AM, Peterhoff CM, Troncoso JC, Gomez-Isla T, Hyman BT, Nixon RA. Endocytic pathway abnormalities precede amyloid beta deposition in sporadic Alzheimer's disease and Down syndrome: differential effects of APOE genotype and presenilin mutations. Am J Pathol. 2000;157:277–86. doi: 10.1016/s0002-9440(10)64538-5. [DOI] [PMC free article] [PubMed] [Google Scholar]
- 8.Cavani S, Tamaoka A, Moretti A, Marinelli L, Angelini G, Di Stefano S, et al. Plasma levels of amyloid β 40 and 42 are independent from ApoE genotype and mental retardation in Down syndrome. Am J Med Gen. 2000;95:224–8. [PubMed] [Google Scholar]
- 9.Das P, Howard V, Loosbrock N, Dickson D, Murphy MP, Golde TE. Amyloid-beta immunization effectively reduces amyloid deposition in FcRgamma-/-knock-out mice. J Neurosci. 2003;23(24):8532–8. doi: 10.1523/JNEUROSCI.23-24-08532.2003. [DOI] [PMC free article] [PubMed] [Google Scholar]
- 10.De Strooper B, Annaert W. Proteolytic processing and cell biological functions of the amyloid precursor protein. J Cell Sci. 2000;113(Pt 11):1857–70. doi: 10.1242/jcs.113.11.1857. [DOI] [PubMed] [Google Scholar]
- 11.Engidawork E, Juranville JF, Fountoulakis M, Dierssen M, Lubec G. Selective upregulation of the ubiquitin-proteasome proteolytic pathway proteins, proteasome zeta chain and isopeptidase T in fetal Down syndrome. J Neural Transm Suppl. 2001;61:117–30. doi: 10.1007/978-3-7091-6262-0_10. [DOI] [PubMed] [Google Scholar]
- 12.Fabel K, Tam B, Kaufer D, Baiker A, Simmons N, Kuo CJ, et al. VEGF is necessary for exercise-induced adult hippocampal neurogenesis. Eur J Neurosci. 2003;18(10):2803–12. doi: 10.1111/j.1460-9568.2003.03041.x. [DOI] [PubMed] [Google Scholar]
- 13.Flood FM, Cowburn RF, Johnston JA. Presenilin-1, amyloid precursor protein and amyloid precursor-like protein 2 mRNA levels in human superior frontal cortex during aging. Neurosci Lett. 1997;235(1–2):17–20. doi: 10.1016/s0304-3940(97)00697-6. [DOI] [PubMed] [Google Scholar]
- 14.Fukumoto H, Cheung BS, Hyman BT, Irizarry MC. Beta-secretase protein and activity are increased in the neocortex in Alzheimer disease. Arch Neurol. 2002;59(9):1381–9. doi: 10.1001/archneur.59.9.1381. [DOI] [PubMed] [Google Scholar]
- 15.Fukumoto H, Rosene DL, Moss MB, Raju S, Hyman BT, Irizarry MC. Beta-secretase activity increases with aging in human, monkey, and mouse brain. Am J Pathol. 2004;164(2):719–25. doi: 10.1016/s0002-9440(10)63159-8. [DOI] [PMC free article] [PubMed] [Google Scholar]
- 16.Glabe C. Does Alzheimer disease tilt the scales of amyloid degradation versus accumulation? Nature Med. 2000;6(2):133–4. doi: 10.1038/72215. [DOI] [PubMed] [Google Scholar]
- 17.Grbovic OM, Matthews PM, Jiang Y, Schmidt SD, Dinakar R, Summers-Terio NB, et al. Rab5-stimulated up-regulation of the endocytic pathway increases intracellular β-cleaved amyloid precursor protein carboxyl-terminal fragment levels and Aβ production. J Biol Chem. 2003;278(33):31261–8. doi: 10.1074/jbc.M304122200. [DOI] [PubMed] [Google Scholar]
- 18.Griffin WS, Stanley LC, Ling C, White L, MacLeod V, Perrot LJ, et al. Brain interleukin I and S-100 immunoreactivity are elevated in Down syndrome and Alzheimer's disease. Proc Natl Acad Sci USA. 1989;86:7611–5. doi: 10.1073/pnas.86.19.7611. [DOI] [PMC free article] [PubMed] [Google Scholar]
- 19.Griffin WST, Sheng JG, Roberts GW, Mrak RE. Interleukin-1 expression in different plaque types in Alzheimer's disease, significance in plaque evolution. J Neuropathol Exp Neurol. 1995;54:276–81. doi: 10.1097/00005072-199503000-00014. [DOI] [PubMed] [Google Scholar]
- 20.Gyure KA, Durham R, Stewart WF, Smialek JE, Troncoso JC. Intraneuronal Aβ-amyloid precedes developmnet of amyloid plaques in Down syndrome. Arch Pathol Lab Med. 2001;125:489–92. doi: 10.5858/2001-125-0489-IAAPDO. [DOI] [PubMed] [Google Scholar]
- 21.Head E, Azizeh BY, Lott IT, Tenner AJ, Cotman CW, Cribbs DH. Complement association with neurons and beta-amyloid deposition in the brains of aged individuals with Down syndrome. Neurobiol Dis. 2001;8(2):252–65. doi: 10.1006/nbdi.2000.0380. [DOI] [PubMed] [Google Scholar]
- 22.Head E, Lott IT. Down syndrome and beta-amyloid deposition. Curr Opin Neurol. 2004;17(2):95–100. doi: 10.1097/00019052-200404000-00003. [DOI] [PubMed] [Google Scholar]
- 23.Head E, Lott IT, Hof PR, Bouras C, Su JH, Kim R, et al. Pathological events Associated with Tau Pathology in Middle Aged Individuals with Down syndrome. J Neuropathol Exp Neurol. 2003;62(9):917–26. doi: 10.1093/jnen/62.9.917. [DOI] [PubMed] [Google Scholar]
- 24.Head E, McCleary R, Hahn FF, Milgram NW, Cotman CW. Region-specific age at onset of beta-amyloid in dogs. Neurobiol Aging. 2000;21(1):89–96. doi: 10.1016/s0197-4580(00)00093-2. [DOI] [PubMed] [Google Scholar]
- 25.Hirayama A, Horikoshi Y, Maeda M, Ito M, Takashima S. Characteristic developmental expression of amyloid β40,42 and 43 in patients with Down syndrome. Brain Dev. 2003;25:180–5. doi: 10.1016/s0387-7604(02)00209-7. [DOI] [PubMed] [Google Scholar]
- 26.Hof PR, Bouras C, Perl DP, Sparks DL, Mehta N, Morrison JH. Age-related distribution of neuropathologic changes in the cerebral cortex of patients with Down's syndrome. Arch Neurol. 1995;52:379–91. doi: 10.1001/archneur.1995.00540280065020. [DOI] [PubMed] [Google Scholar]
- 27.Kitamoto T, Ogomori K, Tateishi J, Prusiner SB. Formic acid pretreatment enhances immunostaining of cerebral and systemic amyloids. Lab Invest. 1987;57(2):230–6. [PubMed] [Google Scholar]
- 28.Kukar T, Murphy MP, Eriksen JL, Sagi SA, Weggen S, Smith TE, et al. Diverse compounds mimic Alzheimer disease-causing mutations by augmenting Abeta42 production. Nat Med. 2005;11(5):545–50. doi: 10.1038/nm1235. [DOI] [PubMed] [Google Scholar]
- 29.Lai F, Williams MD. A prospective study of Alzheimer disease in Down syndrome. Arch Neurol. 1989;46:849–53. doi: 10.1001/archneur.1989.00520440031017. [DOI] [PubMed] [Google Scholar]
- 30.Lemere CA, Blusztajn JK, Yamaguchi H, Wisniewski T, Saido TC, Selkoe DJ. Sequence of deposition of heterogeneous amyloid beta-peptides and APOE in Down syndrome: implications for initial events in amyloid plaque formation. Neurobiol Dis. 1996;3:16–32. doi: 10.1006/nbdi.1996.0003. [DOI] [PubMed] [Google Scholar]
- 31.Leverenz JB, Raskind MA. Early amyloid deposition in the medial temporal lobe of young Down syndrome patients: a regional quantitative analysis. Exp Neurol. 1998;150:296–304. doi: 10.1006/exnr.1997.6777. [DOI] [PubMed] [Google Scholar]
- 32.Li R, Lindholm K, Yang LB, Yue X, Citron M, Yan R, et al. Amyloid beta peptide load is correlated with increased beta-secretase activity in sporadic Alzheimer's disease patients. Proc Natl Acad Sci USA. 2004;101(10):3632–7. doi: 10.1073/pnas.0205689101. [DOI] [PMC free article] [PubMed] [Google Scholar]
- 33.Lott IT, Head E. Down syndrome and Alzheimer's disease: a link between development and aging. Ment Retard Dev Disabil Res Rev. 2001;7(3):172–8. doi: 10.1002/mrdd.1025. [DOI] [PubMed] [Google Scholar]
- 34.Mann DMA. The pathological association between Down syndrome and Alzheimer disease. Mech Ageing Dev. 1988;43:99–136. doi: 10.1016/0047-6374(88)90041-3. [DOI] [PubMed] [Google Scholar]
- 35.Mann DMA, Esiri MM. The pattern of acquisition of plaques and tangles in the brains of patients under 50 years of age with Down's syndrome. J Neurol Sci. 1989;89:169–79. doi: 10.1016/0022-510x(89)90019-1. [DOI] [PubMed] [Google Scholar]
- 36.Marcinkiewicz M, Seidah NG. Coordinated expression of beta-amyloid precursor protein and the putative beta-secretase BACE and alpha-secretase ADAM10 in mouse and human brain. J Neurochem. 2000;75(5):2133–43. doi: 10.1046/j.1471-4159.2000.0752133.x. [DOI] [PubMed] [Google Scholar]
- 37.McGowan E, Pickford F, Kim J, Onstead L, Eriksen J, Yu C, et al. Abeta42 is essential for parenchymal and vascular amyloid deposition in mice. Neuron. 2005;47(2):191–9. doi: 10.1016/j.neuron.2005.06.030. [DOI] [PMC free article] [PubMed] [Google Scholar]
- 38.Mehta PD, Dalton AJ, Mehta SP, Kim KS, Sersen EA, Wisniewski HM. Increased plasma amyloid β protein 1-42 levels in Down syndrome. Neurosci Lett. 1998;241:13–6. doi: 10.1016/s0304-3940(97)00966-x. [DOI] [PubMed] [Google Scholar]
- 39.Motonaga K, Itoh M, Becker LE, Goto Y, Takashima S. Elevated expression of beta-site amyloid precursor protein cleaving enzyme 2 in brains of patients with Down syndrome. Neurosci Lett. 2002;326:64–6. doi: 10.1016/s0304-3940(02)00287-2. [DOI] [PubMed] [Google Scholar]
- 40.Murphy MP, Uljon SN, Fraser PE, Fauq A, Lookingbill HA, Findlay KA, et al. Presenilin 1 regulates pharmacologically distinct gamma-secretase activities. Implications for the role of presenilin in gamma-secretase cleavage. J Biol Chem. 2000;275(34):26277–84. doi: 10.1074/jbc.M002812200. [DOI] [PubMed] [Google Scholar]
- 41.Nordstedt C, Gandy SE, Alafuzoff I, Caporaso GL, Iverfeldt K, Grebb JA, et al. Alzheimer beta/A4 amyloid precursor protein in human brain: aging-associated increases in holoprotein and in a proteolytic fragment. Proc Natl Acad Sci USA. 1991;88(20):8910–4. doi: 10.1073/pnas.88.20.8910. [DOI] [PMC free article] [PubMed] [Google Scholar]
- 42.Nunan J, Shearman MS, Checler F, Cappai R, Evin G, Beyreuther K, et al. The C-terminal fragment of the Alzheimer's disease amyloid protein precursor is degraded by a proteasome-dependent mechanism distinct from gamma-secretase. Eur J Biochem. 2001;268(20):5329–36. doi: 10.1046/j.0014-2956.2001.02465.x. [DOI] [PubMed] [Google Scholar]
- 43.Nunan J, Small DH. Regulation of APP cleavage by α–, β– and γ-secretases. FEBS Lett. 2000;483:6–10. doi: 10.1016/s0014-5793(00)02076-7. [DOI] [PubMed] [Google Scholar]
- 44.Nunan J, Williamson NA, Hill AF, Sernee MF, Masters CL, Small DH. Proteasome-mediated degradation of the C-terminus of the Alzheimer's disease beta-amyloid protein precursor: effect of C-terminal truncation on production of beta-amyloid protein. J Neurosci Res. 2003;74(3):378–85. doi: 10.1002/jnr.10646. [DOI] [PubMed] [Google Scholar]
- 45.Nunomura A, Perry G, Hirai K, Aliev G, Takeda A, Chiba S, et al. Neuronal RNA oxidation in Alzheimer's disease and Down's syndrome. Ann NYAS. 1999;893:362–4. doi: 10.1111/j.1749-6632.1999.tb07855.x. [DOI] [PubMed] [Google Scholar]
- 46.Nunomura A, Perry G, Pappolla M, Friedland RP, Hirai K, Chiba S, et al. Neuronal oxidative stress precedes amyloid-β deposition in Down syndrome. J Neuropathol Exp Neurol. 2000;59(11):1011–7. doi: 10.1093/jnen/59.11.1011. [DOI] [PubMed] [Google Scholar]
- 47.Pallister C, Jung SS, Shaw I, Nalbantoglu J, Gauthier S, Cashman NR. Lymphocyte content of amyloid precursor protein is increased in Down's syndrome and aging. Neurobiol Aging. 1997;18(1):97–103. doi: 10.1016/s0197-4580(96)00207-2. [DOI] [PubMed] [Google Scholar]
- 48.Pinnix I, Musunuru U, Tun H, Sridharan A, Golde T, Eckman C, et al. A novel gamma-secretase assay based on detection of the putative C-terminal fragment-gamma of amyloid beta protein precursor. J Biol Chem. 2001;276(1):481–7. doi: 10.1074/jbc.M005968200. [DOI] [PubMed] [Google Scholar]
- 49.Prasher VP, Filer A. Behavioural disturbance in people with Down's syndrome and dementia. J Intellect Disabil Res. 1995;39(Pt 5):432–6. doi: 10.1111/j.1365-2788.1995.tb00547.x. [DOI] [PubMed] [Google Scholar]
- 50.Rezai-Zadeh K, Shytle D, Sun N, Mori T, Hou H, Jeanniton D, et al. Green tea epigallocatechin-3-gallate (EGCG) modulates amyloid precursor protein cleavage and reduces cerebral amyloidosis in Alzheimer transgenic mice. J Neurosci. 2005;25(38):8807–14. doi: 10.1523/JNEUROSCI.1521-05.2005. [DOI] [PMC free article] [PubMed] [Google Scholar]
- 51.Rovelet-Lecrux A, Hannequin D, Raux G, Meur NL, Laquerriere A, Vital A, et al. APP locus duplication causes autosomal dominant early-onset Alzheimer disease with cerebral amyloid angiopathy. Nat Genet. 2006;38(1):24–6. doi: 10.1038/ng1718. [DOI] [PubMed] [Google Scholar]
- 52.Rumble B, Retallack R, Hilbich C, Simms G, Multhaup G, Martins R, et al. Amyloid A4 and its precursor in Down's syndrome and Alzheimer's disease. New Engl J Med. 1989;320:1446–62. doi: 10.1056/NEJM198906013202203. [DOI] [PubMed] [Google Scholar]
- 53.Russo C, Salis S, Dolcini V, Venezia V, Song XH, Teller JK, et al. Amino-terminal modification and tyrosine phosphorylation of [corrected] carboxy-terminal fragments of the amyloid precursor protein in Alzheimer's disease and Down's syndrome brain. Neurobiol Dis. 2001;8(1):173–80. doi: 10.1006/nbdi.2000.0357. [DOI] [PubMed] [Google Scholar]
- 54.Schupf N, Kappel D, Nightingale B, Rodriguez A, Tycko B, Mayeux R. Earlier onset of Alzheimer's disease in men with Down syndrome. Neurology. 1998;50(4):991–5. doi: 10.1212/wnl.50.4.991. [DOI] [PubMed] [Google Scholar]
- 55.Schupf N, Patel B, Silverman W, Zigman WB, Zhong N, Tycko B, et al. Elevated plasma amyloid beta-peptide 1-42 and onset of dementia in adults with Down syndrome. Neurosci Lett. 2001;301(3):199–203. doi: 10.1016/s0304-3940(01)01657-3. [DOI] [PubMed] [Google Scholar]
- 56.Selkoe DJ. Normal and abnormal biology of the beta-amyloid precursor protein. Annu Rev Neurosci. 1994;17:489–517. doi: 10.1146/annurev.ne.17.030194.002421. [DOI] [PubMed] [Google Scholar]
- 57.Selkoe DJ, Schenk D. Alzheimer's disease: molecular understanding predicts amyloid-based therapeutics. Annu Rev Pharmacol Toxicol. 2003;43:545–84. doi: 10.1146/annurev.pharmtox.43.100901.140248. [DOI] [PubMed] [Google Scholar]
- 58.Spires TL, Meyer-Luehmann M, Stern EA, McLean PJ, Skoch J, Nguyen PT, et al. Dendritic spine abnormalities in amyloid precursor protein transgenic mice demonstrated by gene transfer and intravital multiphoton microscopy. J Neurosci. 2005;25(31):7278–87. doi: 10.1523/JNEUROSCI.1879-05.2005. [DOI] [PMC free article] [PubMed] [Google Scholar]
- 59.Stoltzner SE, Grenfell TJ, Mori C, Wisniewski KE, Wisniewski TM, Selkoe DJ, et al. Temporal accrual of complement proteins in amyloid plaques in Down's syndrome with Alzheimer's disease. Am J Pathol. 2000;156(2):489–99. doi: 10.1016/S0002-9440(10)64753-0. [DOI] [PMC free article] [PubMed] [Google Scholar]
- 60.Tanzi RE. The synaptic Abeta hypothesis of Alzheimer disease. Nat Neurosci. 2005;8(8):977–9. doi: 10.1038/nn0805-977. [DOI] [PubMed] [Google Scholar]
- 61.Teller JK, Russo C, DeBusk LM, Angelini G, Zacceo D, Dagna-Bricarelli F, et al. Presence of soluble amyloid β-peptide precedes amyloid plaque formation in Down's syndrome. Nat Med. 1996;2(1):93–5. doi: 10.1038/nm0196-93. [DOI] [PubMed] [Google Scholar]
- 62.Tyler SJ, Dawbarn D, Wilcock GK, Allen SJ. Alpha- and beta-secretase: profound changes in Alzheimer's disease. Biochem Biophys Res Commun. 2002;299(3):373–6. doi: 10.1016/s0006-291x(02)02635-9. [DOI] [PubMed] [Google Scholar]
- 63.Tyrrell J, Cosgrave M, McCarron M, McPherson J, Calvert J, Kelly A, et al. Dementia in people with Down's syndrome. Int J Geriatr Psychiatry. 2001;16(12):1168–74. doi: 10.1002/gps.502. [DOI] [PubMed] [Google Scholar]
- 64.Vassar R. BACE1: the beta-secretase enzyme in Alzheimer's disease. J Mol Neurosci. 2004;23(1–2):105–14. doi: 10.1385/JMN:23:1-2:105. [DOI] [PubMed] [Google Scholar]
- 65.Vassar R, Bennett BD, Babu-Khan S, Kahn S, Mendiaz EA, Denis P, et al. Beta-secretase cleavage of Alzheimer's amyloid precursor protein by the transmembrane aspartic protease BACE. Science. 1999;286(5440):735–41. doi: 10.1126/science.286.5440.735. [DOI] [PubMed] [Google Scholar]
- 66.Visser FE, Aldenkamp AP, van Huffelen AC, Kuilman M, Overweg J, van Wijk J. Prospective study of the prevalence of Alzheimer-type dementia in institutionalized individuals with Down syndrome. Am J Ment Retard. 1997;101(4):400–12. [PubMed] [Google Scholar]
- 67.Wisniewski K, Howe J, Williams G, Wisniewski HM. Precocious aging and dementia in patients with Down's syndrome. Biol Psychiatry. 1978;13(5):619–27. [PubMed] [Google Scholar]
- 68.Wisniewski K, Wisniewski H, Wen G. Occurrence of neuropathological changes and dementia of Alzheimer's disease in Down's syndrome. Ann Neurol. 1985;17:278–82. doi: 10.1002/ana.410170310. [DOI] [PubMed] [Google Scholar]
- 69.Yang LB, Lindholm K, Yan R, Citron M, Xia W, Yang XL, et al. Elevated beta-secretase expression and enzymatic activity detected in sporadic Alzheimer disease. Nat Med. 2003;9(1):3–4. doi: 10.1038/nm0103-3. [DOI] [PubMed] [Google Scholar]