Abstract
Redox and spectroscopic (electronic absorption, multifrequency electron paramagnetic resonance (EPR), and X-ray absorption) properties together with X-ray crystal structures are reported for the type 2 CuII C112D/M121E variant of Pseudomonas aeruginosa azurin. The results suggest that CuII is constrained from interaction with the proximal glutamate; this structural frustration implies a “rack” mechanism for the 290 mV (vs NHE) reduction potential measured at neutral pH. At high pH (~ 9), hydrogen bonding in the outer coordination sphere is perturbed to allow axial glutamate ligation to CuII, with a decrease in potential to 119 mV. These results highlight the role played by outer-sphere interactions, and the structural constraints they impose, in determining the redox behavior of transition metal protein cofactors.
Introduction
Blue (type 1) copper proteins are key players in a great many biological electron transfer (ET) reactions.1–2 Type 1 sites, which contain a trigonal N-N-S ligand set (two histidines and a cysteine), with axial ligation from either a methionine or glutamine at the “south pole” and in some cases a backbone carbonyl at the “north pole,” exhibit intense (ε ~ 5000 M−1cm−1) thiolate π to Cu dx2-y2 ligand to metal charge transfer (LMCT) absorption near 600 nm and narrow axial EPR hyperfine splitting (A‖ ≤ 9.5 mK). These optical and EPR spectroscopic properties have been ascribed to a highly covalent S-Cu interaction, which is thought to lower the ET reorganization energy (λ ~ 0.7 eV) as well as enhance distant electronic coupling to the site.3–5 Further and arguably more significant contributions to the low λ are outer-sphere noncovalent interactions that include hydrogen bonds to the cysteine sulfur. These outer-sphere interactions constrain the coordination geometry of blue copper sites and allow their rapid electron transfer reactivities.2,6–9
The CuII/I reduction potentials of type 1 sites span a wide range, from +200 mV to +1.0 V (or even greater) vs. the normal hydrogen electrode (NHE). This tunability permits T1 sites to participate in ET at favorable driving forces with many different redox partners. Many factors10 have been invoked as contributors to this modulation of redox potentials, including: axial ligation;11–14 site hydrophobicity;14–16 outer-sphere coordination (hydrogen bonding);17 and electrostatics.18 Lu and coworkers recently demonstrated the additive nature of these effects in their work on a series of Pseudomonas aeruginosa azurin mutants whose reduction potentials span a range of 600 mV.19
We have investigated the applicability of these principles to a type 2 copper site formed by the C112D (C = cysteine, D = aspartate) mutant in Pseudomonas aeruginosa azurin.20–21 Our initial efforts focused on M121 (M = methionine) substitutions, M121X (X = L, H, E) (L = leucine, H = histidine, E = glutamate), where at pH 7.0 we found elevated reduction potentials, 170 mV (single mutant) to ~ 300 mV. The latter value is surprisingly close to that of the wild-type protein. The C112D/M121L mutant gives rise to the type zero copper electronic structure; the elevated reduction potential has thus been ascribed as a consequence of this perturbation combined with increased site hydrophobicity.22 In the case of C112D/M121H it is likely that a protonated imidazolium side chain of histidine elevates the reduction potential through repulsive electrostatic interaction with the oxidized type 2 center. Following this line of reasoning, coordination to a negatively charged carboxylate would result in a reduction potential for the C112D/M121E variant that should be much lower than the measured value of 290 mV. We have now more extensively characterized C112D/M121E azurin to understand the origin of its surprisingly high reduction potential.
Materials and Methods
Protein Expression and Purification
C112D/M121E azurin was expressed and purified as described previously.21 Pseudomonas aeruginosa cytochrome c551 (c551) was expressed recombinantly in dual-transformed E. coli BL21(DE3): one plasmid contained the periplasmically-tagged c551 gene while a second plasmid bore eight genes to facilitate protein biosynthesis.23 A 50 mL starter culture in LB medium was incubated with shaking for 24 h at 37 °C. This culture was harvested, resuspended in TB medium, and added to 6 L TB medium (3x 2 L cultures in 6 L Erlenmeyer flasks). The expression culture was incubated at 37°C with shaking for 15 h. Protein was extracted following culture harvesting by osmotic shock. Extract was concentrated in an Amicon fitted with a YM-10 membrane and exchanged into 10 mM Tris pH 7.6 by repeated dilution/concentration. The solution was then loaded onto a batch column packed with DEAE Sepharose FF; protein was eluted with a stepwise gradient from 10–40 mM Tris. The solution was acidified with glacial acetic acid to pH 4.0 and precipitate isolated by centrifugation. Buffer was then exchanged to 25 mM sodium acetate pH 4.0 by desalting column. The solution was loaded onto a SP Sepharose FPLC column and eluted by pH gradient from 4–7. The protein was determined to be homogeneous by silver-stained PAGE; identity was verified by UV/vis and ESI-MS.
Redox Titrations
In a typical experiment, an aliquot of c551 was reduced by addition of sodium dithionite to 1 mM. This protein was then desalted into the appropriate buffer. To a 1 cm quartz cuvette was added buffer of appropriate pH and c551 to ~8 µM. Final solution volume was 2 mL. This solution was titrated with a ~ 500 µM solution of CuII C112D/M121E azurin in MilliQ water. Data were fit to the following expression:
| (1) |
where Vadd is the volume of CuII C112D/M121E azurin added, Vi is the initial volume (2 mL), [FeII]i is the starting c551 concentration, and [CuII]i is the concentration of the C112D/M121E azurin (ε310 = 1250 M−1cm−1). FeIII concentrations were calculated as the difference from the percentage of initial FeII concentration from the ratio of A520 to A551 according to the following expression:
| (2) |
pH dependent reduction potentials for c551 were taken from the literature.24
EPR Spectroscopy
Samples were prepared by 1:1 dilution of C112D/M121E holoazurin in water with 100 mM CHES (pH 9.0, pH 10.0), HEPES (pH 8.0, pH 7.0), or MES (pH 5.5). Glycerol was then added to 50% to facilitate glassing. Continuous wave (CW) X-band EPR spectra were recorded at 77 K on a Bruker EMX Biospin fitted with a liquid nitrogen cold finger. CW Q-band spectra were measured using a Bruker ESP-300E spectrometer with a Bruker Q-band cavity (ER5106QT) with Bruker flexline support and an Oxford Instruments helium cryostat (CF935). Microwave frequencies were measured with a Hewlett-Packard frequency counter (HP5352P), and the field control was calibrated with a Bruker NMR field probe (ER035M). Sample concentrations were ~1 mM. Spectra were simulated in SPINCOUNT.25
X-ray Absorption Spectroscopy
Cu K-edge X-ray absorption spectra (XAS), including a truncated extended x-ray absorption fine structure (EXAFS) region for normalization, were collected at the Stanford Synchrotron Radiation Lightsource at beam line 7-3 under ring conditions of 3 GeV and 200 mA. A Si(220) double-crystal monochromator was used for energy selection and a Rh-coated mirror (set to an energy cutoff of 13 keV) was used for harmonic rejection. Internal energy calibration was performed by assigning the first inflection point of a Cu foil spectrum to 8980.3 eV. Samples for XAS were prepared as for EPR spectroscopy, though only at pH 5.5, 7.0, and 10.0. Following addition of glycerol, samples were concentrated to ~3 mM. Proteins were loaded into 2 mm Delrin XAS cells with 38 µM Kapton windows and glassed by rapid immersion in liquid nitrogen. Data were collected in fluorescence mode (using a Canberra Ge 30-element array detector) windowed on the Cu Kα emission line. The sample was maintained at 10 K in an Oxford liquid helium flow cryostat. To minimize photoreduction of Cu(II), the incident beam intensity was attenuated by a factor of 3 with a four-layer aluminum Reynolds filter. Data were collected from 8660 to 9380 eV (k = 10 Å−1) to reduce collection time and thus photoreduction. Only one scan per 1 mm × 10 mm spot was averaged per sample. Scans were averaged and processed using the MAVE and PROCESS modules of the EXAFSPAK software package.26
X-ray Crystallography
Crystal growth procedures for C112D/M121X azurins have been reported previously.22,27 All X-ray diffraction experiments were carried out at the Caltech Molecular Observatory. Procedures for data collection, processing, and structural refinement followed a reported protocol.22 Coordinates and structure factors have been deposited in the RCSB Protein Data Bank, PDBIDs: 3NP3 (pH 7.0), 3NP4 (pH 9.0).
Results and Discussion
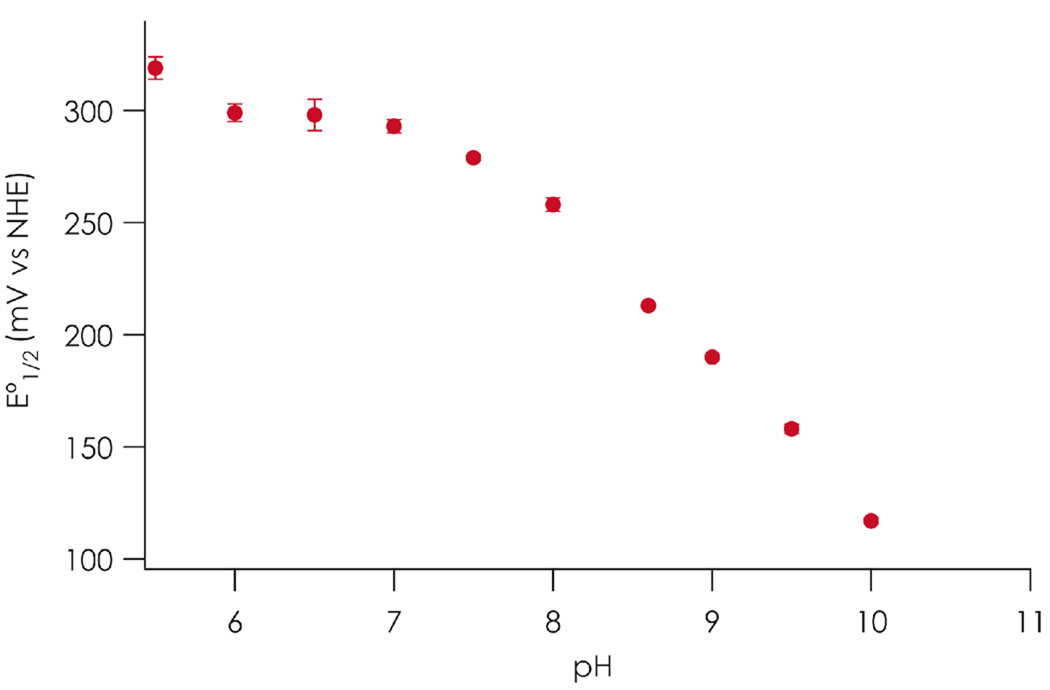
Reduction potentials for C112D/M121E azurin were calculated from equilibrium concentrations obtained from titrations with reduced c551 from pH 5.5 to 10.0 (Figure 1). Representative titration data are included in Supporting Information. Cytochrome c551 is an exceptional reagent for such titrations as it is intensely colored, displays easily quantifiable oxidation state changes, and is naturally suited for reactivity with azurin as its native ET partner. The pH range was chosen to make use of the noncoordinating buffers (MES, HEPES, and CHES) that avoid complications from buffer-driven metal coordination equilibria. Similar ionic strengths were used to minimize medium effects on equilibrium positions.
Figure 1.
pH dependence of the C112D/M121E azurin reduction potential (by cytochrome c551 titration in aqueous solutions at 298 K). Error bars represent one standard deviation of three titrations.
The unexpectedly high reduction potential of C112D/M121E azurin is maintained across the range pH 6.0 to 7.5. Below pH 6.0 the reduction potential begins to increase (319 ± 5 mV at pH 5.5). From pH 7.5 to 10.0 there is a precipitous drop in reduction potential from 292 ± 9 to 117 ± 1 mV with an apparent pKa ~ 9. Since the pKa of the glutamate carboxylate is 4.25,28 it is unlikely that this dramatic drop arises from a simple on-off ligation effect due to E121 protonation state. Rather, we attribute the rise in potential beginning ~ pH 5.5 to protonation of nonligated E121. In the native protein, a 50 mV decrease in reduction potential is observed as the pH is raised from 5.5 to 8.0.29 This arises due to deprotonation and thus removal of a positive charge from H35’s imidazole sidechain.30 Lu and co-workers have demonstrated the additive nature of factors that tune the azurin reduction potential;19 as such in C112D/M121E azurin the 175 mV drop in potential then likely represents both H35 deprotonation and ligation of the E121 carboxylate to CuII. This explanation for the increased drop in reduction potential does not come as a surprise given previous work on M121E azurin, which demonstrated vast electronic structural perturbations upon deprotonation of the axial carboxylic acid; the implication being that this event is the sole barrier to axial ligation.31–35 However, our finding that the reduction potential remains as high as 290 mV in the presence of what should be a CuII-stabilizing axial carboxylate is puzzling, a subject to which we now turn.
Spectroscopic and Structural Properties
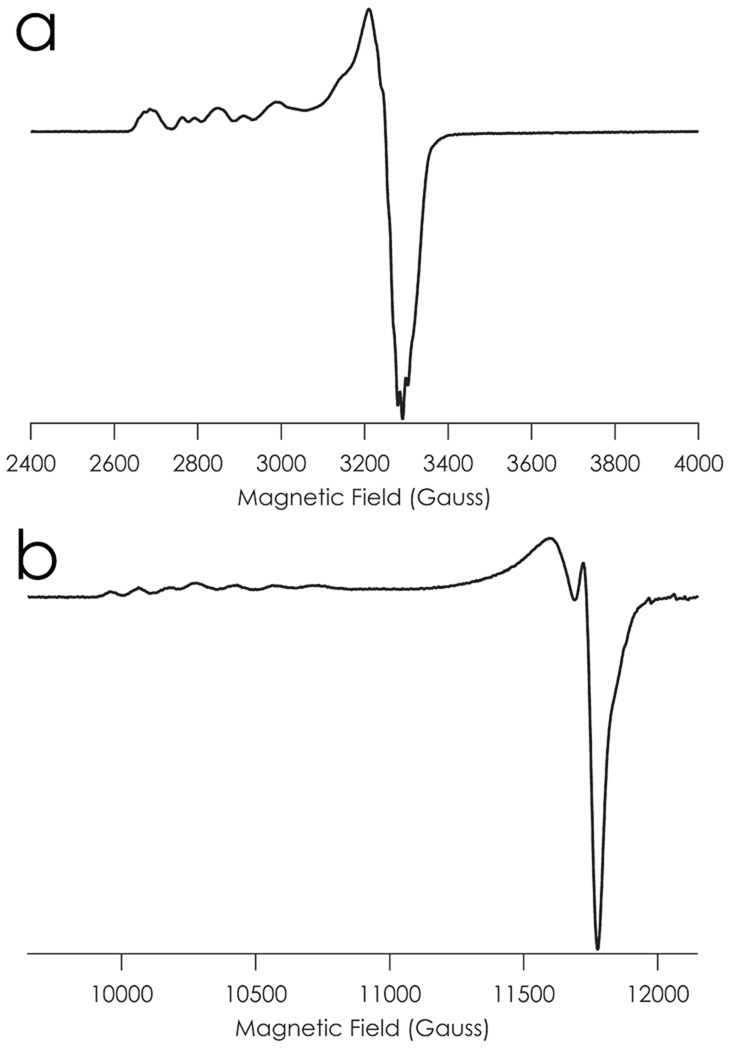
The X-band (9.75 GHz) EPR spectrum of a glassed pH 7.0 solution of C112D/M121E azurin recorded at 77 K displays a cluttered g‖ region (Figure 2a). A spectrum of the same sample recorded at Q-band (34 GHz) separates this absorption into two field-dependent four-line patterns, indicating that the pH 7.0 X-band spectrum arises from a mixture of two CuII species (Figure 2b). This obviates the possibility of attributing the fine structure of the g‖ region to superhyperfine splitting from the carboxylate proton, thus supporting ligation-state rather than protonation-state equilibrium modulation of the CuII/I reduction potential.
Figure 2.
EPR spectra of C112D/M121E azurin recorded in aqueous 77 K glass at pH 7.0 (50 mM HEPES) at a) X-band and b) Q-band.
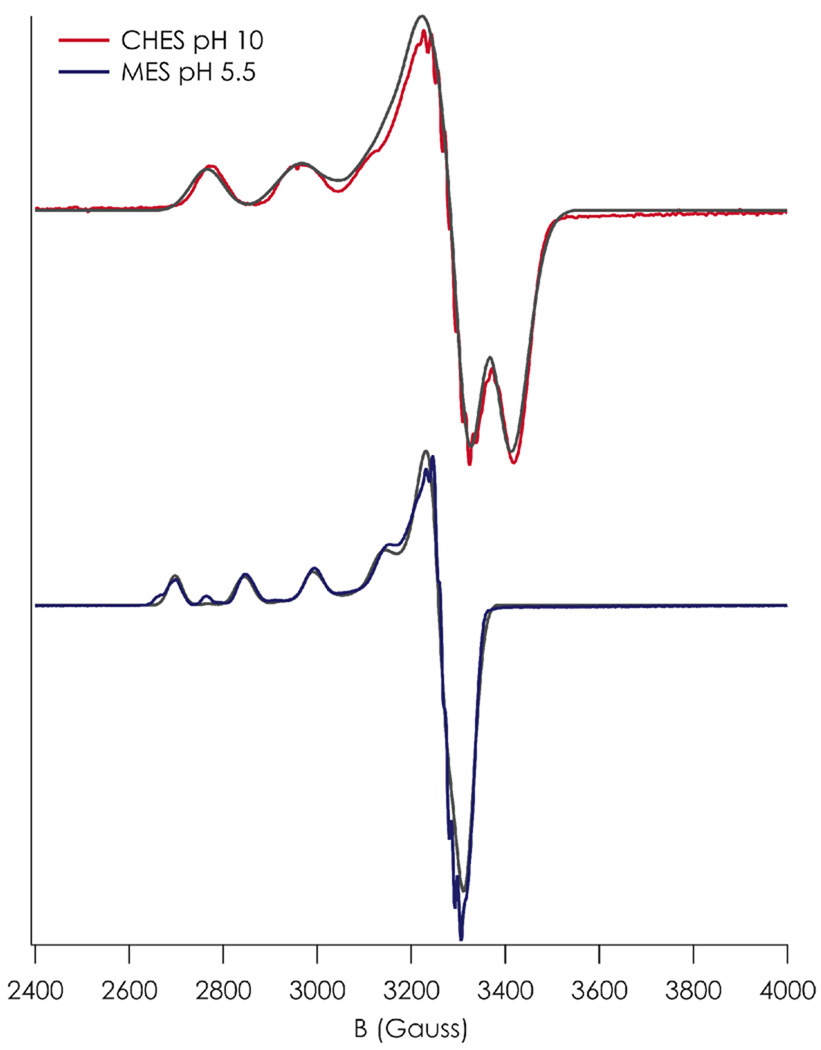
X-band EPR spectra were recorded in noncoordinating buffers (MES, HEPES, CHES) across the pH range 5.5 to 10 (Figure S3). Spectra corresponding to single species observed at the extrema of this range were simulated using the SPINCOUNT25 package (Table 1, Figure 3). Fine structure observed in g⊥ arises from a mixture of Cu A⊥ and AN⊥;36 within the limits of the X-band experiment their contributions cannot be deconvoluted and as such these spectroscopic features were not simulated. The pH 5.5 species has a typical axial type 2 CuII EPR signature. The pH 10.0 species also possesses a type 2 CuII spectrum, though it displays anisotropy in g⊥. The axial component of the g-tensor (gz) decreases from 2.311 ± 0.018 to 2.207 ± 0.047, and there is a substantial (4 mK) increase in axial hyperfine splitting (Az) at higher pH. The wider hyperfine splitting in the pH 10.0 species is likely attributed to an enlarged orbital dipolar contribution to the hyperfine based on its smaller gz.
Table 1.
Principal Components of Spin Hamiltonian g-Tensor and 63,65Cu (I = 3/2, 100% Abundance) Magnetic Hyperfine Tensor (A, mKa) Derived from SPINCOUNT25 Simulations of X-band EPR spectra at 77K.b
| pH | gx | gy | gz | σgx | σgy | σgz | Az(mK) | σAz(mK) |
|---|---|---|---|---|---|---|---|---|
| 5.5 | 2.067 | 2.067 | 2.312 | 0.017 | 0.017 | 0.019 | 15.8 | 0.1 |
| 10 | 2.027 | 2.078 | 2.212 | 0.017 | 0.024 | 0.038 | 19.8 | 0.5 |
1 mK = 10−3 cm−1.
Linewidths were modeled entirely by strain parameters, σg and σA.
Base simulation linewidth was set to 5 G in keeping with a 5 G modulation amplitude used in the experiment.
Figure 3.
X-band EPR spectra of C112D/M121E azurin in pH 5.5 (blue) and pH 10.0 (red) aqueous 77 K glass. SPINCOUNT25 simulations of each spectrum are overlaid in gray.
Anisotropy in g⊥ in a D4h-type coordination environment can arise from either lifting of 3dxz/yz degeneracy (as would be expected upon geometric distortion) or from mixing of 3dz2 character into the ground state wavefunction.37 At pH 5.5, g⊥ is isotropic within the precision of the X-band measurement. However, after accounting for error there is a substantial anisotropy is observed upon raising pH to 10.0, with Δgx,y = 0.051. Without directly observing the energies of the 3dx2-y2 to 3dxz and 3dx2-y2 to 3dyz LF transitions, the origin of this anisotropy is somewhat ambiguous. However, indirect evidence from X-ray diffraction studies suggests 3dz2 mixing is the operative mechanism (vide infra).
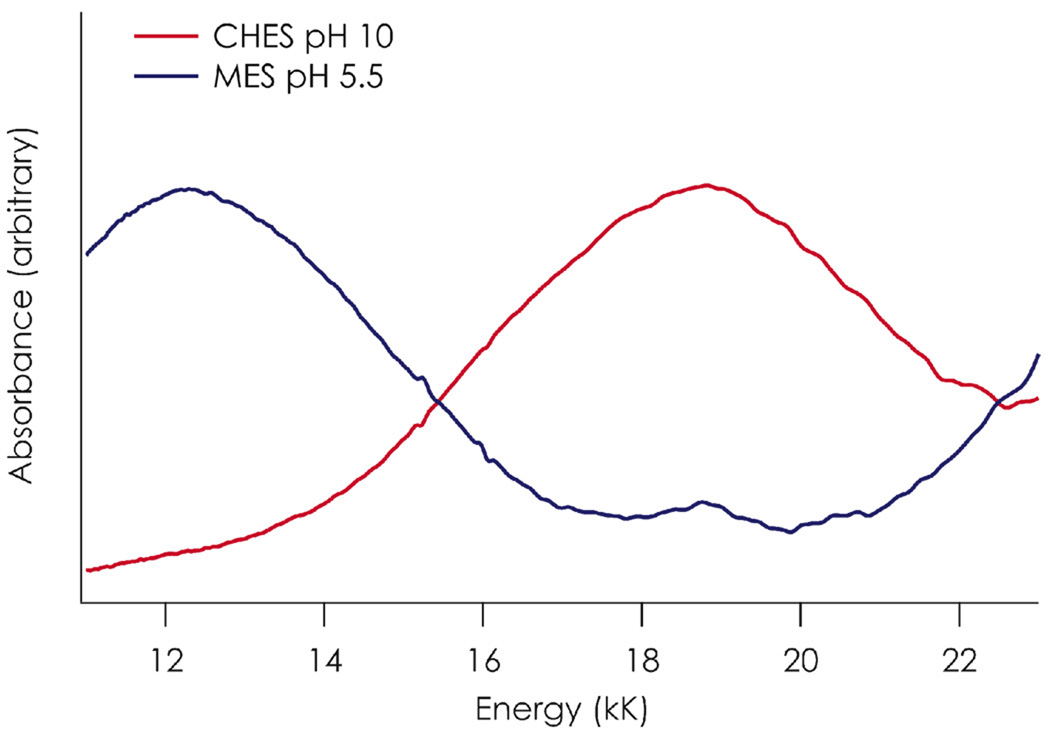
The electronic spectrum of C112D/M121E azurin at pH 5.5 displays a weak (ε ~ 70 M−1cm−1) CuII ligand field (LF) absorption band at 12.3 kK; this feature blue shifts to 18.9 kK at pH 10. The dramatically stronger LF at pH 10 most likely is attributable to E121 carboxylate coordination to CuII.
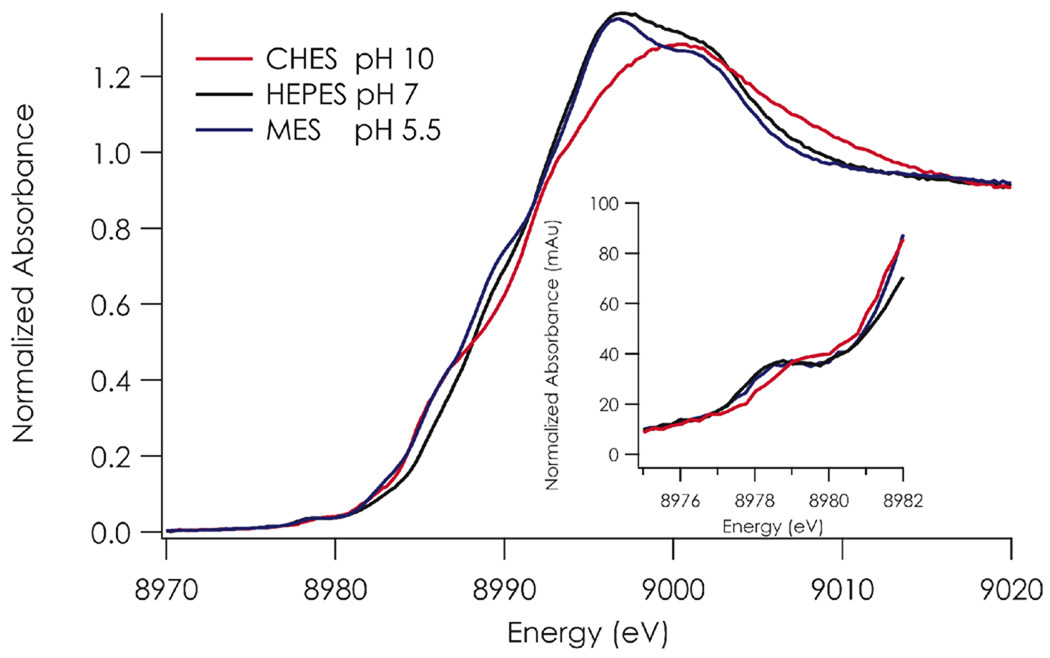
The Cu K-edge X-ray absorption near edge spectrum (XANES) of C112D/M121E azurin displays a pH dependence (Figure 5). The lowest energy feature is the ~8979 eV Cu 1s to 3d transition.38 This transition is forbidden in D4h/Oh symmetry (except for some quadrupolar intensity)39, but can gain intensity either through mixing of Cu 4p character into the ground state upon distortion to Td symmetry. We used this effect to quantify the degree of tetrahedral distortion present in the various type zero azurins by correlating the peak intensity with the Cu-O(G45) crystallographically determined bond distance.22 The 1s to 3d XANES band of C112D/M121E azurin gains no intensity across the observed pH range; rather, it remains very weak. This indicates minimal perturbation to site symmetry, suggesting that 3d orbital energy orderings and by extension degeneracies are preserved. However, the transition maximum shifts ~ 0.7 eV or ~6 kK to higher energy as a consequence of elevating the pH, reflecting increased energy of the frontier CuII 3d orbital. This shift accords with that observed in the visible spectrum (6.6 kK). As the XANES band corresponds to a transition from the CuII 1s to the frontier, half-filled 3d orbital, the data suggest that the LF band in the visible spectrum corresponds to a transition from the lowest-energy 3d level to the highest, and that the observed energy change in the visible spectrum reflects a perturbation primarily of the frontier 3d level. The observed shifts in gz in the EPR spectra are consistent with these 3d energy perturbations.
Figure 5.
Cu K-edge XAS of C112D/M121E azurin at pH 5.5 (blue), 7.0 (black), and 10.0 (red) at 10 K. Inset: the 1s to 3d transition is highlighted.
The second feature displaying a pH dependence is a ~8987 eV shoulder that has been assigned as a “shakedown” transition.38,40 This transition arises due to orbital contraction resulting from core vacancies following electron promotion. The energy of this transition has been correlated with covalency; lower energy reflects a more covalent site (i.e., one with less CuII and more ligand character in the ground state). The transition loses intensity and shifts to lower energy upon a rise in pH from 5.5 to 10.0.
Finally, the edge maximum (8995–9000 eV) also shows a pH dependence, which suggests that there is a structural rearrangement of the copper binding site in more basic solutions. An increase in coordination number upon axial carboxylate ligation logically explains this finding.
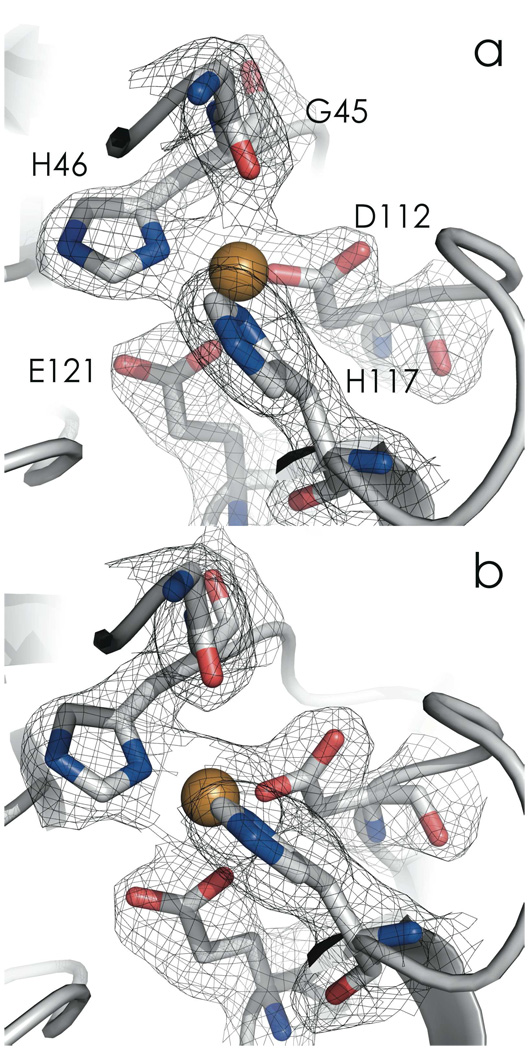
The redox and spectroscopic data suggest that C112D/M121E azurin adopts two conformations between pH 5.5 and 10.0 with a pKa of approximately pH 9.0. A pH 7.0 C112D/M121E crystal structure (2.1 Å resolution) revealed one of these conformations (Figure 6a, Table 2). A structure was obtained at pH 9.0 (2.25 Å resolution with acceptable refinement statistics; Figure 6b, Table 2), though there was increased disorder as reflected by elevation of the average thermal factors from 34.733 Å2 (pH 7.0) to 43.827 Å2 (pH 9.0).
Figure 6.
CuII active-site region C112D/M121E azurin at pH 7.0 (2.1 Å, a, PDBID: 3NP3) and pH 9.0 (2.25 Å, b, PDBID: 3NP4). 2Fo-Fc maps are displayed at the 1σ level. Nitrogen atoms are blue; oxygen atoms are red.
Table 2.
Crystallographic data collection statistics.
| pH 7.0 | pH 9.0 | |
|---|---|---|
| Space Group | C 2 2 21 | C 2 2 21 |
| A | 48.86 | 48.41 |
| B | 54.24 | 55.03 |
| C | 94.23 | 94.58 |
| α | 90° | 90° |
| β | 90° | 90° |
| γ | 90° | 90° |
| Resolution | 19.28–2.10 Å | 33.93–2.25 Å |
| Reflections | 7238 (534) | 5614 (404) |
| 99.9% | 94.1% | |
| Completeness | (99.8%) | (89.8%) |
| Multiplicity | 4.9 (5.0) | 3.3 (3.3) |
| I/sigmaI | 6.4 (2.1) | 8.7 (5.7) |
| 21.4% | 21.6% | |
| Rwork | (23.8%) | (21.7%) |
| 26.5% | 27.6% | |
| Rfree | (27.1%) | (22.5%) |
| e.s.u. (work) | 0.174 Å | 0.218 Å |
| e.s.u. (free) | 0.216 Å | 0.278 Å |
| Baverage | 34.733 Å2 | 43.827 Å2 |
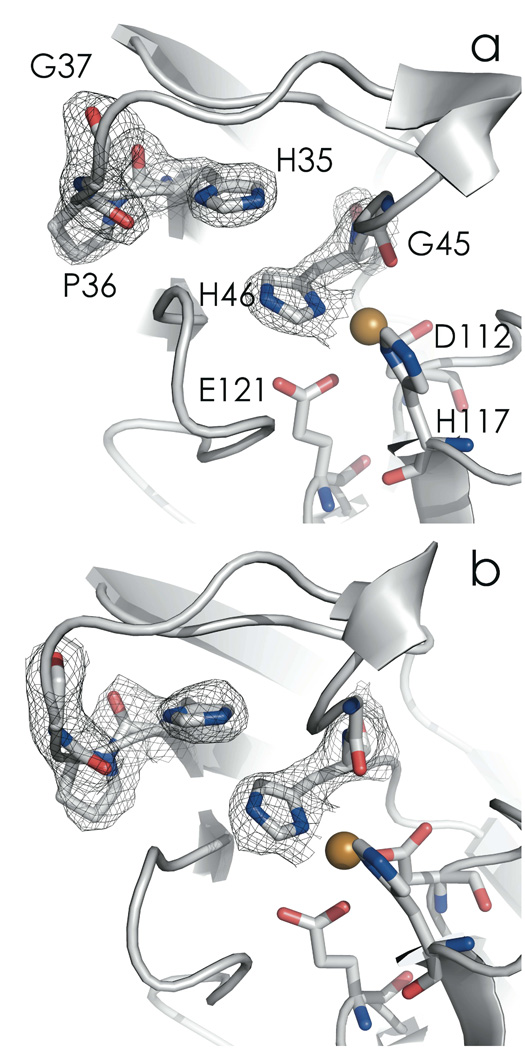
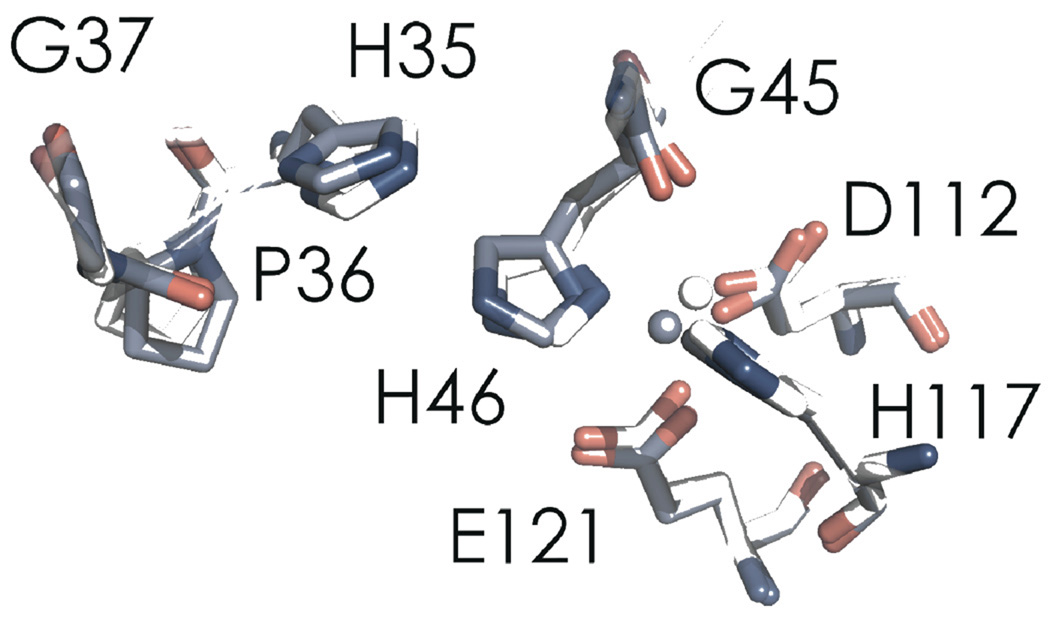
Increasing the pH from 7.0 to 9.0 triggers a rearrangement of the CuII binding site (Table 3). The closest Oε (E121)-CuII distance decreases from 2.67 to 2.24 Å, indicating a bonding interaction at the higher pH. In the WT protein, the amino nitrogen of H35 is deprotonated at pH 9.0, which leads to a peptide bond flip at P36 as H35 changes from a hydrogen-bond donor (to a backbone carbonyl) to a hydrogen-bond acceptor (from a backbone amide proton).30 This flip transition occurs with a pKa of 6.2 in WT azurin, whereas in C112D/M121E azurin, the H35 pKa is elevated, likely due to close proximity to a neutral metal binding site (as opposed to the monocationic site of WT azurin). Thus, at pH 9.0, the H35-P36 hydrogen bonding network is disrupted, but the peptide bond flip is not observed (Figure 7).41 However, H35 is dislocated; this adjustment propagates to H46, which allows the CuII ion to “sink” towards E121, thus establishing ligation (Figure 8). Lengthening of the CuII-O(G45) distance from 2.62 to 3.24 Å is consistent with this interpretation; the protein is not “loosened” to allow E121 access to the CuII – rather, the constraint imposed by H46 is relaxed, allowing CuII access to E121. Concomitant with shortening of the CuII-O(E121) distance are decreases in CuII-N(H46/117) distances. These stronger Cu-imidazole interactions likely elevate the 3dx2-y2 level and thus produce the blue shifted XANES and electronic absorption spectra.
Table 3.
Donor-atom distances to CuII (Å).
| pH 7.0 | pH 9.0 | |
|---|---|---|
| O(G45) | 2.62 | 3.24 |
| N(H46) | 1.96 | 1.76 |
| Oε1(D112) | 1.73 | 1.72 |
| Oε2(D112) | 3.25 | 3.55 |
| N(H117) | 2.06 | 1.99 |
| Oε1(E121) | 2.67 | 2.24 |
| Oε2(E121) | 3.94 | 3.37 |
Figure 7.
Active-site region showing the H35-P36 interaction in C112D/M121E azurin at pH 7.0 (2.1 Å, a, PDBID: 3NP3) and pH 9.0 (2.25 Å, b, PDBID: 3NP4). 2Fo-Fc maps are displayed at the 1σ level. Nitrogen atoms are blue; oxygen atoms are red.
Figure 8.
Cα structural alignment of C112D/M121E azurin at pH 7.0 (2.1 Å, a, PDBID: 3NP3, white) with the structure solved at pH 9.0 (2.25 Å, b, PDBID: 3NP4, slate).
The introduction of E121 as a bona fide ligand would lead to overlap between the O 2p/2s orbital’s of the carboxylate with the 3dz2 of CuII. The ensuing destabilization of 3dz2 would bring it closer to the frontier 3dx2-y2 orbital, promoting admixture. Thus the g⊥ anisotropy observed in the pH 10.0 EPR spectrum is likely attributable to 3dz2 mixing into the frontier molecular orbital wavefunction.
The decrease in reduction potential at elevated pH is, not surprisingly, a consequence of enhanced ligand field strength originating in E121 coordination as well as stronger CuII-imidazole interactions. That said, the high (~ 300 mV) reduction potential measured between pH 5.5 and 7.5 – even in the presence of a deprotonated axial carboxylate – demands discussion. Previous work on the type 1/1.5 M121H protein42 implicated protein flexibility as permitting ligation of the engineered axial histidine; in this case ligation was observed to be imidazole protonation state dependent. In short, when it is possible for H121 to ligate CuII, it will do so. In the present case, the deprotonated E121 is capable of ligating CuII, but does not. The H35/H46 interaction appears to impose a structural constraint on the protein; thus a rack mechanism is in operation.2,43 This structural frustration must, as has been proposed time and again for bona fide blue copper sites, account for the elevated potential. Though not operating in M121H azurin, rack mechanisms cannot be entirely dismissed in reduction potential tuning of protein-bound copper.
Conclusions
The elevated reduction potential of C112D/M121E azurin at pH 7.0 is attributable to rack-induced structural frustration. Spectroscopic studies demonstrate that axial carboxylate ligation is not protonation-state dependent. pH-dependent X-ray diffraction data reveal that structural constraints on the inner coordination sphere prevent the rearrangement required to permit ligation of CuII by Glu121. In light of these findings, the rack hypothesis for reduction potential tuning of CuII/I in azurin should be revisited; comparison to the behavior of M121H azurin suggests that such effects are case dependent, with seemingly subtle structural perturbations leading to vastly different redox behavior. The holistic role of the protein matrix in tuning the properties of bound metal ion cofactors must be appreciated in order to achieve design mastery over engineered constructs.
Supplementary Material
Figure 4.
Electronic absorption spectra of C112D/M121E azurin in pH 5.5 (blue) and 10.0 (red) aqueous solutions at 298 K.
Acknowledgements
We thank Prof. Serena DeBeer and Prof. Israel Pecht for insightful discussions. This work was supported by NIH (DK019038 to HBG). Portions of this research were carried out at the Stanford Synchrotron Radiation Lightsource, a national user facility operated by Stanford University on behalf of the U.S. Department of Energy, Office of Basic Energy Sciences. The SSRL Structural Molecular Biology Program is supported by the Department of Energy, Office of Biological and Environmental Research, and by the National Institutes of Health, National Center for Research Resources, Biomedical Technology Program.
Footnotes
Supporting Information
Representative redox titration, EPRs across the experimental pH range, and pH 10.0 crystal structure data. This material is available free of charge via the Internet at http://pubs.acs.org.
References
- 1.Banci L, Bertini I, Luchinat C, Turano P. In: Biological Inorganic Chemistry: Structure and Reactivity. Bertini I, Gray HB, Stiefel EI, Valentine JS, editors. Sausalito: University; 2007. pp. 229–277. [Google Scholar]
- 2.Gray HB, Malmstrom BG, Williams RJP. J. Biol. Inorg. Chem. 2000;5:551–559. doi: 10.1007/s007750000146. [DOI] [PubMed] [Google Scholar]
- 3.Solomon EI, Szilagyi RK, DeBeer George S, Basumallick L. Chem. Rev. 2004;104:419–458. doi: 10.1021/cr0206317. [DOI] [PubMed] [Google Scholar]
- 4.Gewirth AA, Solomon EI. J. Am. Chem. Soc. 1988;110:3811–3819. [Google Scholar]
- 5.Regan JJ, Di Bilio AJ, Langen R, Skov LK, Winkler JR, Gray HB, Onuchic JN. Chem. Biol. 1995;2:489–496. doi: 10.1016/1074-5521(95)90266-x. [DOI] [PubMed] [Google Scholar]
- 6.DeBeer S, Wittung-Stafshede P, Leckner J, Karlsson G, Winkler JR, Gray HB, Malmström BG, Solomon EI, Hedman B, Hodgson KO. Inorg. Chim. Acta. 2000;297:278–282. [Google Scholar]
- 7.Karlsson BG, Aasa R, Malmström BG, Lundberg LG. FEBS Lett. 1989;253:99–102. [Google Scholar]
- 8.Shephard WEB, Anderson BF, Lewandoski DA, Norris GE, Baker EN. J. Am. Chem. Soc. 1990;112:7817–7819. [Google Scholar]
- 9.Crane BR, Di Bilio AJ, Winkler JR, Gray HB. J. Am. Chem. Soc. 2001;123:11623–11631. doi: 10.1021/ja0115870. [DOI] [PubMed] [Google Scholar]
- 10.Li H, Webb SP, Ivanic J, Jensen JH. J. Am. Chem. Soc. 2004;126:8010–8019. doi: 10.1021/ja049345y. [DOI] [PubMed] [Google Scholar]
- 11.Pascher T, Karlsson BG, Nordling M, Malmström BG, Vänngård T. Eur. J. Biochem. 1993;212:289–296. doi: 10.1111/j.1432-1033.1993.tb17661.x. [DOI] [PubMed] [Google Scholar]
- 12.Hall JF, Kanbi LD, Strange RW, Hasnain SS. Biochemistry. 1999;38:12675–12680. doi: 10.1021/bi990983g. [DOI] [PubMed] [Google Scholar]
- 13.Berry SM, Ralle M, Low DW, Blackburn NJ, Lu Y. J. Am. Chem. Soc. 2003;125:8760–8768. doi: 10.1021/ja029699u. [DOI] [PubMed] [Google Scholar]
- 14.Garner DK, Vaughan MD, Hwang HJ, Savelieff MG, Berry SM, Honek JF, Lu Y. J. Am. Chem. Soc. 2006;128:15608–15617. doi: 10.1021/ja062732i. [DOI] [PubMed] [Google Scholar]
- 15.Donaire A, Jiménez B, Moratal J-M, Hall JF, Hasnain SS. Biochemistry. 2001;40:837–846. doi: 10.1021/bi001971u. [DOI] [PubMed] [Google Scholar]
- 16.Donaire A, Jiménez B, Fernández CO, Pierattelli R, Niizeki T, Moratal J-M, Hall JF, Takamitsu K, Hasnain SS, Vila AJ. J. Am. Chem. Soc. 2002;124:13698–13708. doi: 10.1021/ja0267019. [DOI] [PubMed] [Google Scholar]
- 17.Yanagisawa S, Banfield MJ, Dennison C. Biochemistry. 2006;45:8812–8822. doi: 10.1021/bi0606851. [DOI] [PubMed] [Google Scholar]
- 18.Battistuzzi G, Borsari M, Loschi L, Menziani MC, De Rienzo F, Sola M. Biochemistry. 2001;40:6422–6430. doi: 10.1021/bi002565d. [DOI] [PubMed] [Google Scholar]
- 19.Marshall NM, Garner DK, Wilson TD, Gao Y-G, Robinson H, Nilges MJ, Lu Y. Nature. 2009;462:113–116. doi: 10.1038/nature08551. [DOI] [PMC free article] [PubMed] [Google Scholar]
- 20.Mizoguchi TJ, Di Bilio AJ, Gray HB, Richards JH. J. Am. Chem. Soc. 1992;114:10076–10078. [Google Scholar]
- 21.Lancaster KM, Yokoyama K, Richards JH, Winkler JR, Gray HB. Inorg. Chem. 2009;48:1278–1280. doi: 10.1021/ic802322e. [DOI] [PMC free article] [PubMed] [Google Scholar]
- 22.Lancaster KM, DeBeer George S, Yokoyama K, Richards JH, Gray HB. Nat. Chem. 2009;1:711–715. doi: 10.1038/nchem.412. [DOI] [PMC free article] [PubMed] [Google Scholar]
- 23.Russell BS, Zhong L, Bigotti MG, Cutruzzolà F, Bren KL. J. Biol. Inorg. Chem. 2003;8:156–166. doi: 10.1007/s00775-002-0401-z. [DOI] [PubMed] [Google Scholar]
- 24.Moore GR, Pettigrew GW, Pitt RC, Williams RJP. Biochim. Biophys. Acta. 1980;590:261–271. doi: 10.1016/0005-2728(80)90030-4. [DOI] [PubMed] [Google Scholar]
- 25.Golombek AP, Hendrich MP. J. Magn. Reson. 2003;165:33–48. doi: 10.1016/j.jmr.2003.07.001. [DOI] [PubMed] [Google Scholar]
- 26.George GN. EXAFSPAK. (Stanford Synchrotron Radiation Lightsource, Stanford Linear Accelerator Center, Stanford University); [Google Scholar]
- 27.Faham S, Mizoguchi TJ, Adman ET, Gray HB, Richards JH, Rees DC. J. Biol. Inorg. Chem. 2000;2:464–469. [Google Scholar]
- 28.Nelson DL, Cox MM. Lehninger Principles of Biochemistry. 3rd ed. New York: Worth; 2003. [Google Scholar]
- 29.Pettigrew GW, Leitch FA, Moore GR. Biochim. Biophys. Acta. 1983;725:409–416. doi: 10.1016/0005-2728(83)90181-0. [DOI] [PubMed] [Google Scholar]
- 30.Nar H, Messerschmidt A, Huber R, van de Kamp M, Canters GW. Crystal Structure Analysis of Oxidized Pseudomonas aeruginosa azurin at pH 5.5 and pH 9.0. J. Mol. Biol. 1991;221:765–772. doi: 10.1016/0022-2836(91)80173-r. [DOI] [PubMed] [Google Scholar]
- 31.Di Bilio AJ, Chang TK, Malmström BG, Gray HB, Karlsson BG, Nordling M, Pascher T, Lundberg LG. Inorg. Chim. Acta. 1992:145–148. [Google Scholar]
- 32.Andrew CR, Yeom H, Valentine JS, Karlsson BG, Bonander N, van Pouderoyen G, Canters GW, Loehr TM, Sanders-Loehr J. J. Am. Chem. Soc. 1994;116:11489–11498. [Google Scholar]
- 33.Strange RW, Murphy LM, Karlsson BG, Reinhammar B, Hasnain SS. Biochemistry. 1996;50:16391–16398. doi: 10.1021/bi961682z. [DOI] [PubMed] [Google Scholar]
- 34.Karlsson BG, Tsai L-C, Nar H, Sanders-Loehr J, Bonander N, Langer V, Sjölin L. Biochemistry. 1997;36:4089–4095. doi: 10.1021/bi962416o. [DOI] [PubMed] [Google Scholar]
- 35.Webb MA, Kiser CN, Richards JH, Di Bilio AJ, Gray HB, Winkler JR, Loppnow GR. J. Phys. Chem. B. 2000;104:10915–10920. [Google Scholar]
- 36.Antholine WE, Hanna PM, McMillin DR. Low Frequency EPR of Pseudomonas aeruginosa Azurin. Biophys. J. 1993;64:267–272. doi: 10.1016/S0006-3495(93)81363-8. [DOI] [PMC free article] [PubMed] [Google Scholar]
- 37.Gewirth AA, Cohen SL, Schugar HJ, Solomon EI. Inorg. Chem. 1987;26:1133–1146. [Google Scholar]
- 38.Shadle SE, Penner-Hahn JE, Schugar HJ, Hedman B, Hodgson KO, Solomon EI. J. Am. Chem. Soc. 1993;115:767–776. [Google Scholar]
- 39.Hahn JE, Scott RA, Hodgson KO, Doniach S, Desjardins SR, Solomon EI. Chem. Phys. Lett. 1982;88:595–598. [Google Scholar]
- 40.DeBeer S, Kiser CN, Mines GA, Richards JH, Gray HB, Solomon EI, Hedman B, Hodgson KO. Inorg. Chem. 1999;38:433–438. doi: 10.1021/ic9804622. [DOI] [PubMed] [Google Scholar]
- 41.As the pH 9.0 structure represents a point toward the center of the equilibrium, we collected diffraction data at pH 10.0 to confirm the P36/G37 peptide flip. Despite missing electron density and hence poor refinement statistics, we could unequivocally resolve the structural rearrangement in this region (Figure S4, Tables S1–2).
- 42.Messerschmidt A, Prade L, Kroes SJ, Sanders-Loehr J, Huber R, Canters GW. Proc. Natl. Acad. Sci. U.S.A. 1998;95:3443–3448. doi: 10.1073/pnas.95.7.3443. [DOI] [PMC free article] [PubMed] [Google Scholar]
- 43.Malmström BG. Eur. J. Biochem. 1994;223:711–718. doi: 10.1111/j.1432-1033.1994.tb19044.x. [DOI] [PubMed] [Google Scholar]
Associated Data
This section collects any data citations, data availability statements, or supplementary materials included in this article.


