

Summary
Latent profile analysis (LPA) has been used previously to classify neurobehavioral responses of infants prenatally exposed to cocaine and other drugs of abuse. The objective of this study was to define NICU Network Neurobehavioral Scale (NNNS) profile response patterns in a cohort of infants with no known cocaine exposure or other risks for neurobehavior deficits, and determine whether these profiles predict neurobehavioral outcomes in these low-risk infants. NNNS exams were performed on 355 low-risk infants at approximately 5 weeks after birth. LPA was used to define discrete profiles based on the standard NNNS summary scales. Associations between the infant profiles and neurobehavioral outcomes at one to three years of age were examined.
Twelve of the 13 summary scales were used and three discrete NNNS profiles identified: social/easy going infants (44%), hypotonic infants (24%), and high arousal/difficult infants (32%). Statistically significant associations between NNNS profiles and later neurobehavioral outcomes were found for psychomotor development and externalizing behaviors. Hypotonic infants had both lower psychomotor development and lower externalizing scores compared to the other two profiles.
In conclusion, three distinct profiles of the NNNS summary scores were identifiable using LPA among infants with no known cocaine exposure. These profile patterns were associated with early childhood neurobehavioral outcome, similar to findings reported in a study of infants with substantial cocaine exposure, demonstrating the utility of this profiling technique in both exposed and unexposed populations.
Introduction
The NICU Network Neurobehavioral Scale (NNNS) measures neurologic function, behavior, and signs of stress in early infancy.1 The NNNS has been used to assess neurobehavior in infants prenatally exposed to cocaine and opiates,2,3,4 methamphetamine,5,6 tobacco smoke,7,8,9 and methadone.10 It has also been used to study the impact of maternal depression,11 prematurity,12 intrauterine growth restriction,13 and treatment for neonatal drug withdrawal14 on infant neurobehavior. It is an instrument appropriate for use in a broad spectrum of infants, both low and high risk for neurobehavioral deficits. The scoring system of the NNNS provides measures for 13 summary scales: habituation, attention, arousal, self-regulation, special handling needed from the examiner to assist the infant through the exam, quality of movement, excitability, lethargy, non-optimal reflexes, asymmetric reflexes, hypertonicity, hypotonicity, and stress/abstinence. With 13 distinct summary measures, determining an overall exam response can be difficult. An infant could show poor performance on some scales while performing well on others. Additionally, the scales have varying ranges. Overall, it can be difficult to compare NNNS performance among infants. Grouping response patterns into discrete profiles provides an alternative simple summary method for comparing NNNS performance among infants.
Latent profile analysis is a technique that can be used to identify groups of individuals with similar response patterns on measured variables. This technique was previously applied to NNNS data from a sample of high-risk infants with a large percentage (47%) exposed to cocaine in utero.2 In the current study, the latent profile technique was applied to NNNS data obtained from a group of low-risk infants with no known prenatal cocaine or opiate exposure. Our objective was to define NNNS profile response patterns in this group of low-risk infants, determine whether these profiles predict early childhood neurobehavioral outcomes, and also provide a useful method for assigning profile membership.
Methods
The Health Outcomes and Measures of the Environment (HOME) Study is a prospective birth cohort study with the goal of evaluating the impact of low-level prenatal and early childhood exposure to a variety of environmental toxicants on child health and development. The study methods have been described in detail elsewhere.15,16 Briefly, pregnant women aged 18 or older were enrolled in the study at 16 ± 3 (mean ± SD) weeks’ gestation. Women resided in preselected enrollment areas in the Cincinnati region and received prenatal care from one of nine participating obstetrical clinics. The sample is socioeconomically diverse, including urban, suburban, and rural participants. Institutional review boards of all involved research institutions, hospitals, and laboratories approved the study protocol.
A total of 468 women were enrolled in the study; 398 remained in the study and delivered live infants. Of the 398 women, 9 delivered twins and were excluded from the analysis. Of the 389 singletons, 355 were examined at approximately 5 weeks (median 35 days, range: 17 - 51 days) in the home, and were included in this analysis.
Neurobehavioral Examinations
The NNNS was completed by one of four examiners trained to reliability on the measure. Five week exams were completed in a quiet room during a home visit while the mother was engaged in a study interview in a separate area. A majority of the exams (89%) were done with the examiner and baby alone in the testing room. The NNNS begins with a baseline observation of respiration, color, and tone. If the infant is asleep, a sequence of habituation items is presented to measure the infant’s ability to process visual, auditory, and tactile stimuli, and to protect sleep. The habituation package is often omitted due to the sleep requirement. Examination of primitive reflexes is done, followed by passive and active tone assessment, and then social interaction components and an assessment of attention. The stress/abstinence component consists of a checklist of items, organized by organ systems, that indicate stress or abstinence as evidence of central nervous system compromise. Stress/abstinence items are scored if they occur at any point in the exam. Additional neurological items are completed, followed by a post-exam observation of respiration, color, and tone to complete the assessment.
Childhood neurobehavioral assessments were completed during annual follow-up visits to the study clinic. The Bayley Scales of Infant Development – II17 were administered to children by a trained examiner at 12-, 24-, and 36-months of age. The Bayley II provides an age-standardized assessment of cognitive (mental development index-MDI) and motor (psychomotor development index-PDI) performance and is considered the gold standard developmental assessment. The Behavior Assessment System for Children-2 (BASC2)18 was used to measure child behavior problems within the past 2 weeks as reported by the primary caregiver at ages 24- and 36-months. For the BASC2, we used age standardized T-scores for the composite clinical scales (externalizing problems, internalizing problems, behavioral symptoms index, adaptive skills). This instrument is used in clinical and research settings to provide a broad description of child behaviors that may be problematic or adaptive. Clinically significant scores are defined by cutoffs of <70 for Bayley, ≥70 for BASC2 externalizing, internalizing, and behavioral symptom index, and ≤30 for BASC2 adaptive skills.
Data Analyses
Given the sleep requirement for the habituation assessment, results were only available for 11% of the infants for this scale and were not considered for this analysis. Due to the majority of scores being 0 or 1 (99.7% for hypertonicity and 96.6% for hyptonia), hypertonicity and hypotonia were dichotomized as present or absent for increased muscle tone and present or absent for hypotonic responses in arms, legs, or trunk or in general tone, respectively. For hypertonicity, only one infant had a score of 2; for hypotonicity, nine infants had a score of 2 and three infants had a score of 3. All other scores were kept as interval variables.
We used LPA to combine the 12 NNNS summary scores to classify infants into discrete profiles. Infants with similar patterns of NNNS summary scores are grouped together within a latent profile. Thus, the heterogeneity of NNNS scores across 12 summary domains is minimized within a profile and maximized across the other profiles identified by the method. The analysis was implemented using finite mixture modeling in Mplus 5 using maximum likelihood.19 The models allowed for the correlation of NNNS summary scores with overlapping components and unequal variances of the summary scores across profiles. Random starts were used to ensure replication of the best loglikelihood and to avoid local maxima. Initially, two profiles were specified for the LPA model. In a stepwise fashion, the number of profiles specified was increased by one. At each step, changes in Bayesian information criteria (BIC), adjusted for sample size, was used to access model fit. The number of profiles was deemed adequate at the point when no significant drop in BIC was noted as the profile number increased as assessed by visual inspection of the scree plot of BIC values for increasing profile number. In addition, the Lo-Mendell-Rubin adjusted likelihood ratio test, average posterior probability (entropy), and group membership probabilities were also used to assess model fit.20
Once the appropriate number of profiles was determined, standardized scores were computed to compare summary scores on the same scale across the different profiles. This was done for each summary score by subtracting the overall mean from individual scores and dividing by the overall standard deviation for that summary score. Differences in summary score means between the profiles were evaluated using Analysis of variance (ANOVA). Differences in maternal and infant characteristics between the profiles were evaluated using the Chi-square test, or Fisher’s exact test for small counts, for categorical variables, and ANOVA, or Kruskal-Wallis test, for continuous variables. Generalized linear regression models using Generalized Estimating Equations (GEE) were used to determine the association between profiles and neurobehavioral outcomes measured at ages 12-, 24-, and 36-months for the Bayley outcomes, and ages 24- and 36-months for BASC2 outcomes. Covariates in the models were sex, race, age at exam, maternal age, maternal depression, maternal education, maternal serum cotinine (prenatal), and parity.
An algorithm for assigning profile membership by computing posterior profile probabilities is presented in Appendix 1. This algorithm allows assignment of profile membership for infants that were not included in the estimation procedure. The accuracy of this algorithm for defining profile membership was tested by applying the algorithm to the same 355 infants with 5-week NNNS exams used in the LPA and comparison with actual assignment.
Results
A total of 355 women gave birth to a singleton infant and had an NNNS examination at 5-weeks. Characteristics of this cohort are shown in Table 1. The mean age of the mothers at the time of delivery was 29.6 years. A majority of the women were married (67%), had a high school diploma (91%), and were employed (83%). Very few women (7%) reported marijuana use during pregnancy, and none of the women reported cocaine or opiate use. The majority (85%) of the women reported having fewer than one alcoholic drink per month during pregnancy. Active smoking during pregnancy was reported by 40 (11%) of the women, of which 30 (75%) had a cotinine level of > 3 ng/ml at one or more time points. Based on a cotinine level of > 3 ng/ml, 41 (12%) of the women would be considered active smokers during pregnancy.21 Few infants (9%) were born prior to 37 weeks gestational age, and there was no difference between profile groups (p-value = 0.73); mean gestational age at birth was 39 weeks. Very few infants (n=17, 5%) were sent to the neonatal intensive care unit (NICU) with stays ranging from 3 hours to 30 days.
Table 1.
Characteristics of the HOME Study cohort with the NICU Network Neurobehavioral Scale
| Cohort (n=355) | |
|---|---|
| Maternal characteristics | |
| Maternal age (years) | 29.6 ± 5.8 |
| Race (African-American) | 110 (31%) |
| Marital status | |
| Married | 237 (67%) |
| Not married living with someone | 48 (14%) |
| Not married living alone | 70 (20%) |
| Household income ($K) | 55 (25, 85) |
| Employed | 293 (83%) |
| >HS or GED | 324 (91%) |
| Moderate to Severe Depression (BDI ≥ 20) | 28 (8%) |
| Anti-depressant medication use | 26 (7%) |
| Marijuana use during pregnancy | 25 (7%) |
| Alcohol use during pregnancy | |
| Never drank alcohol | 196 (55%) |
| Alcohol use <1/mo | 107 (30%) |
| Alcohol use >1/mo | 52 (15%) |
| Tobacco smoke exposure | |
| Reported active smoking | 40 (11%) |
| Maternal max serum cotininea > 3 ng/ml | 41 (12%) |
| Maternal max serum cotininea (ng/ml) | 0.10 [0.0005, 18] |
| Infant characteristics | |
| Male | 166 (47%) |
| Birthweight (g) | 3388 ± 612 |
| Gestational age (weeks) | 39.0 ± 1.7 |
| Gestational age <37 weeks | 31 (9%) |
| Gestational age at exam (weeks) | 43.8 ± 2.1 |
| Birth order | |
| First child | 155 (44%) |
| Second child | 115 (32%) |
| >Second child | 85 (24%) |
| NICU stay (yes) | 17 (5%) |
| Length of NICU stay (days) | 8.8 ± 8.7 |
Measured at three time points: 16 and 28 weeks gestation and at delivery.
Data expressed as mean ± standard deviation, median (25th, 75th percentile), geometric mean [95% confidence interval] or n (%).
NNNS Profiles
To determine the optimal number of profiles, we ran four LPA models specifying one to four profiles. The change in BIC with each increase in profile was noted, along with entropy and group membership probabilities. A three profile solution was deemed adequate. The adequacy of three profiles was confirmed by the Lo-Mendel-Rubin adjusted likelihood ratio test with significant test results comparing models with 2 and 3 (p-value = 0.03) profiles and no significant test results comparing models with 3 and 4 profiles (p-value = 0.81). The NNNS scores for the final model with three profiles are summarized in Table 2. Means of the standardized scores by profile are shown in Figure 1.
Table 2.
NICU Network Neurobehavioral Scale summary scores by profiles
| NNNS Summary | Social/Easy Going (N=158, 44%) |
Hypotonic (N=85, 24%) |
High Arousal/Difficult (N=112, 32%) |
|---|---|---|---|
| Attention | 5.9 ± 1.3 | 5.5 ± 1.4 | 4.6 ± 1.2 |
| Handling | 0.3 ± 0.3 | 0.4 ± 0.3 | 0.7 ± 0.2 |
| Self-regulation | 6.0 ± 0.5 | 5.6 ± 0.8 | 4.8 ± 0.6 |
| Arousal | 3.9 ± 0.4 | 3.9 ± 0.7 | 4.8 ± 0.5 |
| Excitability | 1.3 ± 1.2 | 1.8 ± 1.9 | 4.4 ± 1.5 |
| Lethargy | 4.0 ± 1.5 | 4.4 ± 1.7 | 4.1 ± 2.1 |
| Hypertonicity | 0% | 2% | 10% |
| Hypotonicity | 0% | 100% | 0% |
| Nonoptimal reflexes | 4.0 ± 1.6 | 4.4 ± 1.4 | 3.7 ± 1.9 |
| Asymmetric reflexes | 1.4 ± 1.2 | 1.4 ± 1.2 | 0.9 ± 0.8 |
| Quality of movement | 5.0 ± 0.5 | 4.8 ± 0.6 | 4.6 ± 0.6 |
| Stress abstinence | 0.12 ± 0.05 | 0.13 ± 0.04 | 0.16 ± 0.06 |
Data expressed as mean ± standard deviation or percentage.
P-values for difference in means across profiles were all < 0.01, except for lethargy with a p-value of 0.15.
Figure 1.
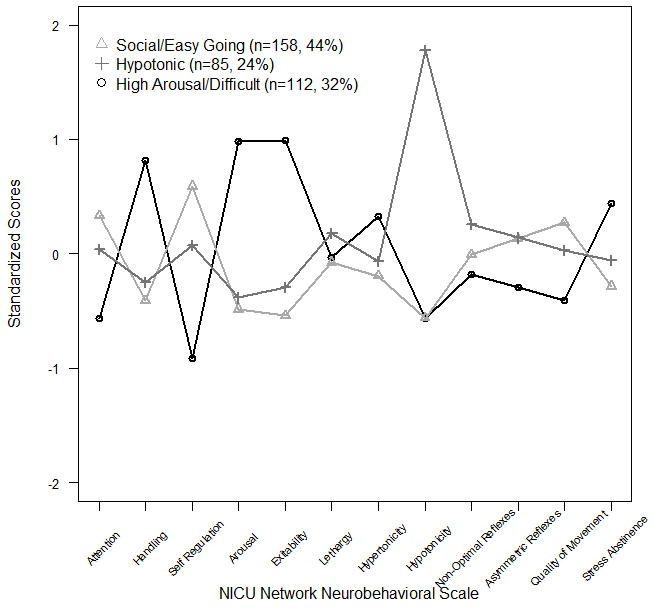
NICU Network Neurobehavioral Scale profiles at 5-weeks (N=355)
Based on the description of the NNNS response patterns of each profile, the three profiles were labeled as social/easy going, hypotonic, and high arousal/difficult. The social/easy going profile included 158 (44%) infants and showed the “best” neurobehavioral performance during the NNNS examination. These infants had the highest mean standardized scores for attention, self-regulation, and quality of movement; the lowest mean standardized scores for handling, arousal, excitability, and stress abstinence; and average standardized scores for lethargy, non-optimal reflexes, and asymmetric reflexes (Figure 1). Conversely, the high arousal/difficult profile included 112 (32%) infants and had the highest mean standardized scores for handling, arousal, excitability, and stress abstinence; the lowest mean standardized scores for attention, self regulation, non-optimal reflexes, asymmetric reflexes, and quality of movement; and average mean standardized score for lethargy. The hypotonic profile included 85 (24%) infants all with signs of hypotonia (100%) along with the highest mean standardized scores for lethargy and non-optimal reflexes.
To evaluate the profile classifications, the three profiles were compared for maternal and infant characteristics, and no significant differences were observed (Table 3). Although not statistically significant, a slightly higher percentage of infants in the hypotonic profile had mothers who reported anti-depressant medication use during pregnancy (13%) compared to infants in the social/easy going profile (6%) and the high arousal/difficult profile (5%) (p-value = 0.07). The three profiles were compared for early childhood neurobehavioral outcomes measured at 12, 24 and 36 months (Table 4). Follow-up neurobehavioral outcomes were available for the Bayley on 315 infants (310 at 12 months, 260 at 24 months, and 236 at 36 months) and BASC2 for 281 infants (264 at 24 months and 245 at 36 months). Few infants had clinically significant scores at any point during the follow-up. For the Bayley 38 (12%) had clinically defined PDI, and 30 (9%) had clinically defined MDI, at any of the three follow-up time periods. For the BASC2 clinically defined criteria were met for 9 (30%) externalizing, 8 (3%) internalizing, 8 (3%) behavior symptoms, and 10 (4%) adaptive skills at either of the follow-up time points. Using the raw scores, we found that the hypotonic profile infants had a significantly lower mean PDI (mean ± SE of 91.7 ± 1.7) compared to both the social/easy going (95.4 ± 1.4) and high arousal/difficult infants (97.3 ± 1.6). The hypotonic infants also had a lower mean externalizing score (50.8 ± 1.0) compared to the social/easy going (53.2 ± 1.0) group. No significant differences were observed between the social/easy going and high arousal/difficult groups for these neurobehavioral outcomes.
Table 3.
Comparison of maternal, infant, and labor and delivery characteristics by profiles
| Variable | Social/Easy Going (n=158) |
Hypotonic (n=85) |
High Arousal/Difficult (n=112) |
P-valuea |
|---|---|---|---|---|
| Maternal characteristics | ||||
| Maternal age (years) | 30 ± 5.6 | 30 ± 6.2 | 29 ± 5.7 | 0.30 |
| Race (African-American) | 44 (28%) | 25 (29%) | 41 (37%) | 0.29 |
| Married/living with someone | 113 (83%) | 82 (80%) | 47 (84%) | 0.18 |
| Household income | 55 (27.5, 85) | 55 (27.5, 75) | 45 (22.5, 85) | 0.16b |
| Employed | 130 (82%) | 69 (81%) | 94 (84%) | 0.88 |
| 4 year college degree | 90 (57%) | 44 (52%) | 51 (46%) | 0.18 |
| Mod/Sev Depression (BDI ≥ 20) | 10 (6%) | 9 (11%) | 9 (8%) | 0.52 |
| Anti-depressant medication use | 9 (6%) | 11 (13%) | 6 (5%) | 0.07 |
| Marijuana use | 11 (7%) | 6 (7%) | 8 (7%) | 0.99 |
| Alcohol use | 0.23 | |||
| Never drank alcohol | 83 (53%) | 42 (49%) | 71 (63%) | |
| Alcohol use <1/mo | 50 (32%) | 27 (32%) | 30 (27%) | |
| Alcohol use >1/mo | 25 (16%) | 16 (19%) | 11 (10%) | |
| Reported active smoking | 12 (8%) | 8 (9%) | 12 (11%) | 0.67 |
| Maternal serum cotinine >3 ng/ml | 15 (9%) | 10 (12%) | 16 (14%) | 0.48 |
| Maternal max serum cotinine (ng/ml) | 0.082 [0.0004, 14] | 0.097 [0.0006, 16] | 0.130 [0.0006, 29] | 0.33b |
| Maternal max lead (μg/dL) | 0.81 [0.35, 1.84] | 0.84 [0.37, 1.92] | 0.84 [0.35, 1.99] | 0.79 |
| Infant characteristics | ||||
| Male | 73 (46%) | 38 (45%) | 55 (49%) | 0.81 |
| Birthweight (g) | 3386 ± 561 | 3454 ± 750 | 3343 ± 563 | 0.45 |
| Gestational age (weeks) | 39.1 ± 1.6 | 38.9 ± 2.0 | 39.1 ± 1.6 | 0.77 |
| Gestational age < 37 weeks | 12 (8%) | 9 (11%) | 10 (9%) | 0.73 |
| Gestational age at exam (weeks) | 43.9 ± 1.8 | 43.8 ± 2.3 | 44.1 ± 2.0 | 0.58 |
| Birth order | 0.59 | |||
| First child | 64 (41%) | 42 (49%) | 49 (44%) | |
| Second child | 57 (36%) | 22 (26%) | 36 (32%) | |
| > Second child | 37 (23%) | 21 (25%) | 27 (24%) | |
| Breastfed (yes) | 132 (84%) | 69 (81%) | 90 (80%) | 0.78 |
| NICU stay (yes) | 6 (4%) | 5 (6%) | 6 (5%) | 0.73 |
| Length of NICU stay (days) | 12 ± 9.2 | 11 ± 11.2 | 5 ± 4.8 | 0.34 |
| Labor and Delivery | ||||
| Cesarean | 49 (31%) | 26 (31%) | 29 (26%) | 0.63 |
| Labor > 10 hours | 43 (34%) | 20 (32%) | 28 (30%) | 0.84 |
| Anesthesia (none) | 17 (11%) | 10 (12%) | 12 (11%) | 0.96 |
Difference in profile p-values from chi-square test for binary outcomes and from ANOVA for continuous outcomes.
P-value from Kruskal-Wallis test.
Denominators may vary due to missing data.
Data expressed as mean ± standard deviation, median (25th, 75th percentile), geometric mean [95% confidence interval] or n (%).
Table 4.
Neurobehavioral outcomes by profile
| Variable | Social/Easy Going (n=158) Mean ± SE |
Hypotonic (n=85) Mean ± SE |
High Arousal/Difficult (n=112) Mean ± SE |
P-value |
|---|---|---|---|---|
| Bayley | n=138 | n=77 | n=100 | |
| PDI | 95.4 ± 1.4A | 91.7 ± 1.7B | 97.3 ± 1.6A | 0.02 |
| MDI | 94.2 ± 1.1 | 92.6 ± 1.3 | 95.2 ± 1.3 | 0.23 |
| BASC2 | n=129 | n=63 | n=89 | |
| Externalizing | 53.2 ± 1.0 A | 50.7 ± 1.0 B | 52.1 ± 1.1 A B | 0.02 |
| Internalizing | 50.2 ± 1.1 | 49.6 ± 1.2 | 51.0 ± 1.2 | 0.56 |
| Behavior Symptoms | 53.8 ± 1.0 | 52.7 ± 1.0 | 53.5 ± 1.1 | 0.25 |
| Adaptive Skills | 46.4 ± 0.9 | 44.8 ± 1.0 | 47.5 ± 1.0 | 0.08 |
Means with different superscripted letters are statistically different at p< 0.05.
Covariates in all models are sex, race, age at exam, maternal age, maternal depression, maternal education, maternal serum cotinine (prenatal), and parity.
PDI = Psychomotor Development Index
MDI = Mental Development Index
Application of the NNNS Profile Algorithm
The algorithm to determine profile membership into one of the three profiles presented in Appendix 1 was applied to the 333 subjects with complete NNNS responses for all 12 items. Five percent (n=18) of the subjects were assigned a different profile membership from the model, and all of these discrepancies occurred between the social/easy going and the difficult/high arousal profiles with 83% occurring in the social/easy going profile. This is not surprising since all infants with hypotonicity are assigned to the hypotonic profile. Given a completed NNNS assessment, the algorithm can be used to assign profile membership. For example, a subject with five week NNNS exam scores of 6.86 for attention, 0.13 for handling, 6.23 for self-regulation, 3.71 for arousal, 1 for excitability, 3 for lethargy, 0 for hypertonicity, 0 for hypotonicity, 3 for nonoptimal reflexes, 0 for asymmetric reflexes, 5.17 for quality of movement, and 0.12 for stress abstinence would be assigned to the social/easy going profile. This algorithm should only be used for those infants who are considered at low-risk for neurobehavioral deficit, as the LPA results are not necessarily generalizable to different populations, such as preterm infants. The computer program for determining profile membership, using the R programming language, is available upon request.
Discussion
In this relatively healthy sample of infants, latent profile analysis of the 5 week NNNS examination identified three discrete profiles. Theses profiles defined 44% as social/easy going, 24% as hypotonic, and 32% as high arousal/difficult. In a previously published study by Liu et al. which included 47% cocaine-exposed infants, five NNNS profile patterns are described with 22% of that study sample designated to the best performance profile and 6% in the worst performance profile.2 In the Liu study, the NNNS profiles were predictive of medical and behavioral problems through 4.5 years of age. They found that the worst performers were more likely to be exposed in utero to cocaine, opiates, tobacco and marijuana, were more likely to be preterm and have low birthweight, abnormal cranial ultrasound readings at one month, chronic neurologic abnormalities, brain-related illness, or diagnosis of cerebral palsy by age three, when compared with all other infants not classified in the worst performance profile. They also found that the worst performers were more likely to have low Bayley MDI scores at one and two years of age, and more externalizing, internalizing and total problems at age three as measured by the Child Behavior Checklist. In the current study, with relatively few poor neurobehavioral event outcomes by age three, we were able to see some signs of less optimal outcomes in one profile compared to the other two. We showed an association with less optimal neurobehavioral outcome as defined by PDI for infants that were defined by the hypotonic profile compared to the social/easy going and high arousal/difficult infants. Having less than normal tone or muscle tension at five weeks may predict less optimal psychomotor development later in life.
A limitation of this study is that neurobehavioral outcomes were only available through three years of age and it may be more important to evaluate the predictive ability of the NNNS profiles on later life outcomes. In addition, our sample of 355 newborns was comprised of primarily normal, healthy infants, with very low rates of neurobehavioral compromise. Mothers’ report of drug use during pregnancy was not confirmed through maternal urine or infant meconium testing. However, the nature of the demographic characteristics of the sample and goals of the larger longitudinal parent study lessen the likelihood of falsified reporting.
Future Directions
To advance this area, a pooling of samples to create a new standardization sample including healthy, drug exposed, and a variety of other at-risk infants is recommended with reanalysis using the LPA approach to provide a master standardization sample. This approach would then allow other studies to map their newborns along NNNS profiles created based on a more varied sample of infants and eliminate the need to conduct LPA with each new dataset.
In conclusion, the NNNS is a highly sensitive neurobehavioral assessment tool suitable for both clinical and research purposes. The latent profile analysis approach to NNNS examination data is successful in defining distinct groups among cocaine exposed and nonexposed infants. It is a useful supplemental method for interpreting the complex scoring mechanism of the NNNS. Additional research with a larger number of infants encompassing varying degrees of risk will provide further evidence of the predictive ability of the NNNS stratified using the latent profile analysis technique.
Acknowledgments
This work was supported by the Flight Attendant Medical Research Institute (062620_CIA), the National Institute of Environmental Health Sciences (R01 ES015517-01A1), and the Environmental Protection Agency (P01 ES11261).
References
- 1.Lester BM, Tronick EZ. The Neonatal Intensive Care Unit Network Neurobehavioral Scale procedures. Pediatrics. 2004;113:641–667. [PubMed] [Google Scholar]
- 2.Liu J, Bann C, Lester B, Tronick E, Das A, Lagasse L, et al. Neonatal neurobehavior predicts medical and behavioral outcome. Pediatrics. 2010;125:e90–98. doi: 10.1542/peds.2009-0204. [DOI] [PMC free article] [PubMed] [Google Scholar]
- 3.Napiorkowski B, Lester BM, Freier MC, Brunner S, Dietz L, Nadra A, et al. Effects of in utero substance exposure on infant neurobehavior. Pediatrics. 1996;98:71–5. [PubMed] [Google Scholar]
- 4.Lester BM, Tronick EZ, LaGasse L, Seifer R, Bauer CR, Shankaran S, et al. The maternal lifestyle study: Effects of substance exposure during pregnancy on neurodevelopmental outcome in 1-month-old infants. Pediatrics. 2002;110:1182–92. doi: 10.1542/peds.110.6.1182. [DOI] [PubMed] [Google Scholar]
- 5.Paz MS, Smith LM, LaGasse LL, Derauf C, Grant P, Shah R, et al. Maternal depression and neurobehavior in newborns prenatally exposed to methamphetamine. Neurotoxicology and Teratology. 2009;31:177–182. doi: 10.1016/j.ntt.2008.11.004. [DOI] [PMC free article] [PubMed] [Google Scholar]
- 6.Smith LM, Lagasse LL, Derauf C, Grant P, Shah R, Arria A, et al. Prenatal methamphetamine use and neonatal neurobehavioral outcome. Neurotoxicology and Teratology. 2008;30:20–28. doi: 10.1016/j.ntt.2007.09.005. [DOI] [PMC free article] [PubMed] [Google Scholar]
- 7.Yolton K, Khoury J, Xu Y, Succop P, Lanphear B, et al. Low-level prenatal exposure to nicotine and infant neurobehavior. Neurotoxicology and Teratology. 2009;31:356–63. doi: 10.1016/j.ntt.2009.07.004. [DOI] [PMC free article] [PubMed] [Google Scholar]
- 8.Law KL, Stroud LR, LaGasse LL, Niaura R, Liu J, Lester BM. Smoking during pregnancy and newborn neurobehavior. Pediatrics. 2003;111:1318–23. doi: 10.1542/peds.111.6.1318. [DOI] [PubMed] [Google Scholar]
- 9.Stroud LR, Paster RL, Papandonatos GD, Niaura R, Salisbury AL, Battle C, et al. Maternal smoking during pregnancy and newborn neurobehavior: effects at 10 to 27 days. Journal of Pediatrics. 2009;154:10–16. doi: 10.1016/j.jpeds.2008.07.048. [DOI] [PMC free article] [PubMed] [Google Scholar]
- 10.Jones HE, O’Grady KE, Johnson RE, Velez M, Jansson LM. Infant neurobehavior following prenatal exposure to methadone or buprenorphine: results from the neonatal intensive care unit network neurobehavioral scale. Substance Use and Misuse. 2010;45:2244–57. doi: 10.3109/10826084.2010.484474. [DOI] [PubMed] [Google Scholar]
- 11.Salisbury AL, Lester BM, Seifer R, Lagasse L, Bauer CR, Shankaran S, et al. Prenatal cocaine use and maternal depression: effects on infant neurobehavior. Neurotoxicology and Teratology. 2007;29:331–340. doi: 10.1016/j.ntt.2006.12.001. [DOI] [PMC free article] [PubMed] [Google Scholar]
- 12.Brown NC, Doyle LW, Bear MJ, Inder TE. Alterations in neurobehavior at term reflect differing perinatal exposures in very preterm infants. Pediatrics. 2006;118:2461–2471. doi: 10.1542/peds.2006-0880. [DOI] [PubMed] [Google Scholar]
- 13.deMorales Barros MC, Guinsburg R, Mitsuhiro SS, Chalem E, Laranjeira RR. Neurobehavior of full-term small for gestational age newborn infants of adolescent mothers. Jornal de Pediatria. 2008;84:217–23. doi: 10.2223/JPED.1796. [DOI] [PubMed] [Google Scholar]
- 14.Coyle MG, Ferguson A, Lagasse L, Liu J, Lester B. Neurobehavioral effects of treatment for opiate withdrawal. Archives of Disease in Childhood. Fetal and Neonatal Edition. 2005;90:F73–4. doi: 10.1136/adc.2003.046276. [DOI] [PMC free article] [PubMed] [Google Scholar]
- 15.Geraghty SR, Khoury JC, Morrow AL, Lanphear BP. Reporting individual test results of environmental chemicals in breastmilk: potential for premature weaning. Breastfeeding Medicine. 2008;3:207–213. doi: 10.1089/bfm.2008.0120. [DOI] [PMC free article] [PubMed] [Google Scholar]
- 16.Phelan KJ, Khoury J, Xu Y, Lanphear B. Validation of a HOME Injury Survey. Injury Prevention. 2009;15:300–6. doi: 10.1136/ip.2008.020958. [DOI] [PMC free article] [PubMed] [Google Scholar]
- 17.Bayley N. Bayley Scales of Infant Development. 2. San Antonio, CA: Psychological Corporation; 1993. [Google Scholar]
- 18.Reynolds CR, Kamphaus RW. Behavior Assessment System for Children. 2. Circle Pines, MN: Pearson Assessment; 2004. [Google Scholar]
- 19.Muthen L, Muthen B. Mplus Users’ Guide. 3. Los Angeles, CA: Muthen & Muthen; 1998-2008. [Google Scholar]
- 20.Lo Y, Mendell N, Rubin D. Testing the number of components in a normal mixture. Biometrika. 2001;88:767–78. [Google Scholar]
- 21.Benowitz N, Bernert J, Caraballo R, Holiday D, Wang J. Optimal serum cotinine levels for distinguishing cigarette smokers and nonsmokers within different racial/ethnic groups in the Unites States between 1999 and 2004. American Journal of Epidemiology. 2009;169:236–248. doi: 10.1093/aje/kwn301. [DOI] [PubMed] [Google Scholar]
- 22.Genz A. Numerical computation of multivariate normal probabilities. Journal of Computational and Graphical Statistics. 1992;1:141–150. [Google Scholar]