Abstract
Shiverer is an important model of central nervous system dysmyelination characterized by a deletion in the gene encoding myelin basic protein with relevance to human dysmyelinating and demyelinating diseases. Perfusion fixed brains from shiverer mutant (C3Fe.SWV Mbpshi/Mbpshi n = 6) and background control (C3HeB.FeJ, n = 6) mice were compared using contrast enhanced volumetric diffusion tensor magnetic resonance microscopy with a nominal isotropic spatial resolution of 80 µm. Images were accurately coregistered using nonlinear warping allowing voxel-wise statistical parametric mapping of tensor invariant differences between control and shiverer groups. Highly significant differences in the tensor trace and both the axial and radial diffusivity were observed within the major white matter tracts and in the thalamus, midbrain, brainstem and cerebellar white matter, consistent with a high density of myelinated axons within these regions. The fractional anisotropy was found to be much less sensitive than the trace and eigenvalues to dysmyelination and associated microanatomic changes.
Keywords: Dysmyelination, Shiverer mutant, Magnetic resonance microscopy, Diffusion tensor imaging
Introduction
Shiverer is a mouse mutation characterized by an almost complete absence of compact myelin in the central nervous system (CNS). The mutation produces a shivering phenotype in affected mice (Biddle et al., 1973; Bird et al., 1978; Dupouey et al., 1979; Privat et al., 1979) and a shivering gait develops within a few weeks from birth with a reduced life span of between 50 and 100 days. In contrast, the peripheral nervous system appears normal. Myelin basic protein (MBP) is absent in the CNS due to a deletion of the major part of the MBP gene (Roach et al., 1985; Readhead et al., 1987; Kimura et al., 1989). Shiverer has relevance to both dysmyelinating and demyelinating disease in humans since it decouples dysmyelination from inflammatory processes seen in multiple sclerosis and experimental allergic encephalomyelitis (Ahrens et al., 1998).
The apparent diffusion coefficient (ADC) of water as measured by MRI is likely a mixture of an extracellular hindered component and a restricted intracellular component (Assaf et al., 2004). The diffusion tensor is a popular model of the anisotropy of the ADC observed by MRI in biological tissues (Basser and Pierpaoli, 1998; Basser et al., 1994). The eigenvalues of the tensor, λi, can be interpreted as the apparent diffusivity in the axial (λ1) and radial (λ2 and λ3) directions of a fiber tract. The trace of the tensor, Tr(D), equal to the sum of the eigenvalues, is a convenient representation of the orientation-independent mean diffusivity. Diffusion anisotropy is typically represented by an anisotropy index, such as the fractional anisotropy (FA), derived from the eigenvalues (Skare et al., 2000). We refer the reader to literature reviews of DTI for a more complete picture of the model (Le Bihan et al., 2001; Basser and Jones, 2002).
Early work by Beaulieu and Allen demonstrated the relative lack of influence of myelin on diffusion anisotropy in myelinated and unmyelinated garfish nerves (Beaulieu and Allen, 1994; Beaulieu et al., 1998). DTI studies of mouse and human white matter development confirm that myelination is not a prerequisite for diffusion anisotropy in white matter, but may still influence the magnitude of tensor indices (Mori et al., 2001; Neil et al., 2002; Zhang et al., 2003). Diffusion tensor microscopy of fixed spinal cords has shown significant increases in both axial and radial diffusivity in myelin-deficient rats (Gulani et al., 2001). However, increased radial diffusivity without significantly increased axial diffusivity has also been observed using in vivo DTI of shiverer mouse white matter tracts (Song et al., 2002).
In this study, we demonstrate how high-resolution MR diffusion tensor microscopy of fixed brains reveals a much broader range of detectable dysmyelination effects in the shiverer CNS than might be predicted from study of the major white matter tracts alone. Acquisition of high-resolution volumetric DTI data allows coregistration and statistical comparison of group diffusion measurements on a voxel-by-voxel-basis. This approach eliminates prior assumptions regarding regions of significant change, resulting in an unbiased picture of dysmyelination and its effect on water diffusion within CNS tissue.
Experimental methods
Animal protocol
The brains of congenic male homozygous shiverer mutants (C3Fe.SWV Mbpshi/Mbpshi, Jackson Laboratories, mean age at fixation = 6.0 ± 0.2 weeks, n = 6) and control males with the same background as the shiverers (C3HeB/FeJ, Jackson Laboratories, mean age at fixation = 6.9 ± 0.2 weeks, n = 6) were studied using diffusion tensor imaging. Mice were anesthetized deeply using 2.5% Avertin (0.017 ml/g body weight). The mouse was then fixed by transcardiac perfusion using 30 ml of room temperature heparinized phosphate buffered saline followed by 30 ml of room temperature 4% paraformaldehyde (PFA). All experiments were performed in accordance with protocols approved by the Institutional Animal Care and Use Committee of the California Institute of Technology.
After death, the head was removed and rocked in 4% PFA overnight at 4°C. The skin, lower jaw, ears and cartilaginous nose tip were removed and the head rocked in 50 ml 0.01% sodium azide in PBS for 7.0 ± 0.1 days (mean ± SD) at 4°C. The head was then transferred to a 5 mM solution of gadoteridol (Prohance®, Bracco Diagnostics Inc., Princeton NJ) and 0.01% sodium azide in PBS and rocked for 13.5 ± 1.9 days at 4°C prior to MR imaging. Equilibration of the fixed brain in 5 mM gadoteridol solution significantly reduces the T1 of the sample and therefore reduces the total imaging time for a given resolution and target signal-to-noise ratio. All brains were equilibrated at room temperature for 8.5 ± 3.0 h immediately prior to imaging at 20°C. In four control and four shiverer brains, DTI acquisitions were repeated to address B1 homogeneity concerns and the second data set used in the results analysis. The additional time spent by these brains in 5 mM gadoteridol is included in the quoted time intervals above. The repeated brains also spent an additional 6.8 ± 0.1 h equilibrating to room temperature prior to imaging.
Magnetic resonance imaging
All images were acquired using a vertical bore 11.7 T Bruker Avance DRX500 system (Bruker Biospin, Germany) equipped with a Micro2.5 imaging gradient set capable of a peak gradient strength of 1 T/m and a maximum slew rate of 12.5 kT/m/s. The intact head was secured in a Teflon® holder and submerged in a perfluoropolyether (Fomblin®, Solvay Solexis, Inc., Thorofare, NJ) within a 20 ml vial and imaged using a 35 mm birdcage transmit/receive volume resonator. All samples were equilibrated at room temperature prior to imaging (see above). The ambient bore temperature was maintained at 20°C by thermostatically controlled airflow. Optimized second order shimming was achieved across the whole sample using the Bruker implementation of Fastmap (Gruetter, 1993).
Diffusion-weighted images were acquired using a conventional pulsed-gradient spin echo (PGSE) sequence (TR/TE = 150 ms/11.6 ms, 256 × 150 × 130 matrix, 19.2 mm × 15 mm × 12 mm FOV, 80 µm isotropic voxel size, 1 average, δ = 3 ms, Δ = 5 ms, Gd = 750 mT/m, nominal b-factor = 1450 s/mm2). An optimized six point icosahedral encoding scheme (Hasan et al., 2001) was used for diffusion-weighted acquisitions with a single unweighted reference image for a total imaging time of 6 h.
Intersubject variation in the degree of enhancement by gadoteridol is a potential source of bias for between-group comparisons of the diffusion tensor. FA in particular is biased by SNR (Anderson, 2001), which would correlate with such enhancement variations. Consequently, the variation in contrast agent enhancement was assessed by T1 and T2 relaxometry for all brains using saturation recovery spin echo imaging (TR/TE = 75,113,169, 253, 380, 570, 854, 1281 ms/6 ms, 6 slices) and multiple spin echo imaging (TR/TE = 800 ms/7 ms, 16 equal-spaced echoes, 6 slices). T1 and T2 maps were calculated by voxel-wise non-linear least-squares fitting of the contrast equations including a constant offset. Mean T1 and T2 values were calculated for an elliptical ROI covering the whole cerebrum in one slice at the approximate level of the orbits using ImageJ (Abramoff et al., 2004).
Two wild-type and two shiverer brains were subsequently embedded in paraffin, sectioned (7 µm coronal sections every 196 µm) and Weil stained for myelin (NeuroScience Associates, Knoxville TN). Accurate coregistration of the histological sections to the corresponding MR microscopy data was not performed. Where histology is compared to MRI, the registration is approximate.
Image processing
Image processing was performed using a combination of freely distributed and in-house software implemented in Matlab (The Mathworks Inc., Natick MA). Reconstruction of the diffusion-weighted images included spatial radial Gaussian filtering (radial SD = 0.25 voxel) to smooth the coregistration cost-function and improve the SNR of all subsequent calculations. The six diffusion-weighted images were averaged to generate a high SNR isotropic diffusion-weighted image which could be used for both brain segmentation and image coregistration.
The brain was segmented from surrounding tissue as follows: the isotropic diffusion-weighted image (iDWI) for a given brain was converted to a binary mask using Otsu’s algorithm which minimizes the intraclass variance between the masked and unmasked voxels (Otsu, 1979). Internal holes in the mask were filled based on their connectivity to the edge of the image. The resulting mask finally underwent successive 2D morphological opening in the XY and XZ planes to remove bridges and isolated islands. This brain mask was then used to constrain both the DTI calculation volume and the coregistration cost-function calculation.
Signal-to-noise ratio (SNR) estimates were made for all unweighted and diffusion-weighted images using the median signal within the brain mask. The noise standard deviation was estimated using Donoho’s method from the median signal within an 8 × 8 × 8 kernel containing only air divided by 0.6745 (Donoho and Johnstone, 1994). This method provides a robust estimate of the noise standard deviation, assuming zero mean, Gaussian white noise. SNR for the white matter was also calculated for all brain regions with FA >0.5.
The apparent diffusion tensor was calculated conventionally by inversion of the encoding b-matrix, Small shifts and rotations of the diffusion-weighted images were observed and ascribed to residual eddy currents from the high-amplitude diffusion encoding pulses persisting through the echo acquisition. Diffusion-weighted images were consequently registered to the diffusion unweighted image using a rigid-body transform under the assumption that the original diffusion encoding directions were exact and that the unweighted image best represents the true orientation of the mouse brain relative to the imaging gradient axes. The b-matrix for each diffusion encoding was determined by numerical simulation of the pulse sequence k-space trajectory in order to account for gradient cross-terms (Mattiello et al., 1997). Eigenvalues, eigenvectors, tensor trace and fractional anisotropy were calculated conventionally using built-in and custom Matlab functions.
Coregistration of the DTI data from the control and shiverer groups was performed using an implementation of Roger Woods’ AIR 5 package (Woods et al., 1998a,b) interfaced to Matlab. For each group, the iDWI data for one mouse were chosen as a reference and manually rotated to align the anatomic and imaging axes. All DTI data were then coregistered to the reference (intragroup registration) and resampled using an affine transform to seed optimization of a fifth-order polynomial warp transform. A scaled-least squares cost-function was calculated only for the sub-volumes defined by the brain mask described above yielding an optimized coregistration for the brain, but not the surrounding tissue. A 3D Gaussian spatial filter (FWHM = 80 µm) was used during coregistration only to condition the cost-function and was not applied during resampling. All DTI data were then resampled using the intragroup transforms and a mean iDWI calculated for both genotypes. An optimized polynomial warp was then calculated to map the mean shiverer iDWI to the mean control iDWI. Finally, all shiverer DTI data were resampled using the intergroup transform. The resulting images allow voxel based statistical parametric maps to be calculated representing the significance of differences between the rotational invariants (Tr(D), FA and λi) of the diffusion tensor.
Volumetric maps of the unpaired t statistic for the mean difference between the wild-type and shiverer images were calculated for the eigenvalues, λi, the trace, Tr(D), and fractional anisotropy (FA) of the tensor. The signed t statistic images were thresholded at |t| > 2.23 (P < 0.05, n = 10, two-tailed), colorized and overlaid on boundary images derived from the iDWI data using 3D Canny edge detection.
Anatomic regions and sterotactic coordinates where reported were identified with reference to the Paxinos C57BL/6J atlas (Paxinos and Franklin, 2001).
Results and discussion
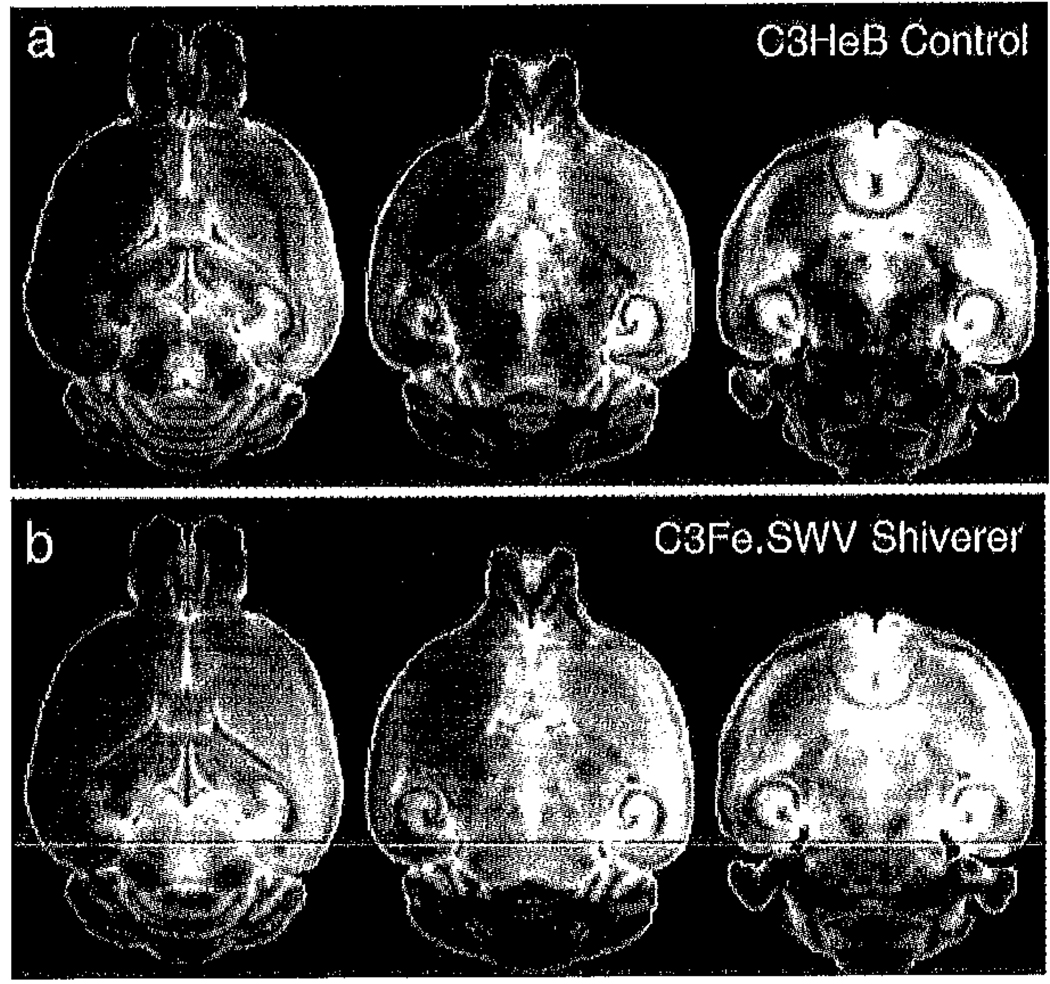
Diffusion-weighted images demonstrated consistently high signal-to-noise ratios and low artifact levels resulting from equilibration in contrast agent and simple spin echo data acquisition, respectively (Fig. 1). The median diffusion-weighted white matter SNR was found to be 28 in controls and 34 in shiverers. For comparison, the median white matter SNR without diffusion weighting was 34 in controls and 40 in shiverers. Analysis of the voxel-wise differences in the coregistered tensor invariant images between shiverer and control brains reveals several significant patterns.
Fig. 1.
Comparison of selected axial slices from (a) mean iDWI images of the C3HeB.FeJ control (n = 6) and (b) C3Fe.SWV Mbpshi/Mbpshi shiverer (n = 6) mouse brains. The principle white matter tracts and most regions of the midbrain and brain stem appear hyper-intense in the shiverer mouse when compared to the control. Although this image contrast is heavily diffusion-weighted (b = 1450 s/mm2) it is also moderately T2-weighted (TE = 11.6 ms) with myelin density accounting for the majority of white matter contrast differences between control and mutant.
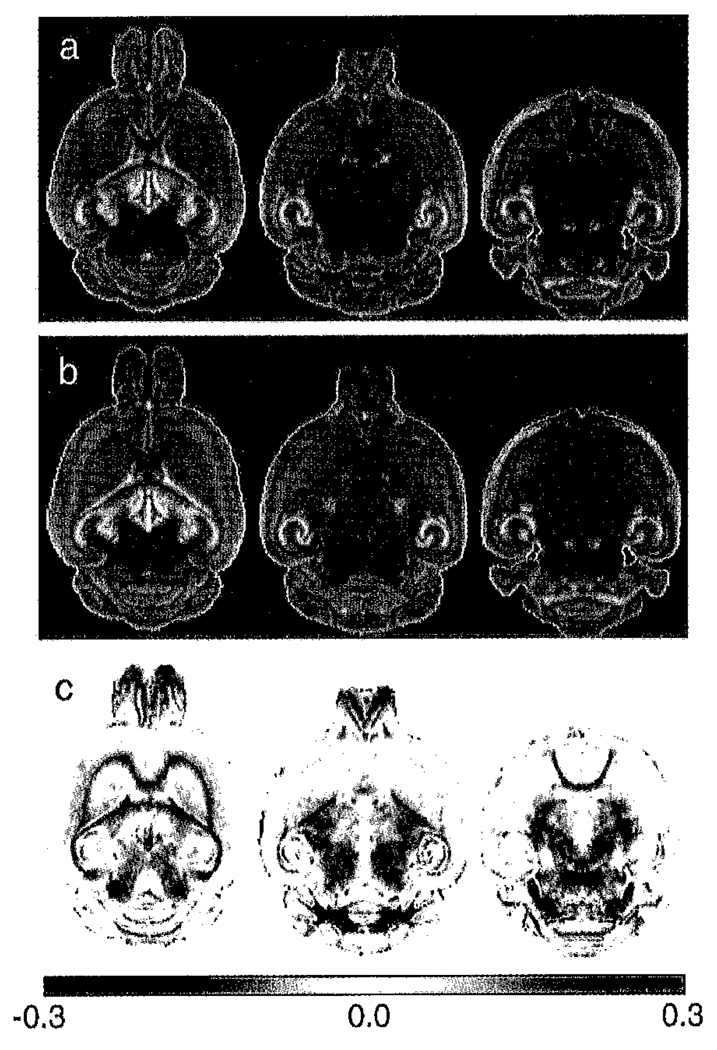
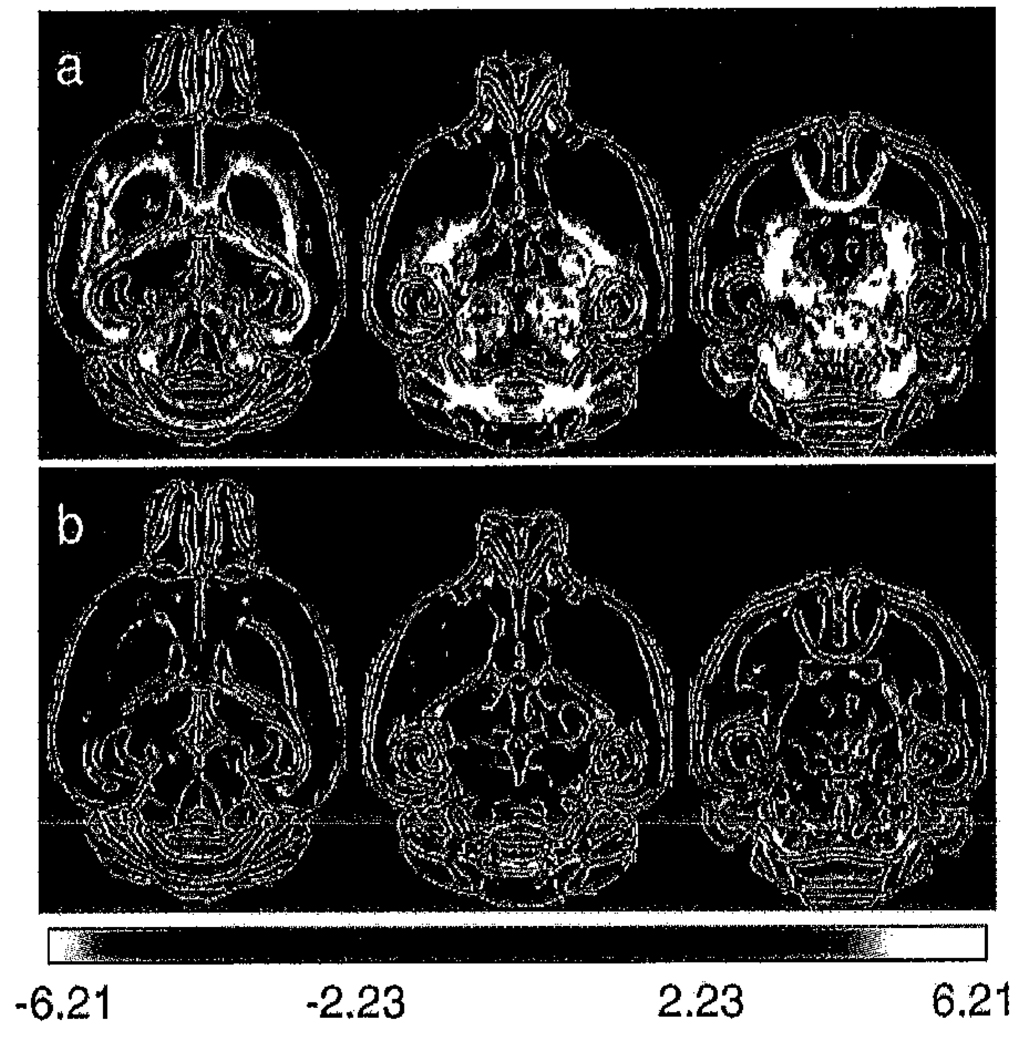
The diffusion tensor trace, Tr(D), is higher (Fig. 2) in all regions where we would expect to find compact myelination, including the major white matter tracts, cerebellar white matter, thalamus, midbrain and brain stem. These differences are for the most part statistically significant (Fig. 3a) in these regions. The exception to this is lower Tr(D) in shiverer in the external plexiform and glomerular layers of the olfactory bulb.
Fig. 2.
Comparison of the diffusion tensor trace (Tr(D)) between (a) mean control and (b) mean shiverer brains. The (shiverer-control) difference images (c) confirm that Tr(D) is higher in shiverer than in the control in both white matter tracts and much of the midbrain and brain stem. In contrast, regions of the olfactory bulb have a lower diffusion trace in the shiverer than the control. The difference colorscale has units of µm2/ms.
Fig. 3.
Maps of the Student’s t statistic for the (shiverer-control) difference in (a) Tr(D) and (b) FA of the apparent diffusion tensor shown in Figs. 2 and 6. The t statistic is shown overlaid on the edge-detected mean iDWI for the control group. The colorscale is red–yellow for positive differences and blue–white for negative differences and has been constrained to the range 2.23 < |t| < 6.21 (0.05 > P > 0.0005, two-tailed). Many white matter tracts, including but not limited to the external and internal capsule, fomix, anterior commisure and optic tract demonstrate significant increases in Tr(D) in the shiverer brain. The plexiform and glomerular layers of the olfactory bulb in shiverer appear to have a significantly decreased Tr(D). The low sensitive of FA to dysmyelination effects is confirmed in the t statistic map. Widespread significant FA differences are not observed in the thalamus, midbrain and brainstem.
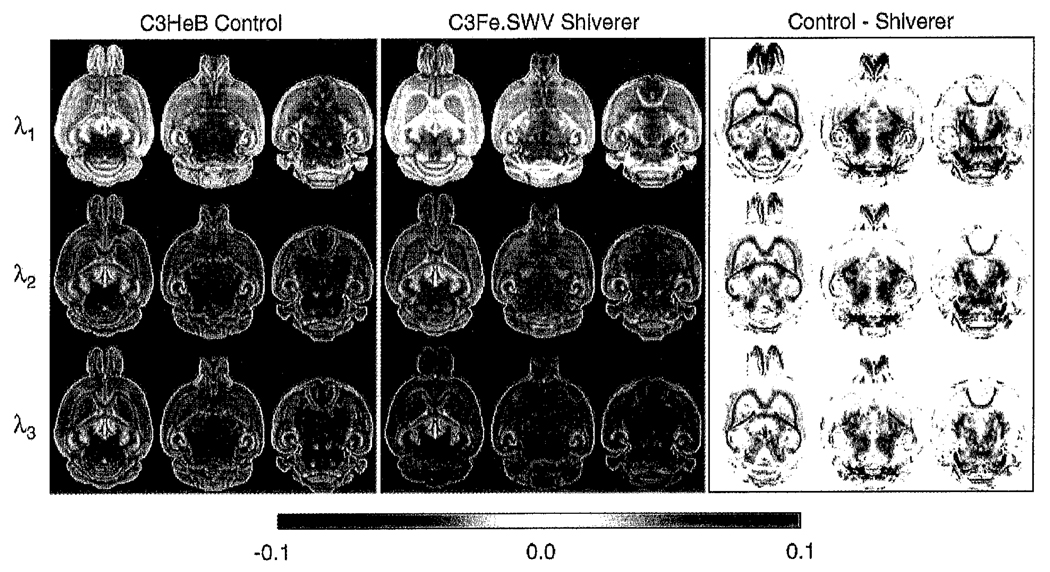
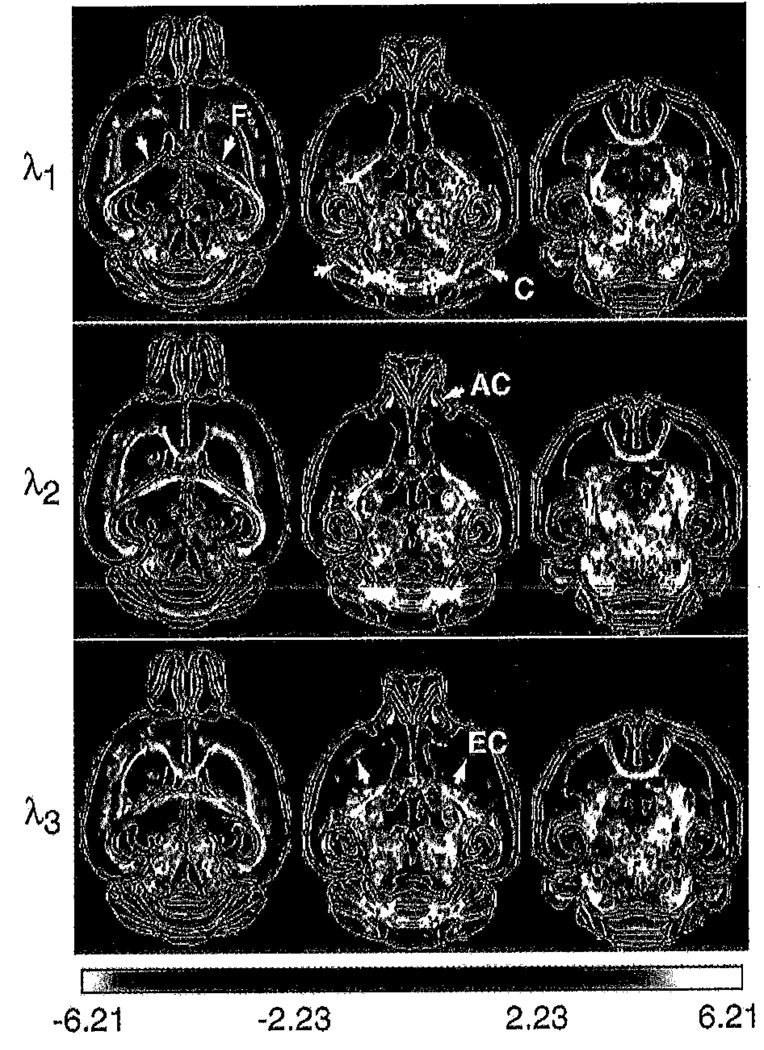
Differences in the individual eigenvalues follow a very similar pattern to that observed in Tr(D) (Fig. 4). The statistical parametric maps for each of the eigenvalues are generally very similar to each other (Fig. 5). Differences in λ1 are slightly less significant than in λ2 and λ3 in certain white matter tracts, such as the anterior commisure, external capsule, ventral hippocampal commisure and hippocampal fibria. Conversely, regions such as the lateral cerebellar white matter demonstrate more significant differences in λ1 than in λ2 and λ3. As for Tr(D), λ1 and λ2 are significantly lower in the external plexiform and glomerular layers of the olfactory bulb in shiverer.
Fig. 4.
Comparison of the individual eigenvalues (λi) between mean control and mean shiverer brains demonstrating similar patterns of increased diffusivity in the shiverer white matter, thalamus, midbrain and brain stem. The magnitude of the differences decreases with eigenvalues number. As for Tr(D), regions of the olfactory bulb show reduced diffusivity in shiverer. The difference colorscale has units of µm2/ms.
Fig. 5.
Maps of the Student’s t statistic for the (shiverer-control) difference in the tensor eigenvalues shown in Fig. 4. Some white matter tracts such as the anterior part of the anterior commisure (AC, arrowed), external capsule (EC, arrowed) and hippocampal fimbria (F, arrowed) show less significant differences in λ1 than in λ2 and λ3. The lateral cerebellar white matter (C, arrowed), in contrast, shows more significant increases in λ1 than in λ2 and λ3.
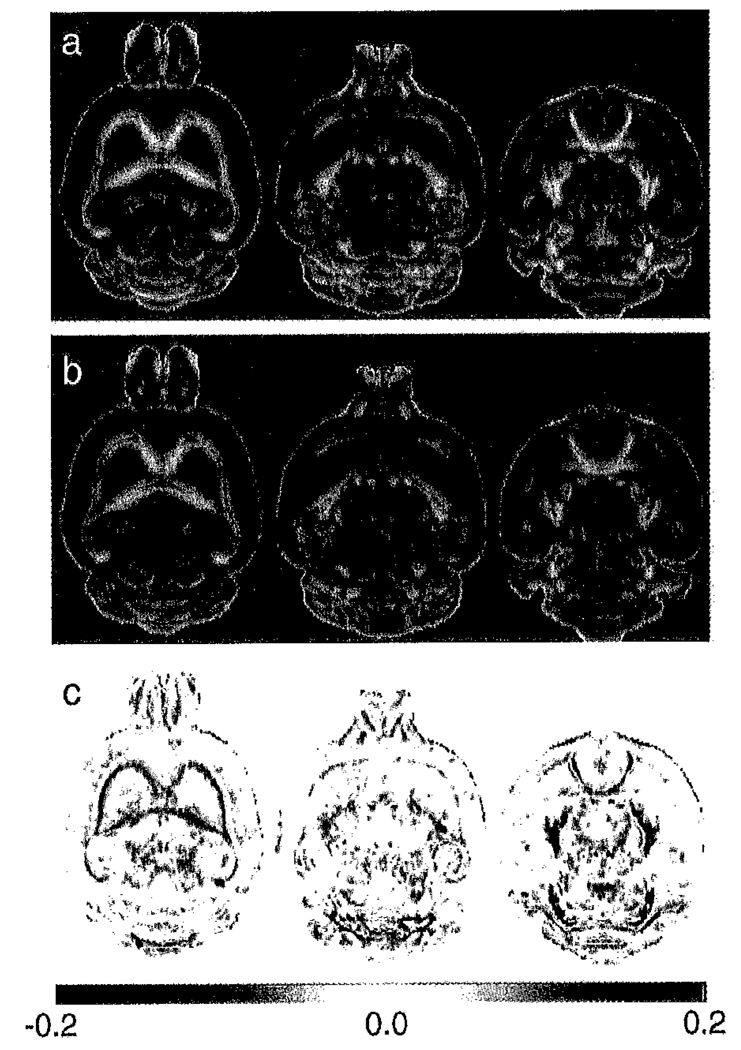
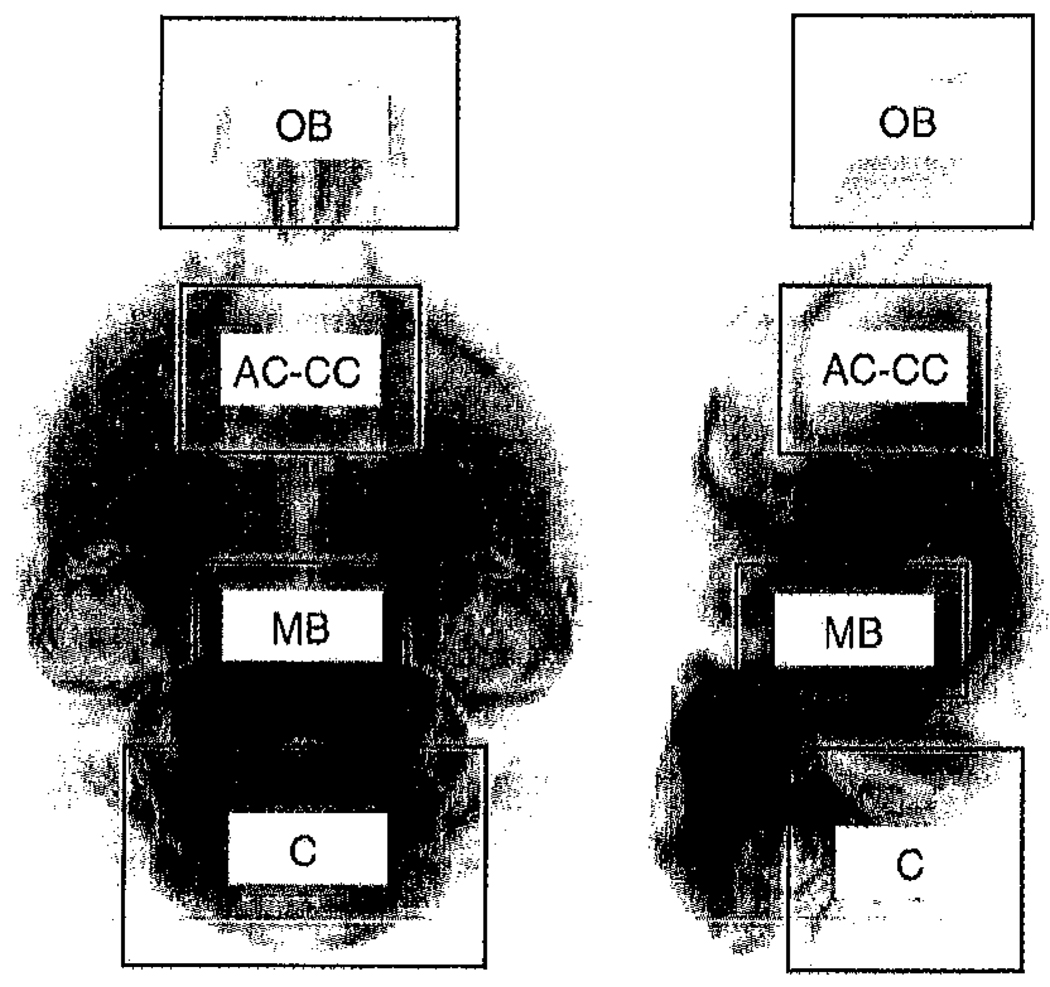
The fractional anisotropy is generally higher in myelinated regions for controls than in equivalent regions in shiverer (Fig. 6). However, the differences are less widespread and less significant (Fig. 3b) than those observed for Tr(D) and the eigenvalues. This finding is consistent with previous observations with DTI, both in vivo (Song et al., 2002) and in fixed tissue (Gulani et al., 2001). The mean and standard deviation of Tr(D), FA and eigenvalues were calculated across all voxels demonstrating a significant difference between shiverer and control (Table 1) within four ROIs enclosing the olfactory bulb (OB), anterior commisure and anterior corpus callosum (AC-CC), midbrain and cerebellum (Fig. 7). The ROI titles are for illustrative purposes and are not strict descriptions of the ROI contents. The midbrain ROI for example also contains parts of the thalamus and hypothalamus. All regions show increases of between 16% and 27% in Tr(D) and eigenvalues with the exception of the olfactory bulb which shows decreases of between 15% and 16%. The fractional diffusivity changes increase slightly with eigenvalues number. FA is reduced by between 11% and 19% in shiverer in all regions, but a significant difference is detected in fewer voxels than for the diffusivity indices.
Fig. 6.
Comparison of the tensor fractional anisotropy (FA) between (a) mean control and (b) mean shiverer brains. The (shiverer-control) difference images (c) show a reduction in FA in the external capsule, internal capsule, anterior commisure and cerebellar white matter. FA appears to be much less sensitive than Tr(D) to dysmyelination effects. The difference colorscale is dimensionless.
Table 1.
Mean tensor invariants calculated for those voxels showing significant differences at the 5% significance level within each of the four ROIs shown in Fig. 7
| Invariant | ROI | Control | Shiverer | Differencea | Relative difference (%)b | n |
|---|---|---|---|---|---|---|
| Tr(D) | Olfactory bulb | 0.91 ± 0.11 | 0.77 ± 0.12 | −0.14 | −15 | 9987 |
| AC-CC | 0.74 ± 0.12 | 0.87 ± 0.09 | 0.13 | 18 | 14,296 | |
| Midbrain | 0.66 ± 0.07 | 0.80 ± 0.08 | 0.14 | 22 | 30,887 | |
| Cerebellum | 0.79 ± 0.10 | 0.94 ± 0.10 | 0.15 | 19 | 26,038 | |
| FA | Olfactory bulb | 0.30 ± 0.08 | 0.25 ± 0.07 | −0.04 | −15 | 3632 |
| AC-CC | 0.32 ± 0.18 | 0.27 ± 0.15 | −0.05 | −16 | 5836 | |
| Midbrain | 0.28 ± 0.09 | 0.22 ± 0.07 | −0.05 | −19 | 11,192 | |
| Cerebellum | 0.37 ± 0.15 | 0.33 ± 0.09 | −0.04 | −11 | 15,852 | |
| λl | Olfactory bulb | 0.39 ± 0.05 | 0.33 ± 0.05 | −0.06 | −16 | 12,403 |
| AC-CC | 0.33 ± 0.03 | 0.39 ± 0.05 | 0.06 | 18 | 11,586 | |
| Midbrain | 0.27 ± 0.03 | 0.33 ± 0.04 | 0.06 | 20 | 28,082 | |
| Cerebellum | 0.37 ± 0.05 | 0.42 ± 0.06 | 0.06 | 16 | 26,444 | |
| λ2 | Olfactory bulb | 0.30 ± 0.04 | 0.25 ± 0.04 | −0.05 | −15 | 7825 |
| AC-CC | 0.22 ± 0.06 | 0.27 ± 0.05 | 0.05 | 20 | 11,788 | |
| Midbrain | 0.22 ± 0.03 | 0.27 ± 0.03 | 0.05 | 23 | 28,421 | |
| Cerebellum | 0.26 ± 0.05 | 0.31 ± 0.04 | 0.05 | 19 | 24,524 | |
| λ3 | Olfactory bulb | 0.23 ± 0.04 | 0.19 ± 0.04 | −0.04 | −16 | 5250 |
| AC-CC | 0.18 ± 0.05 | 0.22 ± 0.05 | 0.04 | 21 | 13,497 | |
| Midbrain | 0.17 ± 0.03 | 0.21 ± 0.03 | 0.04 | 27 | 30,260 | |
| Cerebellum | 0.17 ± 0.05 | 0.21 ± 0.04 | 0.04 | 25 | 22,868 |
Invariant values are quoted as mean ± SD.
Tr(D) and eigenvalues have units of µm2/ms.
Shiverer value —control value.
(Shiverer value —control value)/(control value) * 100%.
Fig. 7.
Regions of interest enclosing the olfactory bulb (OB), anterior-coramisure/corpus callosum (AC-CC), midbrain (MB) and cerebellum (C) used to calculate descriptive statistics over voxels showing significant differences between control and shiverer data. The underlying images are axial and sagittal projections of the mean control fractional anisotropy.
Accurate diffusion tensor measurements are heavily dependent on adequate SNR in the source data. The effect of noise on diffusion-weighted MRI has been explored theoretically using error propagation theory and Monte Carlo analyses (Basser and Pajevic, 2000; Skare et al., 2000; Anderson, 2001). If the observed differences in tensor invariants arose from the higher SNR in shiverer white matter due to an increase in T2, we would expect to see sorting bias effects on the eigenvalues, specifically an overestimate of λ1 and an underestimate of λ3. This was shown to lead to an overestimate of FA in anisotropic regions, but with the trace remaining unbiased (Anderson, 2001). FA was observed to be higher in control white matter than in shiverer white matter and may be partly due to decreased SNR. The increased diffusion trace observed in many dysmyelinated regions of the shiverer brain is an unbiased result and holds regardless of SNR differences.
Other sources of error and bias include variation in perfusion fixation, temperature variations during imaging and phenotypical variation related to genetic quality control in the mouse source (Jackson Labs refs). Mean ROI T1 values (control: 103.5 ± 19.1 ms, range 87 ms to 131 ms; shiverer: 91.4 ± 12.2 ms, range 78 ms to 106 ms) showed no significant difference between groups (P = 0.22, one-way ANOVA F test). Mean ROI T2 values (control: 21.3 ± 2.1 ms, range 19 ms to 24 ms; shiverer: 21.4 ± 1.3 ms, range 19 ms to 23 ms) were also not significantly different between groups (P = 0.90, one-way ANOVA F test). Both T1 and T2 were found to have significant negative correlations with total time spent by the fixed brain in 5 mM gadoteridol (T1 = (−7.23 t +195)ms, P = 0.00044; T2 = (−0.59 t +29)ms, P = 0.014). Shiverer and control DTI acquisitions were deliberately interleaved to reduce bias caused by these correlations, as reflected in the lack of significant differences between group relaxation times.
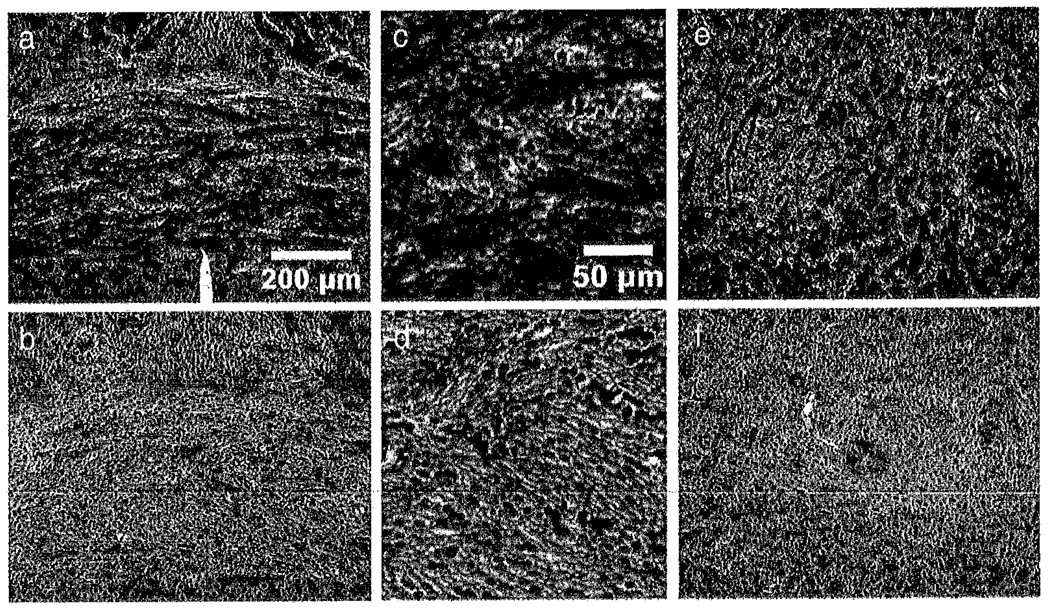
Weil myelin staining of the sections revealed the expected absence of compact myelin in the white matter tracts of the shiverer brains. Light microscopy of the anterior commisure and corpus callosum in the same section (Fig. 8) shows a gross absence of compact myelin. Also of note is the high density of nuclei in the shiverer white matter. Astrocytic responses to dysmyelination in shiverer have been observed previously (Jacque et al., 1986) suggesting that these nuclei may reflect astrocytosis or gliosis in this genotype. A full histological characterization of the C3Fe.SWV Mbpshi/Mbpshi mutant has not been reported.
Fig. 8.
Light microscopy of Weil myelin-stained sections from the medial anterior commisure of a control (a) and shiverer (b) mouse. Normal compact myelin appears dark in the Weil stain and is significantly reduced or absent from the shiverer commisure. Enlargements of panels a and b are shown in panels c and d. An increase in nuclei within the shiverer commisure is observed that may reflect astrocytic changes or gliosis in the C3Fe.SWV Mbpshl/Mbpshl mutant. Weil-stained sections from the midbrain of (e) control and (f) shiverer mice show a similar pattern of compact myelin loss. The tract visible at the right in panel e is the fasciculus retrofiexus (approximate location: Bregma −2.80 mm).
The apparent increase in diffusion parallel to the fiber axis seen by histological DTI in shiverer may have several causes. Possible mechanisms include reduced extra-axonal diffusion restrictions arising either from the absence of compact myelin or the increase in the partial volume of cell bodies within the tract. Further correlation of MRI measures with histological measures such as nuclear density within white matter tracts is warranted. Ex vivo MRI at high SNR and spatial resolution may play an important role in identifying such correlations between histology and in vivo MRI. The DTI acquisition used here is not sufficiently specific to differentiate between these or other potential mechanisms. Multi-component DTI, diffusion spectrum imaging (DSI) and q-space analyzed diffusion measurements are all candidate methods for further studies of this effect, particularly in separating the contributions from diffusion compartments.
These findings are more consistent with the results of Gulani et al. (2001) in fixed spinal tissue than the in vivo results of Song et al. (2002) who observed that the radial components were increased in white matter, but that the axial component did not differ. In that work, the statistical analysis of differences was performed in vivo using manually defined regions of interest in 2D multi-slice DTI data. Further in vivo studies using rapid acquisition sequences such as RARE, U-FLARE or EPI may shed more light on whether the increase in axial diffusion is a postmortem fixation artifact or arises from microanatomical changes arising directly or indirectly from dysmyelination.
This study was limited to perfusion fixed brains due to the minimum time constraints imposed by high-resolution spin-echo DTI. Imaging times exceeded 6 h even with T1 reduction with gadoteridol. The relevance of in vitro and ex vivo magnetic resonance imaging for tissue microanatomy has been debated, with Sun et al. demonstrating that anisotropy indices are preserved postfixation with a general decrease in the tensor trace (Sun et al., 2003).
Application of ex vivo MR as an adjunct to conventional histological examination has a number of significant advantages. First, the intrinsic three dimensional aspect of the MR data allows detection and conceptualization of complex structural connections within the brain between tracts, nuclei and other structures. In contrast, 3D reconstruction from traditional histological sections is non-trivial and can be computationally intensive (Ali and Cohen, 1998; Gefen et al., 2003). Second, although the acquisition time reported here is relatively long in comparison to in vivo MRI protocols, this time is still significantly shorter than that required for embedding, sectioning and staining material for histology, even without additional 3D reconstructions. Third, the lack of dehydration and sectioning artifacts in MR images assists the subsequent conventional histological analysis of the same brain, since the two modalities are not mutually exclusive and, as shown here and in other studies (Bobinski et al., 2000; Shapiro et al., 2004), can be applied sequentially to a single specimen. Thus, structures identified in each type of image can be correlated, with ex vivo MR microscopy providing a natural link between low resolution in vivo MRI and high-resolution conventional histology.
From a broader perspective, it is well known that myelin is essential for salutatory conduction of nerve impulses which increases conduction speed, even in small diameter axons (Waxman, 1977; Gillespie and Stein, 1983). Recent evidence suggests that myelin has other more subtle rolls in the CNS. Cognitive and motor-coordinated capabilities have been studied in hypomyelinated mutants. These mice appear to have learning disabilities in the water maze and rotor rod test although it is difficult to distinguish cognitive from coordination capabilities in these tests (Inagawa et al., 1988; Uschkureit et al., 2000). It is also known that compact myelin is required for the maturation of the axonal skeleton (Brady et al., 1999) and axonal degeneration is evident in hypomyelinated mutants on day P40 (Griffiths et al., 1998) and P120 (Uschkureit et al., 2000). An understanding of the broader significance of our results will require further studies, particularly in relating regional CNS dysmyelination to observable cognitive and physical perturbations.
Conclusions
High-resolution contrast enhanced DTI allows whole-brain searches for statistically significant differences between the fixed brains of shiverer mice and wild-type controls. This approach eliminates the need for prior assumptions regarding anatomic regions of interest. Statistical parametric mapping revealed a general increase in both axial and radial diffusivity in the white matter of fixed shiverer brains. Highly significant increases in diffusivity were also detected in the thalamus, midbrain, brain stem and cerebellar white matter consistent with a high density of myelinated axons. Fractional anisotropy was found to be much less sensitive than the tensor trace and eigenvalues to dysmyelination and associated microanatomic changes.
Acknowledgments
The authors wish to thank Tim Hiltner for mouse perfusions and brain preparation, Natasha Kovacevic, Josette Chen and Mark Henkelmann for invaluable discussions regarding image coregistration and tissue fixation. This work was funded in part by the Human Brain Project (EB00232) with contributions from the National Institute of Biomedical Imaging and Bioengineering and the National Institute of Mental Health, the NCRR (RR13625) and NIHM (MH61223).
References
- Abramoff MD, Magelhaes PJ. Image processing with image. J. Biophoton. Int. 2004;11(7):36–42. [Google Scholar]
- Ahrens ET, Laidlaw DH, et al. MR microscopy of transgenic mice that spontaneously acquire experimental allergic encephalomyelitis. Magn. Reson. Med. 1998;40(1):119–132. doi: 10.1002/mrm.1910400117. [DOI] [PubMed] [Google Scholar]
- Ali WS, Cohen FS. Registering coronal histological 2-D sections of a rat brain with coronal sections of a 3-D brain atlas using geometric curve invariants and B-spline representation. IEEE Trans. Med. Imag. 1998;17(6):957–966. doi: 10.1109/42.746628. [DOI] [PubMed] [Google Scholar]
- Anderson AW. Theoretical analysis of the effects of noise on diffusion tensor imaging. Magn. Reson. Med. 2001;46(6):1174–1188. doi: 10.1002/mrm.1315. [DOI] [PubMed] [Google Scholar]
- Assaf Y, Freidlin RZ, et al. New modeling and experimental framework to characterize hindered and restricted water diffusion in brain white matter. Magn. Reson. Med. 2004;52(5):965–978. doi: 10.1002/mrm.20274. [DOI] [PubMed] [Google Scholar]
- Basser PJ, Jones DK. Diffusion-tensor MRI: theory, experimental design and data analysis—A technical review. NMR Biomed. 2002;15(7–8):456–467. doi: 10.1002/nbm.783. [DOI] [PubMed] [Google Scholar]
- Basser PJ, Mattiello J, et al. Estimation of the effective self-diffusion tensor from the Nmr spin-echo. J Magn. Reson. Ser. B. 1994;103(3):247–254. doi: 10.1006/jmrb.1994.1037. [DOI] [PubMed] [Google Scholar]
- Basser PJ, Pajevic S. Statistical artifacts in diffusion tensor MRI (DT-MRI) caused by background noise. Magn. Reson. Med. 2000;44(1):41–50. doi: 10.1002/1522-2594(200007)44:1<41::aid-mrm8>3.0.co;2-o. [DOI] [PubMed] [Google Scholar]
- Basser PJ, Pierpaoli C. A simplified method to measure the diffusion tensor from seven MR images. Magn. Reson. Med. 1998;39(6):928–934. doi: 10.1002/mrm.1910390610. [DOI] [PubMed] [Google Scholar]
- Beaulieu C, Allen PS. Determinants of anisotropic water diffusion in nerves. Magn. Reson. Med. 1994;31(4):394–400. doi: 10.1002/mrm.1910310408. [DOI] [PubMed] [Google Scholar]
- Beaulieu C, Fenrich FR, et al. Multicomponent water proton transverse relaxation and T-2- discriminated water diffusion in myelinated and nonmyelinated nerve. Magn. Reson. Imaging. 1998;16(10):1201–1210. doi: 10.1016/s0730-725x(98)00151-9. [DOI] [PubMed] [Google Scholar]
- Biddle F, March E, et al. Research news. Mouse News Lett. 1973;48:24. [Google Scholar]
- Bird TD, Farrell DF, et al. Brain lipid composition of the shiverer mouse; (genetic defect in myelin development) J. Neurochem. 1978;31(1):387–391. doi: 10.1111/j.1471-4159.1978.tb12479.x. [DOI] [PubMed] [Google Scholar]
- Bobinski M, de Leon MJ, et al. The histological validation of post mortem magnetic resonance imaging-determined hippocampal volume in Alzheimer’s disease. Neuroscience. 2000;95(3):721–725. doi: 10.1016/s0306-4522(99)00476-5. [DOI] [PubMed] [Google Scholar]
- Brady ST, Witt AS, et al. Formation of compact myelin is required for maturation of the axonal cytoskeleton. J. Neurosci. 1999;19(17):7278–7288. doi: 10.1523/JNEUROSCI.19-17-07278.1999. [DOI] [PMC free article] [PubMed] [Google Scholar]
- Donoho DL, Johnstone IM. Ideal spatial adaptation by wavelet shrinkage. Biometrika. 1994;81(3):425–455. [Google Scholar]
- Dupouey P, Jacque C, et al. Immunochemical studies of myelin basic protein in shiverer mouse devoid of major dense line of myelin. Neurosci. Lett. 1979;12(1):113–118. doi: 10.1016/0304-3940(79)91490-3. [DOI] [PubMed] [Google Scholar]
- Gefen S, Tretiak O, et al. Elastic 3-D alignment of rat brain histological images. IEEE Trans. Med. Imag. 2003;22(11):1480–1489. doi: 10.1109/TMI.2003.819280. [DOI] [PubMed] [Google Scholar]
- Gillespie MJ, Stein RB. The relationship between axon diameter, myelin thickness and conduction-velocity during atrophy of mammalian peripheral-nerves. Brain Research. 1983;259(1):41–56. doi: 10.1016/0006-8993(83)91065-x. [DOI] [PubMed] [Google Scholar]
- Griffiths I, Klugmann M, et al. Axonal swellings and degeneration in mice lacking the major proteolipid of myelin. Science. 1998;280(5369):1610–1613. doi: 10.1126/science.280.5369.1610. [DOI] [PubMed] [Google Scholar]
- Gruetter R. Automatic, localized in vivo adjustment of all first- and second-order shim coils. Magn. Reson. Med. 1993;29(6):804–811. doi: 10.1002/mrm.1910290613. [DOI] [PubMed] [Google Scholar]
- Gulani V, Webb AG, et al. Apparent diffusion tensor measurements in myelin-deficient rat spinal cords. Magn. Reson. Med. 2001;45(2):191–195. doi: 10.1002/1522-2594(200102)45:2<191::aid-mrm1025>3.0.co;2-9. [DOI] [PubMed] [Google Scholar]
- Hasan KM, Parker DL, et al. Comparison of gradient encoding schemes for diffusion-tensor MRI. J. Magn. Reson. Imaging. 2001;13(5):769–780. doi: 10.1002/jmri.1107. [DOI] [PubMed] [Google Scholar]
- Inagawa K, Watanabe S, et al. The role of myelination in learning performance observed in two strains of myelin-deficient mutant mice (shiverer and mld) Behav. Neural Biol. 1988;50(2):184–192. doi: 10.1016/s0163-1047(88)90871-0. [DOI] [PubMed] [Google Scholar]
- Jacque C, Rolland B, et al. Absence of correlations between glutamine-synthetase activity and dysmyelination-associated modifications of astroglia in the brain of murine mutants. Neurochem. Res. 1986;11(4):527–533. doi: 10.1007/BF00965322. [DOI] [PubMed] [Google Scholar]
- Kimura M, Sato M, et al. Restoration of myelin formation by a single type of myelin basic protein in transgenic shiverer mice. Proc. Natl. Acad. Sci. U. S. A. 1989;86(14):5661–5665. doi: 10.1073/pnas.86.14.5661. [DOI] [PMC free article] [PubMed] [Google Scholar]
- Le Bihan D, Mangin JF, et al. Diffusion tensor imaging: concepts and applications. J. Magn. Reson. Imag. 2001;13(4):534–546. doi: 10.1002/jmri.1076. [DOI] [PubMed] [Google Scholar]
- Mattiello J, Basser PJ, et al. The b matrix in diffusion tensor echo-planar imaging. Magn. Reson. Med. 1997;37(2):292–300. doi: 10.1002/mrm.1910370226. [DOI] [PubMed] [Google Scholar]
- Mori S, ltoh R, et al. Diffusion tensor imaging of the developing mouse brain. Magn. Reson. Med. 2001;46(1):18–23. doi: 10.1002/mrm.1155. [DOI] [PubMed] [Google Scholar]
- Neil J, Miller J, et al. Diffusion tensor imaging of normal and injured developing human brain—A technical review. NMR Biomed. 2002;15(7–8):543–552. doi: 10.1002/nbm.784. [DOI] [PubMed] [Google Scholar]
- Otsu N. Threshold selection method from gray-level histograms. IEEE Trans. Syst. Man Cybernet. 1979;9(1):62–66. [Google Scholar]
- Paxinos G, Franklin KBJ. The Mouse Brain in Stereotaxic Coordinates. San Diego: Academic Press; 2001. [Google Scholar]
- Privat A, Jacque C, et al. Absence of the major dense line in myelin of the mutant mouse “shiverer”. Neurosci. Lett. 1979;12(1):107–112. doi: 10.1016/0304-3940(79)91489-7. [DOI] [PubMed] [Google Scholar]
- Readhead C, Popko B, et al. Expression of a myelin basic protein gene in transgenic shiverer mice: correction of the dysmyelinating phenotype. Cell. 1987;48(4):703–712. doi: 10.1016/0092-8674(87)90248-0. [DOI] [PubMed] [Google Scholar]
- Roach A, Takahashi N, et al. Chromosomal mapping of mouse myelin basic protein gene and structure and transcription of the partially deleted gene in shiverer mutant mice. Cell. 1985;42(1):149–155. doi: 10.1016/s0092-8674(85)80110-0. [DOI] [PubMed] [Google Scholar]
- Shapiro EM, Skrtic S, et al. MRI detection of single particles for cellular imaging. Proc. Natl. Acad. Sci. U. S. A. 2004;101(30):10901–10906. doi: 10.1073/pnas.0403918101. [DOI] [PMC free article] [PubMed] [Google Scholar]
- Skare S, Li T. Noise considerations in the determination of diffusion tensor anisotropy. Magn. Reson. Imaging. 2000;18(6):659–669. doi: 10.1016/s0730-725x(00)00153-3. [DOI] [PubMed] [Google Scholar]
- Song SK, Sun SW, et al. Dysmyelination revealed through MRI as increased radial (but unchanged axial) diffusion of water. Neuroimage. 2002;17(3):1429–1436. doi: 10.1006/nimg.2002.1267. [DOI] [PubMed] [Google Scholar]
- Sun SW, Neil JJ, et al. Relative indices of water diffusion anisotropy are equivalent in live and formalin-fixed mouse brains. Magn. Reson. Med. 2003;50(4):743–748. doi: 10.1002/mrm.10605. [DOI] [PubMed] [Google Scholar]
- Uschkureit T, Sporkel O, et al. Early onset of axonal degeneration in double (plp−/−mag−/−) and hypomyelinosis in triple (plp−/−mbp−/−mag−/−) mutant mice. J. Neurosci. 2000;20(14):5225–5233. doi: 10.1523/JNEUROSCI.20-14-05225.2000. [DOI] [PMC free article] [PubMed] [Google Scholar]
- Waxman SG. Conduction in myelinated, unmyelinated, and demyelinated fibers. Arch. Neurol. 1977;34(10):585–589. doi: 10.1001/archneur.1977.00500220019003. [DOI] [PubMed] [Google Scholar]
- Woods RP, Grafton ST, et al. Automated image registration: I. General methods and intrasubject, intramodality validation. J. Comput. Assist. Tomogr. 1998;22(1):139–152. doi: 10.1097/00004728-199801000-00027. [DOI] [PubMed] [Google Scholar]
- Woods RP, Grafton ST, et al. Automated image registration: II. Intersubject validation of linear and nonlinear models. J. Comput. Assist. Tomogr. 1998;22(1):153–165. doi: 10.1097/00004728-199801000-00028. [DOI] [PubMed] [Google Scholar]
- Zhang J, Richards LJ, et al. Three-dimensional anatomical characterization of the developing mouse brain by diffusion tensor microimaging. NeuroImage. 2003;20(3):1639–1648. doi: 10.1016/s1053-8119(03)00410-5. [DOI] [PubMed] [Google Scholar]


