

Abstract
Slow axonal transport conveys perikaryally-synthesized cytosolic proteins in a rate-class called Slow Component-b (SCb). One such protein – α-synuclein – is largely conveyed in SCb, and is also a key player in a group of neurodegenerative diseases called synucleinopathies. Axonal transport defects of α-synuclein have been hypothesized to play a role in synucleinopathies, but mechanisms moving α-synuclein in slow axonal transport are unclear. Here we use a recently developed model-system in our laboratory to visualize the slow transport of α-synuclein, comparing it to another SCb protein synapsin. Despite differences inbiological properties and overallsolubility in axons, the anterograde transport of both SCb proteins was strikingly similar, suggesting commonalities in slow axonal transport mechanisms of seemingly diverse cytosolic cargoes. The data support a model where SCb proteins dynamically organize into ‘transport-competent’ complexes that are conveyed via transient associations with other persistently-moving cargoes (“mobile-units”). The identity of the latter is yet unknown. Visualizing normal α-synuclein transport may also open the door to studies of α-synuclein transport in pathologic states.
Keywords: Cytosolic synaptic proteins, synapsin, α-synuclein, slow axonal transport, transport packets, cargo complexes, diffusion, slow component – b, SCb
Introduction
The vast majority of proteins are synthesized in the neuronal perikarya and subsequently transported to their destinations within axons and synapses. Previous pulse-chase radiolabeling studies have established the overall nature of this transport, showing that after synthesis, proteins are conveyed in two overall rate-classes. Membranous organelles such as vesicles and mitochondria move in fast axonal transport at overall rates of ~ 50–200 mm/day; whereas cytoskeletal proteins (like neurofilaments and microtubules) and cytosolic (or “soluble”) proteins are conveyed in slow axonal transport, at overall rates of only ~ 0.2–10 mm/day. The rate-classes carrying such cytoskeletal and cytosolic proteins have been historically designated Slow Component-a (SCa) and Slow Component-b (SCb) respectively. Typically, overall transport rates of cytosolic (or SCb) proteins are slightly faster than that of cytoskeletal proteins (Lasek et al., 1984), though such a clear-cut distinction is not always evident (McQuarrie et al., 1986; Ma et al., 2000).
Though radiolabeling studies characterized the overall dynamics of fast and slow axonal transport, they were not able to visualize the phenomena, and underlying mechanisms remained unclear. More recent studies have resolved many mechanistic details of neurofilaments and microtubules moving in slow axonal transport (Roy et al., 2000; Wang et al., 2000; Wang and Brown, 2001; Brown, 2003; Baas et al., 2006; Uchida et al., 2009). Regarding cytosolic SCb proteins, we found that populations of SCb proteins are conveyed as anterogradely-biased fluorescent plumes in axons (Scott et al., 2011), and this motion is motor (and microtubule) dependent (Scott et al., 2011). Here we use this paradigm to investigate the transport of α-synuclein. Though α-synuclein is a natively-unfolded protein that is soluble in physiologic states, accumulations and aggregations of α-synuclein in neuronal soma and proximal neurites is the hallmark of a group of diseases called synucleinopathies — which include Parkinson’s disease — and as such, one hypothesis is that the axonal transport of α-synuclein is disrupted in diseased states (Roy, 2009).
Though previous studies have analyzed α-synuclein transport by pulse-chase radiolabeling (Jensen et al., 1999; Li et al., 2004) and also by examining fluorescence “fronts” in fixed cultured axons that were transfected with GFP:α-synuclein (Saha et al., 2004), these experimental paradigms do not allow direct visualization of the slow transport. Even in our own previous studies (Roy et al., 2007), where we analyzed moving particles of GFP:α-synuclein in thin distal axons in steady-state, the interpretation is complicated by our current understanding that a proportion (albeit small) of SCb particles are transported in the fast component (see fig. 4 of Scott et al. [2011]; also see ‘Discussion’ section below).
Figure 4. Particle kinetics of synapsin and α-synuclein.

(A, B) Fast-moving particles (sample tracks overlaid with diagonal yellow lines) were seen in both synapsin and α-synuclein kymographs.
(C) A kymograph from PAGFP:synapsin imaging. Insets in kymographs (ROI magnified on right) show “negative shadows” (marked by asterisks) that are flanked by fluorescent molecules, giving the appearance that a large motile object is ‘shooting across’ the axon, and that SCb particles are associating with this object. Though these observations are qualitative, we frequently see such events in our experiments, suggesting that SCb particles may be associating with a larger persistently moving structure within axons (hypothetical “mobile units”, see text). The identity of these structures is yet unknown. Scale bar = 5 µm; time in seconds shown to the left of the kymographs.
Here we compare and contrast the slow axonal transport of two cytosolic proteins synapsin and α-synuclein using our new photoactivation paradigm. Previous radiolabeling studies have shown that the vast majority of synapsin (Baitinger and Willard, 1987; Petrucci et al., 1991; Paggi and Petrucci, 1992) and α-synuclein (Jensen et al., 1999; Li et al., 2004) is conveyed in SCb. We found that despite the differences in overall solubility, both proteins are transported in a remarkably similar manner, suggesting commonalities in overall mechanistic events that drive their transport.
Results
Synapsin and α-synuclein are conveyed with an anterograde bias in axons, despite differences in overall mobility
The photoactivation assay used to visualize the axonal transport of cytosolic SCb cargoes was described in detail in our recent publications (Roy et al., 2011; Scott et al., 2011). Briefly, cultured hippocampal neurons were transfected with synapsin and α-synuclein tagged to photoactivatable green fluorescent protein (PA-GFP), and a discrete region of interest (ROI) was photoactivated (fig. 1A – top panels). Fluorescence within the photoactivated ROI dispersed with a distinct anterograde bias – both for synapsin and α-synuclein (note the anterogradely-biased plume of fluorescence in kymographs, fig. 1). However the overall kinetics of dispersion of these two proteins was different in axons, as measured by the rate of fluorescence decay of the photoactivated zone (fig. 1C). Specifically, the decay of α-synuclein (pink circles) was much faster than that of synapsin (green circles), suggesting that the overall biological behavior of these two proteins (including intracellular interactions) are likely different. Also note that the mobility of both proteins is much slower than the diffusion of untagged PA-GFP.
Figure 1. Kinetics of synapsin and α-synuclein in axons.
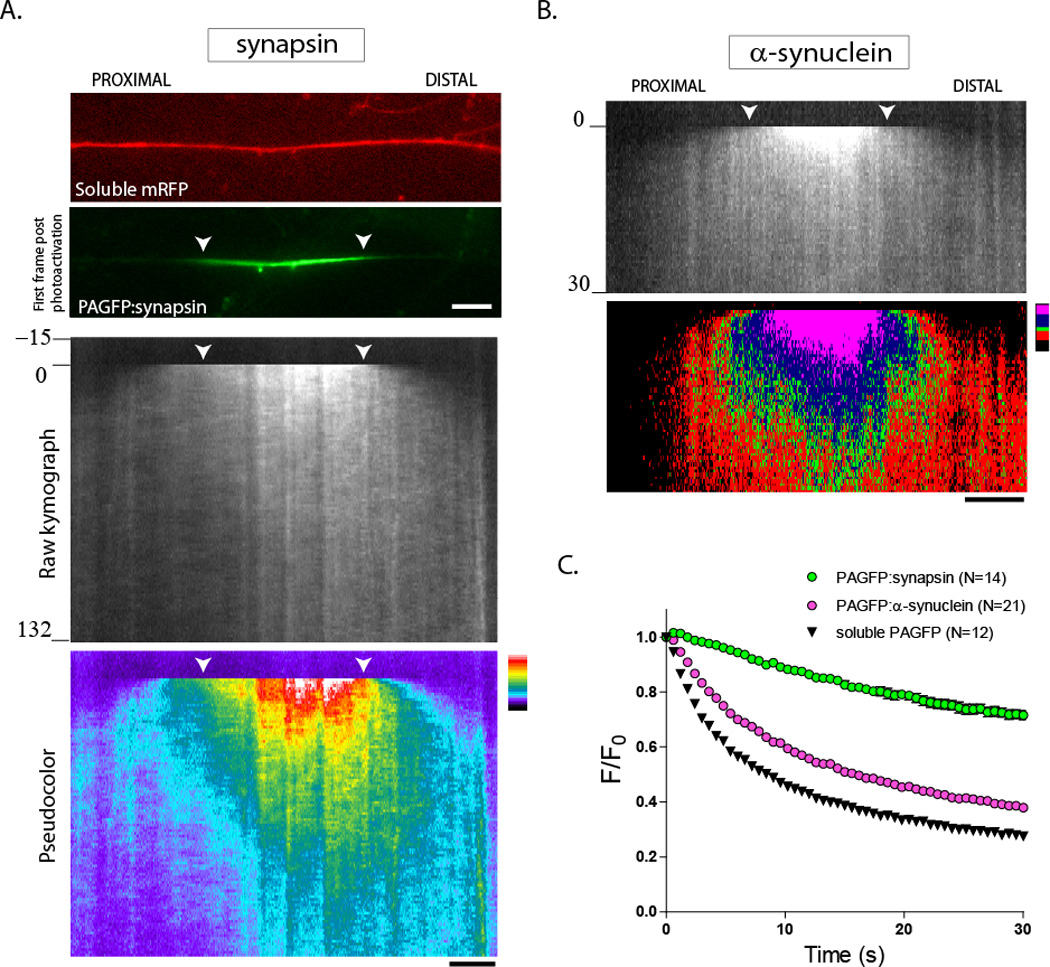
Cultured hippocampal neurons were co-transfected with PA-GFP synapsin (or PAGFP:α-synuclein) and soluble mRFP (to locate transfected axons), a discrete axonal ROI was photoactivated, and the activated zone was visualized by live imaging. Anterograde is left to right, white arrowheads mark the photoactivated ROI throughout the figure.
(A) Images show a transfected axon with soluble mRFP (top); an image of PAGFP:synapsin immediately after photoactivation is also shown (bottom). The raw kymograph demonstrates the biased movement of photoactivated synapsin. The same kymograph is pseudocolored (bottom), highlighting the anterogradely-biased plume of fluorescence.
(B) A similar anterograde bias is also seen with α-synuclein.
(C) Graph demonstrates rate of fluorescence decay of PAGFP-tagged proteins within the photoactivated ROI over time. Note that the fluorescence decay is slowest for synapsin, whereas α-synuclein decays much faster, with decay-kinetics almost resembling that of a freely diffusible protein (soluble, untagged PAGFP). These data are consistent with the notion that α-synuclein has higher diffusible pools in axons (see text).
Scale bar = 5 µm; time in seconds shown to the left of the kymographs.
Synapsin and α-synuclein are transported anterogradely with similar overall dynamics
Next we used the ‘intensity-center’ assay to quantify the bulk movement of synapsin and α-synuclein (Roy et al., 2011; Scott et al., 2011). The key steps of this quantitative assay are summarized in figure 2. Essentially this assay quantifies the centroid of average fluorescence intensities along linescans drawn through the photoactivated zone; for every successive frame of a given time-lapse. The workings of this assay is demonstrated in figure 2B, using linescans drawn through three arbitrarily selected incremental time-points. Note that with the passage of time the centroid (grey arrowhead) is also shifted anterogradely. This shift is demonstrated in the raw datasets (as output from MATLAB); depicted in figure 2C and D. Cumulative shifts from all photoactivation experiments are plotted in figure 3. Note that despite the greater variability in the α-synuclein dataset, the intensity-shifts as well as the periodicity of the fluctuations in the datasets are similar.
Figure 2. Quantitative evaluation of bulk protein movement.
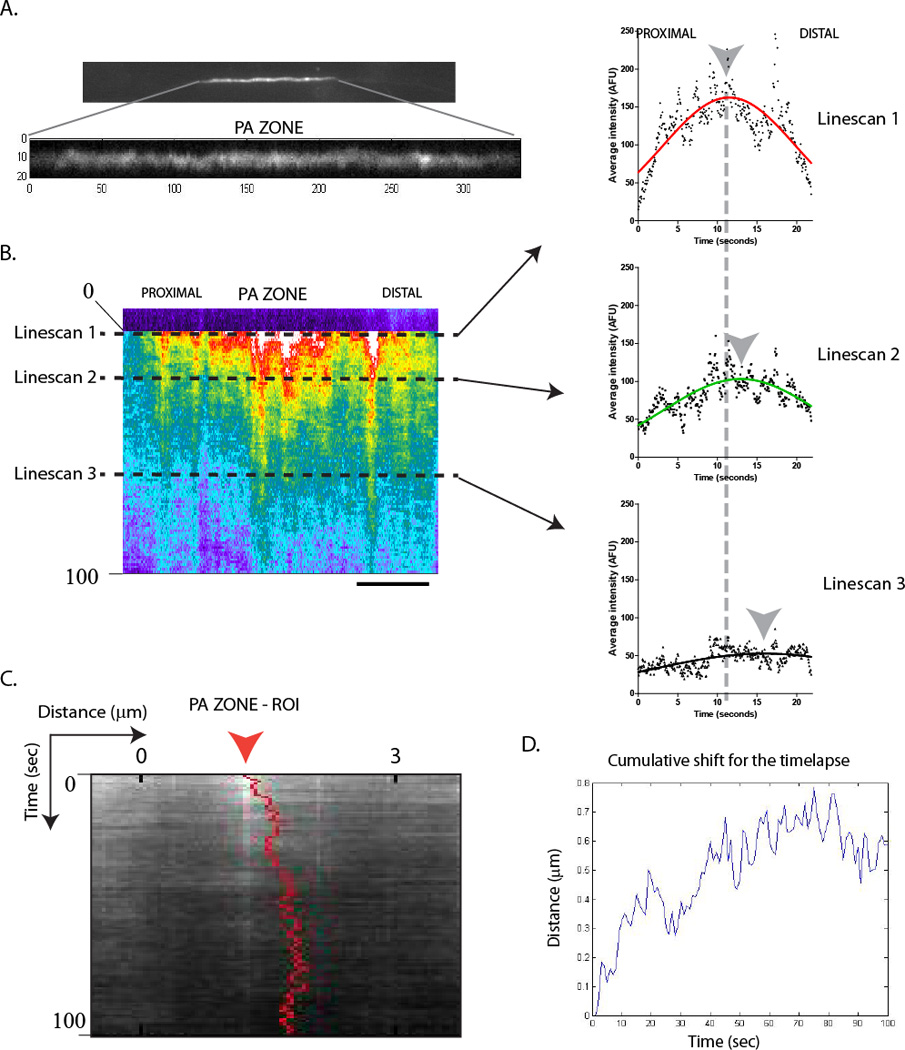
The photoactivated ROI was subjected to intensity-center analysis as described in the text.
(A) A sample photoactivated zone is shown. Note that when scaled appropriately to maximize bit-depth, particles of PAGFP:synapsin are clearly visualized within the diffusible background of fluorescence.
(B) The kymograph corresponding to the axon above. Arbitrarily selected incremental line-scans across the photoactivated ROI are shown on right, with Gaussian fits (note that the Gaussian fits are only shown for display, the raw data are used for all actual calculations). Note the anterograde shifts in the centroids (grey arrowheads) of the intensity line-scans over time.
(C, D) Show the raw data for the axon above; as it is output from MATLAB (see text). In (C), the shift is overlaid on the original kymograph (unscaled), and (D) is a graphical representation of the same data.
Scale bar = 5µm; time in seconds shown to the left of the kymographs.
Figure 3. The overall anterograde bias of synapsin and α-synuclein population.

(A, B) Cumulative intensity center plots (mean ±SEM) of synapsin and synuclein (N=14 and 21 axons analyzed respectively, from 3–5 separate experiments) are shown. Smoothened fits through the data-points is also shown. The higher diffusiveness of α-synucleinin axons may be responsible for the greater variability in the α-synuclein datasets., compared to synapsin and reflects a limitation of the photoactivation assay (also see Roy et al., 2011).
(C) Overlay of the fits above highlights similarities in the overall anterograde transport of synapsin and α-synuclein.
Particle-kinetics of synapsin and α-synuclein
A closer examination of the kymographs obtained from rapid imaging reveal unequivocal linear diagonal ‘tracks’, indicating the movement of particulate fluorescent structures within axons. We previously showed that such tracks are present in kymographs obtained from imaging SCb proteins, especially when low amounts were photoactivated [Supplementary fig. 4 of Scott et al., 2011]. Here we show that such linear tracks are seen in both synapsin and α-synuclein kymographs (fig. 4A, B), again pointing to commonalities in transport mechanisms. These data are consistent with the notion that oligomers/complexes of cytosolic SCb proteins bind to a more persistently-mobile cargo in axons. Moreover, we occasionally observed particles of SCb proteins that were seemingly associated with a larger structure that was also being transported in axons (fig. 4C). Though qualitative, these data suggest that SCb particles associate with larger ‘mobile-units’ in axons. Note that such linear, diagonal tracks in kymographs are unique to SCb proteins and are not seen in kymographs obtained from imaging soluble (untagged) PAGFP (Scott et al., 2011).
Comparing biochemical profiles of synapsin and α-synuclein in-vivo
We have previously shown that synapsin and CamKIIa — two proteins conveyed in SCb — are present in higher-density sucrose-gradient fractions from mouse brains, suggesting that these proteins are organized into supra-molecular structures. Here we asked if α-synuclein was also organized in high-density axon-enriched fractions from mouse brains (fig. 5A, top). As reported previously, we found that α-synuclein was largely excluded from the P100 fractions, but was instead enriched in the S100 fractions (fig. 5A, bottom) [Kahle et al., 2000]. This lack of association of α-synuclein with the pellet fractions has been attributed to weak interactions with other structures. Nevertheless, α-synuclein in the S100 was also localized to higher-density fractions, along with synapsin (fig. 5B). These data argue that in vivo: both synapsin and α-synuclein are organized into higher-density supra-molecular complexes.
Figure 5. Biochemical analysis of α-synuclein from synaptosome-depleted fractions.

(A) Mouse brains were subjected to sequential fractionation as shown, and the fractions were assayed for synapsin and α-synuclein by Western blotting. Note that synapsin is distributed in both the soluble (S100) and pellet (P100) fractions, whereas α-synuclein is primarily found in the soluble fractions; in agreement with previous studies.
(B) Further sucrose-gradient separation of the S100 shows that both proteins are localized within higher density fractions, suggesting organization into higher-order complexes. Densitometry analysis is shown below.
Discussion
Using a recent photoactivation-based assay developed by our laboratory to study cytosolic protein transport, here we analyzed the transport of α-synuclein, comparing it to synapsin. We found that despite differences in their overall mobility in axons (fig. 1C), the slow anterograde transit of both proteins was strikingly similar, suggesting commonalities in their overall modes of transport. The data support a model where diverse cytosolic proteins organize into ‘transport competent’ protein complexes that are subsequently conveyed in axons.
Previous pulse-chase radiolabeling studies in relatively long axons have characterized the overall motion of SCb proteins in some detail. Garner and Lasek showed that individual profiles (‘waves’) of SCb proteins in-vivo are conveyed in a fairly “cohesive” manner (Garner and Lasek, 1982). Specifically, there was a remarkable overlap in the “fronts” (the leading edge of the waveforms) of individual SCb proteins as they were conveyed along axons, and this relative coherence of movement was maintained for many SCb proteins, even after several days of transport. This phenomenon is quite remarkable, and the authors argued that SCb proteins were organized into supra-molecular complexes that were being conveyed in axons (Garner and Lasek, 1982).
Furthermore, the authors pointed out some intriguing details of the radiolabeling profiles as they were being transported in axons. As expected, each SCb radiolabeled ‘wave’ had a “front”, a “peak”, and a “trailing edge” as the wave profiles ‘moved’ along the axon (note that the radiolabeling assay allows one to infer such movement based on static ‘snapshots’ at varying time-points). Focusing on the individual waveform profiles, the authors noted that while there was a remarkable similarity in the “fronts” and the “peaks” of various SCb proteins, there was “a great degree of variation among the individual polypeptides in the rapidity with which the radioactivity trailing behind the peaks returns to background levels” (Garner and Lasek, 1982). A reasonable interpretation of this is that while some SCb proteins were bound tightly to putative transport-complexes, others were more loosely associated, and the latter proteins were deposited along the axon as they were transported, leading to a broad “trailing edge”. Though speculative, the idea is conceptually appealing, and perhaps can be directly tested as our knowledge about SCb transport expands over the years.
The concept of “cohesive” transport of multiple cytosolic proteins can be interpreted as an extension of the “structural hypothesis” (Tytell et al., 1981), though the universality of this hypothesis remains controversial (Miller and Heidemann, 2008).Nevertheless, our data support the overall idea that SCb proteins are organized into supra-molecular structures, as we can directly visualize mobile particles in axons (fig. 4 and Scott et al. [2011]), and our biochemical data indicate that SCb proteins in brains are present in high-density fractions (fig. 5 and Scott et al., [2001]). A closer examination of the kymographs reveals that these tracks sometimes appear to associate with a relatively large moving object (see fig. 4C). Though qualitative, these observations suggest that SCb protein complexes may transiently associate with a faster-moving (large) structure within axons (“mobile-unit”), and that such associations eventually lead to a net slow movement of the entire population. The identity of this hypothetical mobile-unit is yet unknown, and is a subject of investigation.
Finally, in our earlier studies, we used green/red FP-tagged synapsin and α-synuclein, examining their steady-state behavior in thin, distal axons (Roy et al., 2007). Though particles of synapsin and α-synuclein were unequivocally co-transported (as seen by direct dual-cam imaging, [Roy et al., 2007]), the interpretation is complicated by our more recent observations that small fractions of perikaryally-derived synapsin proteins are conveyed persistently as well, likely moving in fast axonal transport (see fig. 4 of Scott et al., 2011). In-vivo radiolabeling studies also showed small amounts (10–15%) of synapsin and α-synuclein in fast axonal transport (Baitinger and Willard, 1987; Jensen et al., 1999); and this is true for other SCb proteins as well. As shown in figure 4B of Scott et al., 2011, this persistently-moving population (likely moving in fast transport) associates with vesicles (synaptophysin-positive), and it remains to be seen if fast vesicular transport also plays a role in SCb transport as well.
Materials and Methods
Hippocampal Cell Cultures, Transfections, and Plasmids
Hippocampal cultures were prepared from brains of postnatal (P0–P2) CD-1 mice and maintained as previously described [Scott et al. 2010, 2011]. Neurons were transfected with the appropriate PAGFP construct and soluble mRFP at DIV 7–9 with Lipofectamine-2000 (Invitrogen) and imaged 17–24h later. GFP:synapsin-Ia (a gift from Dr. George Augustine) and GFP:human-αsynuclein were subcloned into the PAGFP vector using standard cloning techniques. All animal studies were performed in accordance with University of California guidelines.
Live Imaging and Image Analysis
Photoactivation experiments were performed using an Olympus IX81 inverted motorized epifluorescence microscope (for comprehensive details on photoactivation setup, see Roy et al. [2011]). Neurons were transferred to Hibernate media (Brainbits) supplemented with 2% B27, 2mM Glutamax, 0.4% D-glucose, 37.5mM NaCl (Roy et al., 2011; Scott et al., 2011) and maintained at 37°C (Precision Control Weatherstation) for the duration of the experiments. Axons were photoactivated for 1s and typically imaged at 2 frames/second. Intensity-center assay was performed as detailed in (Roy et al., 2011). Briefly, images were first background-subtracted and the photactivated ROI as cropped using Metamorph. Kymographs generated from these movies were subsequently analyzed in Matlab (Roy et al., 2011). Fluorescence decay analyses were also performed using the same cropped ROI’s. A polygonal region was traced around the activated region of the axon and extended four to six pixels on either side of the central axis of the axon to include all fluorescence (Trivedi et al., 2007). The average fluorescence of this region was then measured in each frame (Fn) and compared to the fluorescence of the first frame as a ratio (Fn/F0). All data were graphically represented either as the intensity-center shifts or Fn/F0 versus time. All data presented were obtained from at least 3–5 replicates from different culture-sets.
Biochemical Assays
In-vivo biochemical assays were done essentially following the protocol described by Scott et al. (Scott et al., 2011). Briefly, 4–6 weeks old CD-1 mouse brains were homogenized in buffer containing 20 mM HEPES, pH 7.2, 40 mM KCl, 5 mM EGTA, 5 mM EDTA, and protease inhibitors. The resulting homogenate was centrifuged at 1000 g for 20 min to obtain a nuclear pellet (P1) and a post-nuclear supernatant (S1). The supernatant S1 was centrifuged at 10,200 × g for 20 min to obtain the crude synaptosomal fraction (P2) and synaptosome-depleted fraction (S2). S2 supernatant was then centrifuged at 100,000 × g for 1 hr at 4°C to obtain supernatant S100 and pellet P100. For density gradient floatation assays, S100 and P100 fractions were adjusted to 45% sucrose, bottom-loaded on a 5%–45% sucrose gradient column, and centrifuged at 160,000 × g for 16 hr at 4°Cin a SW55-Ti rotor in an Optima L-100 ultracentrifuge (Beckman-Coulter). Ten fractions (0.5 ml each) were collected from the top of the gradient column and equal volumes were used for SDS-PAGE and western blot analysis. The following antibodies were used for Western blotting: anti-Synapsin-I at 1:5000 (Synaptic Systems), and anti-α-synuclein at 1:2000 (BD Biosciences). Blots were developed by using Pierce Fast Western Blot Kit ECL Substrate, visualized by using Versa Doc Imaging system (Bio-Rad), and quantified by densitometry.
Footnotes
The authors declare no conflict of interest.
References
- Baas PW, Vidya Nadar C, Myers KA. Axonal transport of microtubules: the long and short of it. Traffic. 2006;7:490–498. doi: 10.1111/j.1600-0854.2006.00392.x. [DOI] [PubMed] [Google Scholar]
- Baitinger C, Willard M. Axonal transport of synapsin I-like proteins in rabbit retinal ganglion cells. J Neurosci. 1987;7:3723–3735. doi: 10.1523/JNEUROSCI.07-11-03723.1987. [DOI] [PMC free article] [PubMed] [Google Scholar]
- Brown A. Axonal transport of membranous and nonmembranous cargoes: a unified perspective. J Cell Biol. 2003;160:817–821. doi: 10.1083/jcb.200212017. [DOI] [PMC free article] [PubMed] [Google Scholar]
- Garner JA, Lasek RJ. Cohesive axonal transport of the slow component b complex of polypeptides. J Neurosci. 1982;2:1824–1835. doi: 10.1523/JNEUROSCI.02-12-01824.1982. [DOI] [PMC free article] [PubMed] [Google Scholar]
- Jensen PH, Li JY, Dahlstrom A, Dotti CG. Axonal transport of synucleins is mediated by all rate components. Eur J Neurosci. 1999;11:3369–3376. doi: 10.1046/j.1460-9568.1999.00754.x. [DOI] [PubMed] [Google Scholar]
- Kahle PJ, Neumann M, Ozmen L, Muller V, Jacobsen H, Schindzielorz A, Okochi M, Leimer U, van der PH, Probst A, Kremmer E, Kretzschmar HA, Haass C. Subcellular localization of wild-type and Parkinson's disease-associated mutant alpha -synuclein in human and transgenic mouse brain. J Neurosci. 2000;20:6365–6373. doi: 10.1523/JNEUROSCI.20-17-06365.2000. [DOI] [PMC free article] [PubMed] [Google Scholar]
- Lasek RJ, Garner JA, Brady ST. Axonal transport of the cytoplasmic matrix. J Cell Biol. 1984;99:212s–221s. doi: 10.1083/jcb.99.1.212s. [DOI] [PMC free article] [PubMed] [Google Scholar]
- Li W, Hoffman PN, Stirling W, Price DL, Lee MK. Axonal transport of human alpha-synuclein slows with aging but is not affected by familial Parkinson's disease-linked mutations. J Neurochem. 2004;88:401–410. doi: 10.1046/j.1471-4159.2003.02166.x. [DOI] [PubMed] [Google Scholar]
- Ma D, Himes BT, Shea TB, Fischer I. Axonal transport of microtubule-associated protein 1B (MAP1B) in the sciatic nerve of adult rat: distinct transport rates of different isoforms. J Neurosci. 2000;20:2112–2120. doi: 10.1523/JNEUROSCI.20-06-02112.2000. [DOI] [PMC free article] [PubMed] [Google Scholar]
- McQuarrie IG, Brady ST, Lasek RJ. Diversity in the axonal transport of structural proteins: major differences between optic and spinal axons in the rat. J Neurosci. 1986;6:1593–1605. doi: 10.1523/JNEUROSCI.06-06-01593.1986. [DOI] [PMC free article] [PubMed] [Google Scholar]
- Miller KE, Heidemann SR. What is slow axonal transport? Exp Cell Res. 2008;10:1981–1990. doi: 10.1016/j.yexcr.2008.03.004. [DOI] [PubMed] [Google Scholar]
- Paggi P, Petrucci TC. Neuronal compartments and axonal transport of synapsin I. Mol Neurobiol. 1992;6:239–251. doi: 10.1007/BF02780556. [DOI] [PubMed] [Google Scholar]
- Petrucci TC, Macioce P, Paggi P. Axonal transport kinetics and posttranslational modification of synapsin I in mouse retinal ganglion cells. J Neurosci. 1991;11:2938–2946. doi: 10.1523/JNEUROSCI.11-09-02938.1991. [DOI] [PMC free article] [PubMed] [Google Scholar]
- Roy S, Yang G, Tang Y, Scott DA. A simple photoactivation and image analysis module for visualizing and analyzing axonal transport with high temporal resolution. Nat Protoc. 2011;7:62–68. doi: 10.1038/nprot.2011.428. [DOI] [PMC free article] [PubMed] [Google Scholar]
- Roy S. The paradoxical cell biology of α-synuclein. Results Probl Cell Differ. 2009;48:159–172. doi: 10.1007/400_2009_23. [DOI] [PubMed] [Google Scholar]
- Roy S, Winton MJ, Black MM, Trojanowski JQ, Lee VM. Rapid and intermittent cotransport of slow component-b proteins. J Neurosci. 2007;27:3131–3138. doi: 10.1523/JNEUROSCI.4999-06.2007. [DOI] [PMC free article] [PubMed] [Google Scholar]
- Roy S, Coffee P, Smith G, Liem RK, Brady ST, Black MM. Neurofilaments are transported rapidly but intermittently in axons: implications for slow axonal transport. J Neurosci. 2000;20:6849–6861. doi: 10.1523/JNEUROSCI.20-18-06849.2000. [DOI] [PMC free article] [PubMed] [Google Scholar]
- Saha AR, Hill J, Utton MA, Asuni AA, Ackerley S, Grierson AJ, Miller CC, Davies AM, Buchman VL, Anderton BH, Hanger DP. Parkinson's disease alpha-synuclein mutations exhibit defective axonal transport in cultured neurons. J Cell Sci. 2004;117:1017–10124. doi: 10.1242/jcs.00967. [DOI] [PubMed] [Google Scholar]
- Scott DA, Das U, Tang Y, Roy S. Mechanistic logic underlying the axonal transport of cytosolic proteins. Neuron. 2011;70:441–454. doi: 10.1016/j.neuron.2011.03.022. [DOI] [PMC free article] [PubMed] [Google Scholar]
- Trivedi N, Jung P, Brown A. Neurofilaments switch between distinct mobile and stationary states during their transport along axons. J Neurosci. 2007;27:507–516. doi: 10.1523/JNEUROSCI.4227-06.2007. [DOI] [PMC free article] [PubMed] [Google Scholar]
- Tytell M, Black MM, Garner JA, Lasek RJ. Axonal transport: each major rate component reflects the movement of distinct macromolecular complexes. Science. 1981;214:179–181. doi: 10.1126/science.6169148. 1981. [DOI] [PubMed] [Google Scholar]
- Uchida A, Alami NH, Brown A. Tight functional coupling of kinesin-1A and dynein motors in the bidirectional transport of neurofilaments. Mol Biol Cell. 2009;20:4997–5006. doi: 10.1091/mbc.E09-04-0304. [DOI] [PMC free article] [PubMed] [Google Scholar]
- Wang L, Ho CL, Sun D, Liem RK, Brown A. Rapid movement of axonal neurofilaments interrupted by prolonged pauses. Nat Cell Biol. 2000;2:137–141. doi: 10.1038/35004008. [DOI] [PubMed] [Google Scholar]
- Wang L, Brown A. Rapid intermittent movement of axonal neurofilaments observed by fluorescence photobleaching. Mol Biol Cell. 2001;12:3257–3267. doi: 10.1091/mbc.12.10.3257. [DOI] [PMC free article] [PubMed] [Google Scholar]