Abstract
Aqueous solutions of the detergent Fos-10 (n-decylphosphocholine) without and with addition of the integral membrane protein (IMP) OmpX (outer membrane protein X) have been characterized using pulsed field gradient-stimulated echo (PFG-STE) NMR experiments for measurements of translational diffusion coefficients. Effective diffusion coefficients for Fos-10 micelles in the absence of OmpX were obtained by observation of NMR signals from 10-bromodecan-1-ol that had been inserted into the micelles, and in the presence of OmpX by NMR observation of the protein. It is thus shown that solutions of Fos-10-reconstituted OmpX can be quantitatively described as a mixture of Fos-10 monomers, uniform Fos-10 micelles and uniform OmpX-containing Fos-10 micelles, with Fos-10 monomers in fast exchange between the pools of these three species. This result establishes an avenue for efficient determination of the effective translational diffusion coefficients of IMP-containing detergent micelles based on observation of the intense detergent NMR signals, which is also applicable with unlabeled IMPs. This monitoring of the species present in a given IMP solution contributes to improved guidelines for rational selection of detergent and buffer conditions in structural studies of integral membrane proteins.
Keywords: Stimulated echo NMR, pulsed field gradient NMR, critical micelle concentration, detergent exchange, hydrodynamic radius, 10-bromodecan-1-ol
Introduction
Micelle-forming detergents are widely used to solubilize integral membrane proteins (IMPs) for structural studies either by X-ray crystallography or by nuclear magnetic resonance (NMR) spectroscopy in solution. Systematic studies of aqueous solutions of detergent-solubilized IMPs are therefore of practical interest. In previous work we observed that high-quality 2D [15N,1H]-TROSY-NMR correlation maps of uniformly 2H,15N-labeled OmpX (outer membrane protein X from E. coli) reconstituted in detergent micelles were obtained only over a very limited range of detergent concentrations.1 Investigations of the hydrodynamic properties of [2H,15N]-OmpX/Fos-10 micelles using TRACT2 and the recently developed TRO-STE NMR methods3 then revealed that the size of the OmpX-containing micelles was maintained at approximately 50 kDa over a wide range of detergent concentrations above (Na,pm[OmpX] + c.m.c.), where Na,pm is the aggregation number for OmpX-loaded Fos-10 micelles. This indicated that increase of the viscosity due to micelle formation by excess detergent caused the observed deterioration of the NMR spectral quality at high detergent concentrations. In this paper we further refine the characterization of aqueous Fos-10 solutions with and without addition of OmpX.
In solutions containing multiple pools of species with rapid exchange of detergent monomers between the different pools (Figure 1), the measured translational diffusion coefficients correspond to a weighted average of the contributions from the different species. To obtain the effective diffusion coefficient for Fos-10 micelles we added 10-bromodecan-1-ol as a “NMR probe” into the micelles, and for OmpX-containing micelles we obtained the effective diffusion coefficient from NMR observation of the protein. The detergent Fos-10 was selected because it has a large c.m.c., so that effects from the pool of monomeric detergent on measured apparent diffusion coefficients are expected to be readily observable. With a view to future adaptations of the presently described procedures with other IMPs and detergents, including work with IMPs at natural isotope abundance, the main interest was to establish a protocol for efficient measurement of effective diffusion coefficients based on observation of the intense detergent NMR signals. Another essential feature of the project is that all experiments are based on micro-scale protein reconstitution and the use of micro-coil NMR equipment, so that the individual experiments can be performed with micro-gram quantities of the IMP.
Figure 1.
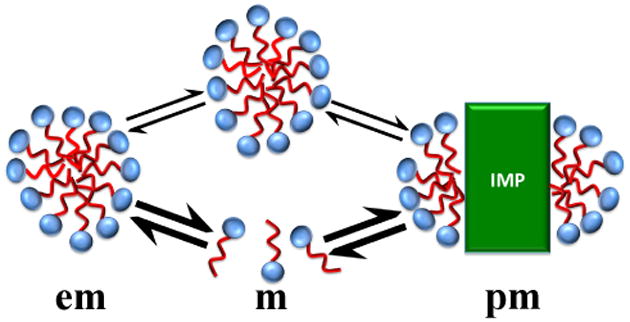
Scheme of an aqueous solution of an integral membrane protein (IMP) at detergent concentrations above (Na,pm[IMP] + c.m.c.), which contains detergent monomers (m) and uniform empty detergent micelles (em) in addition to uniform IMP-containing micelles (pm) (at concentrations below (Na,pm[IMP] + c.m.c.), the amount of detergent is not sufficient to support a homogeneous population of IMP-loaded micelles; see text). The information content of NMR experiments with observation of detergent signals depends on the detergent exchange rates along the pathways indicated by arrows (see text), where thick arrows represent micelle–monomer exchange, and thin arrows represent micelle–to-micelle exchange of detergent monomers medicated by collisions between the micelles.
Materials and Methods
Preparation of aqueous solutions of Fos-10 micelles doped with 10-bromodecan-1-ol
1μl of 10-bromodecan-1-ol was added to 60 μl of a 1.1 M Fos-10 stock solution in buffer A (5 mM sodium phosphate at pH 6.8, 10 mM NaCl, 90% H2O/10% D2O, 0.3 mM NaN3). This mixture was repeatedly stirred and heated to 50 °C until a clear solution was obtained. To prepare samples with Fos-10 concentrations in the range between 0.1 and 200 mM, the stock solution was diluted with buffer A.
Reconstitution of OmpX in Fos-10 micelles
[2H,15N]-labeled OmpX was expressed as inclusion bodies in Escherichia coli and purified to yield a solution of the unfolded protein in 6 M urea. NMR samples were obtained using a previously established microscale protocol that yields 1 mM solutions of [2H,15N]-labeled OmpX reconstituted in Fos-10 micelles in buffer A.4
NMR Spectroscopy
All NMR experiments were recorded at 25 °C on a Bruker DRX-700 spectrometer equipped with a 1.7 mm TXI microprobe (Bruker, Billerica, MA). One-dimensional (1D) 1H NMR spectra were collected with the following parameters: data size = 16 K complex points, acquisition time = 1.38 s; number of scans = 128; sweep width = 11900 Hz. All NMR data were processed with the software TOPSPIN 1.3 (Bruker).
Translational diffusion coefficients for Fos-10 micelles at variable solution conditions were measured using the 1H PFG-STE NMR experiment.5,6 For each dataset a series of 16 diffusion-weighted 1D 1H PFG-STE spectra were recorded in a two-dimensional manner, using a pair of gradient pulses of duration δ = 4.5 ms that were separated by a delay of Δ = 50 ms, with gradient strengths, GD, ranging from 3 to 55 Gcm–1. Translational diffusion coefficients, Dt, for particles in solution were determined using the expression (1) for the signal attenuation, ΨQ, in PFG-STE NMR experiments,7
| (1) |
with Q = (γsGDδ)2, where γ is the proton gyromagnetic ratio and s describes the shape of the diffusion gradient, and Tdiff = Δ–δ / 3. All NMR spectra were recorded at 25 °C. GD was calibrated with the residual 1H signal in 99.9 % D2O by use of a self-diffusion coefficient for HDO at 25 °C of (1.902 ± 0.002) × 10−9 m2s−1.8
Analysis of the PFG-STE NMR experiments with Fos-10 solutions
Assuming fast exchange of detergent monomers between the pools of Fos-10 monomers (m) and Fos-10 micelles (em) present at detergent concentrations above about 2 × c.m.c, i.e., τem/Tdiff ≪1, where τem is the mean lifetime of Fos-10 monomers in the micelles, we derived the expression (2) to describe the weighted average represented by the apparent diffusion constant, , measured by observation of Fos-10 NMR signals.9,10
| (2) |
where [Fos-10] is the total Fos-10 concentration in mM units with respect to monomers, c.m.c. the critical micelle concentration in mM, and Θ(x) the Heaviside step function with Θ(x) = 0 for x < 0 and Θ(x) = 1 for x ≥ 0.
Due to obstruction caused by the increasing density of solute particles in the solution, Dt,m and Dt,em are concentration-dependent, as given by Eqs.(3) and (4),11-13
| (3) |
and
| (4) |
and are the diffusion coefficients at infinite dilution of Fos-10 monomers and Fos-10 micelles, respectively, φ is the volume fraction of the micelles, and kem is the slope of plots of Dt versus the detergent concentration.12,14 φ is given by Eq. (5),14
| (5) |
where Vm = 0.494 nm3 is the volume of a Fos-10 monomer15 and NA is the Avogadro constant.
For spherical non-interacting particles, the Stokes–Einstein relationship describes the dependence of on the solution viscosity, η, and on the hydrodynamic radius of the particle of interest, Rh,
| (6) |
where kB is the Boltzmann constant and T the absolute temperature. To eliminate the dependence on η, we determined the “relative diffusivity” for Fos-10 micelles, dem, as3,16,17
| (7) |
where is a reference diffusion coefficient for a particle of known size at infinite dilution. The aggregation number, Na,em, for Fos-10 micelles can then be determined as
| (8) |
where Vref is the volume of the reference compound.
Results and Discussion
Selective incorporation of 10-bromodecan-1-ol into Fos-10 micelles
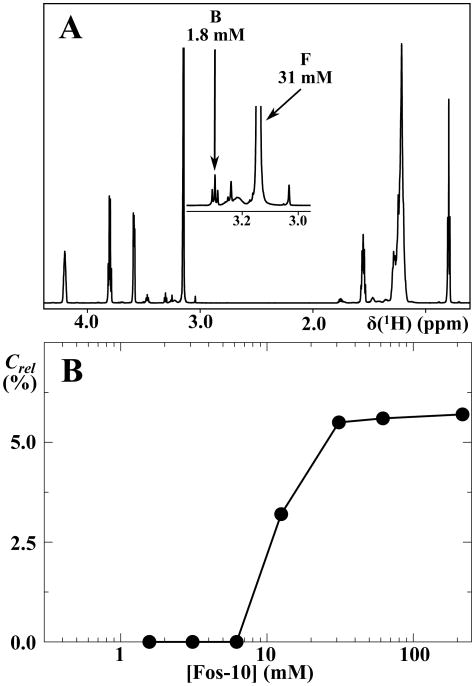
Decanol is insoluble in water but has a high affinity for binding to detergent micelles, and on this basis it was used as a 14C-labeled tracer molecule for the determination of the diffusion coefficient of micellar systems using the capillary method.18 Because the 1H NMR signals of decanol and the presently used detergent Fos-10 overlap, we used 10-bromodecan-1-ol as a NMR probe, since the bromomethylene group signal at 3.30 ppm does not show overlap with any of the Fos-10 resonance lines (Figure 2A).
Figure 2.
The compound 10-bromodecan-1-ol binds to Fos-10 micelles in aqueous solution but is not solubilized by Fos-10 monomers. (A) 1D 1H NMR spectrum (700 MHz, 1.7 mm microprobe) of a 31 mM solution of Fos-10 containing 1.8 mM 10-bromodecan-1-ol, where an insert shows the spectral region 2.9 –3.4 ppm on an enlarged scale. The triplet resonance at 3.30 ppm (B) and the singlet resonance at 3.15 ppm (F) correspond to the bromoethylene group of 10-bromodecan-1-ol and the trimethylamino group of Fos-10, respectively. These NMR signals were used to monitor the ratio of the molar concentrations of 10-bromodecan-1-ol and Fos-10, Crel, which was evaluated from the integrals over the NMR signals B and F. (B) Dependence of Crel on the Fos-10 concentration in the NMR sample, [Fos-10] (logarithmic scale). The filled circles are individual Crel measurements, and the lines connecting the circles are drawn to guide the eye.
The suitability of 10-bromodecan-1-ol as a specific probe for the study of Fos-10 micelles relies on its specific affinity for binding to the micelles and absence of binding to the detergent monomers. 1D 1H NMR spectra of Fos-10 micelles doped with 10-bromodecan-1-ol were used to determine the 10-bromodecan-1-ol: Fos-10 ratio, Crel, by comparing the signal intensities of the 10-bromodecan-1-ol bromomethylene group and the Fos-10 trimethylamino group (B and F in Figure 2A). After centrifugation to remove insoluble material, no NMR signal of 10-bromodecan-1-ol was detected in solutions containing Fos-10 concentrations below 10 mM, whereas for Fos-10 concentrations above 30 mM, Crel was approximately 6 % (Figure 2B). These results show that 10-bromodecan-1-ol binds exclusively at high detergent concentrations, where Fos-10 micelles are present. The 1H NMR signal of 10-bromodecan-1-ol can thus be used to measure the effective translational diffusion coefficient of Fos-10 micelles by 1H PFG-STE NMR experiments.
C.m.c. for Fos-10 in the NMR samples determined using translational diffusion measurements by NMR
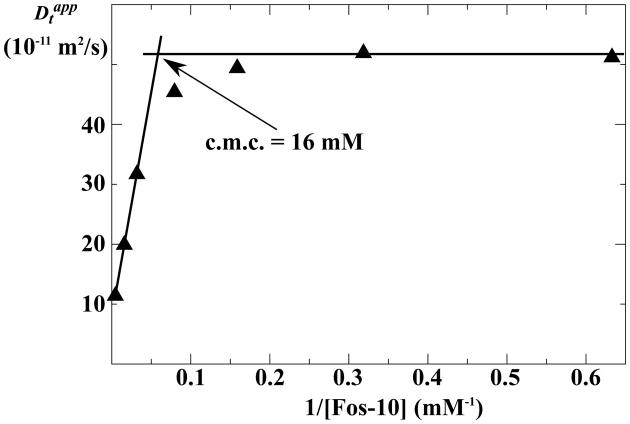
Considering that previous studies have demonstrated that experimentally determined c.m.c. values may vary depending on the sample conditions,19,20 it was of interest to determine the c.m.c. of Fos-10 directly in the solutions used for the NMR experiments. A basis for c.m.c. measurements is provided by Eq. (2), which shows for Fos-10 concentrations below the c.m.c. that the measured diffusion coefficients, , are equal to Dt,m, whereas for Fos-10 concentrations above the c.m.c., is the population-weighted average of Dt,m and Dt,em, and depends in a linear fashion on the reciprocal of the detergent concentration in the range where obstruction effects are small.21,22 Plots of versus the reciprocal of [Fos-10] above and below the c.m.c. can thus to a good approximation be described by straight lines, and the point of intersection of these two lines is the c.m.c.. The c.m.c. for Fos-10 under the NMR sample conditions described in the Materials and Methods section was thus found to be 16 mM (Figure 3). It is worth noting (Figure 3) that for Fos-10 concentrations close to the c.m.c., the experimental values are smaller than expected from the assumption that all Fos-10 molecules are either monomeric or part of uniformly sized micelles (see Materials and Methods). The deviation of the experimental values from those predicted on the basis of this assumption is indicative of the formation of pre-micelles.9,21,23 The data in Figure 3 could thus be rationalized by an extension of the scheme in Figure 1 for detergent concentrations at and near to the c.m.c.. Over an approximately four-fold range centered about the c.m.c., Fos-10 monomers would associate also into smaller aggregates than the micelles that are homogeneously present at higher detergent concentrations. These “pre-micelles” then grow to full-size micelles with further increasing detergent concentration, so that one has again a linear relationship between and [Fos-10]−1 at Fos-10 concentrations larger than about 30 mM.
Figure 3.
Determination of the Fos-10 critical micelle concentration (c.m.c.) in NMR samples using NMR diffusion measurements. Apparent translational diffusion coefficients, , determined by observation of Fos-10 1H-NMR signals, are plotted versus the inverse of the detergent concentration, 1/[Fos-10] (see text). The filled triangles represent experimental measurements. The horizontal line indicates for samples with [Fos-10] < 5 mM, i.e., at concentrations clearly below the c.m.c., and the line on the left represents a fit of Eq. (4) to the data points measured for [Fos-10] > 30 mM, i.e., at concentrations of twice the c.m.c. and above. The intersection of the two lines representing the two limiting regimes (arrow) represents the effective Fos-10 c.m.c. in the NMR sample.
Effective translational diffusion coefficients for Fos-10 micelles doped with 10-bromodecan-1-ol
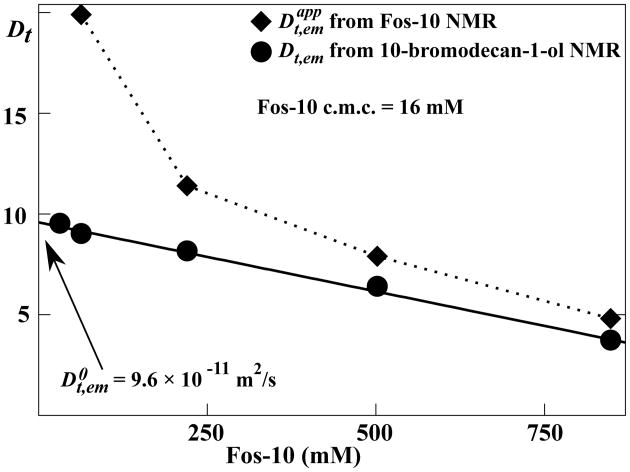
Since 10-bromodecan-1-ol is only soluble in the presence of Fos-10 aggregates, the well-resolved bromomethylene 1H NMR signal of 10-bromodecan-1-ol can be used to determine Dt,em of Fos-10 micelles at Fos-10 concentrations above the c.m.c. (see Figure 3). Here we introduce the notation for the apparent diffusion coefficients measured with NMR observation of detergent signals at concentrations above the c.m.c. (see Eq. (2); a similar notation, , is used below for solutions of OmpX and Fos-10). Comparison of Dt,em with the corresponding values then demonstrates that rapid translational diffusion of the Fos-10 monomers makes a sizeable contribution to (Figure 4).
Figure 4.
NMR measurements of translational diffusion of Fos-10 micelles containing 10-bromodecan-1-ol. Filled diamonds and circles represent diffusion coefficients measured using the PFG-STE NMR experiment with observation of Fos-10 NMR signals, or 10-bromodecan-1-ol NMR signals, respectively, i.e., and Dt, em. Data are shown for variable Fos-10 concentrations above twice the c.m.c.. The solid line represents a linear regression to the experimental data derived from the 10-bromodecan-1-ol NMR signal, with extrapolation to the translational diffusion coefficient at infinite dilution, . The dotted line connects the diamonds to guide the eye.
As predicted from Eq. (3), Dt,em depends linearly on the detergent concentration (Figure 3), and the parameters kem and were determined to be 2.9 ± 0.2 and 9.6 ± 0.1 × 10⁻¹¹ m2/s, respectively. Since obeys the Stokes–Einstein equation, the aggregation number Na,em can be determined using an appropriate reference compound (Eq. (7)). We selected OmpX-containing Fos10 micelles as a reference, since their diffusion coefficient at infinite dilution, , and their volume, Vref, have previously been determined under identical sample conditions.1 The resulting aggregation number for the Fos-10 micelles of 55 ± 8 is close to literature values measured with different techniques, which are in the range between 45 and 53.15
Binding of OmpX lowers the Fos-10 monomer concentration under NMR sample conditions
In Table 1, parameters characterizing Fos-10 monomers, Fos-10 micelles and OmpX-containing Fos-10 micelles have been collected from the present work and from the literature.1,15 Based on this data, the apparent diffusion coefficients measured in aqueous solutions of Fos-10 and OmpX, , (Figure 3) have been analyzed for the situation at detergent concentrations above (Na,pm[OmpX] + c.m.c.) (Figure 1), assuming fast exchange of Fos-10 monomers among the three pools of particles:
Table 1.
Translational diffusion coefficients, particle volumes, V, and aggregation numbers, Na, for Fos-10 monomers, Fos-10 micelles and OmpX-containing Fos-10 micelles.
| (9) |
The use of the fast-exchange approximation for was based on the observation that only a single set of narrow Fos-10 NMR signals was observed (Figure 2A), and is further justified in the Appendix. The total concentration of Fos-10, [Fos-10], was determined by 1D 1H NMR spectroscopy as described previously,1 [pm] was determined using the relation (10),
| (10) |
where the OmpX concentration was determined by UV spectroscopy1, and [em] was determined as ([Fos-10] - [pm] - [m]), where all the concentrations are calculated in Fos-10 monomers.
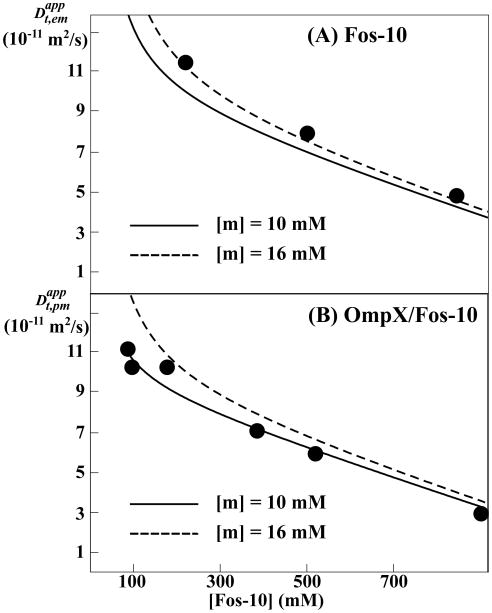
A comparison of experimental values measured in Fos-10 solutions with model calculations using [m] = 16 mM, which corresponds to the effective c.m.c. of Fos-10 micelles (Figure 3), shows close agreement (Figure 5A), thus validating the approach of Eq. (9) and the assumption of rapid exchange. In contrast, corresponding calculations with [m] = 16 mM systematically overestimated the diffusion coefficients for OmpX-containing Fos-10 micelles (Figure 5B). Variation of the input parameters within their experimental error ranges (Table 1) had a minimal impact on the resulting values. However, variation of [m] between 5 and 20 mM resulted in significant effects on the calculated diffusion coefficients, with the best agreement with the experimental data obtained for [m] = 10 mM (Figure 5B). The results presented in Figure 5 thus show that the presence of OmpX reduces the effective c.m.c. of Fos-10 by about 30%, from 16 mM to 10 mM.
Figure 5.
Translational diffusion of Fos-10 micelles (Fos-10) and OmpX-containing Fos-10 micelles (OmpX/Fos-10) in aqueous solution containing detergent concentrations above (Na,pm[IMP] + c.m.c.). The data was aquired using the PFG-STE NMR experiment with observation of Fos-10 1H NMR signals. The circles represent measured apparent translational diffusion coefficients for the Fos-10 micelles, , (A) and the OmpX-containing Fos-10 micelles (B) (see text). The solid and broken lines represent model calculations for the situations with [m] = 10 mM and [m] = 16 mM, respectively, where [m] is the concentration of Fos-10 monomers as determined by the effective c.m.c. value in the NMR sample. The system was modeled with the assumption that the exchange between detergent monomers, detergent micelles and OmpX-containing detergent micelles (Figure 1) is fast.
Conclusions and Outlook
The present investigation with the use of 1H PFG-STE NMR spectroscopy showed that a quantitative characterization of the composition of OmpX-containing Fos-10 solutions at detergent concentrations above (Na,pm[OmpX] + c.m.c.) can be obtained with the assumption that these solutions contain a mixture of Fos-10 monomers, uniform Fos-10 micelles and uniform OmpX-containing Fos-10 micelles, with monomeric detergent molecules in fast exchange between these three different pools (Figure 1). This finding expands on earlier observations1 that increased viscosity due to the formation of empty Fos-10 micelles in OmpX/Fos-10 solutions at high detergent concentrations causes deterioration of the protein NMR signals. Comparison of experimental and values with the results of model calculations based on Eq. (9) further showed that the presence of OmpX reduces the Fos-10 monomer concentration in the detergent sample from 16 mM to 10 mM, indicating that Fos-10 forms preferentially OmpX-containing micelles and that “empty” Fos-10 micelles are formed only by excess detergent, resulting in the aforementioned increased viscosity at high Fos-10 concentrations.
With regard to future practice of selecting detergents and solution conditions for structural studies of integral membrane proteins, these observations with the OmpX–Fos-10 system may contribute to developing more focused approaches: (i) There is now a rationale for the observation that high-quality IMP NMR spectra are obtained only over a narrow range of detergent concentrations: At one end, at Fos-10 concentrations higher than about Na,pm [IMP] there is increased viscosity arising from high population of empty detergent micelles, and at the other end, at detergent concentrations lower than what corresponds to the stoichiometry of the mixed micelles, the amount of detergent is too small to support a homogeneous population of OmpX-containing micelles. (ii) The effective c.m.c. for a given detergent can be significantly lowered by the presence of an IMP, which should be carefully considered when choosing “optimal” detergent concentrations. Although these considerations apply directly to obtaining high-quality IMP NMR spectra in solution, it seems likely that solution conditions similar to those optimized for NMR experiments would favor crystallization into well-ordered, diffracting crystals. It will be interesting to see to what extent the indications from the present work for the preparation of high-quality membrane protein solutions in structural biology will be generally applicable. To this end, corresponding data will need to be collected for other combinations of membrane proteins and detergents. It is to be hoped that guidelines will thus emerge which can be applied at least to sub-classes of membrane proteins, if not to integral membrane proteins at large.
Figure 6.
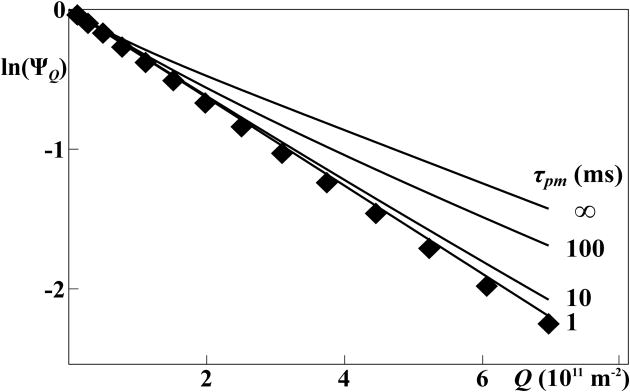
Signal decays in PFG-STE NMR experiments5,6 with an aqueous solution containing 110 mM Fos-10 and 1 mM OmpX. The diamonds represent experimental measurements collected with a pair of gradient pulses of duration δ = 4.5 ms that were separated by a delay of Δ = 50 ms. The solid lines represent computational simulations for variable life times of Fos-10 monomers in the micelles, using Eqs. (14) and (15) with the assumption that the free micelle concentrations, [m], was 10 mM. All simulations were performed with the mathematics software system Sage (www.sagemath.org), using a previously described diagonalization scheme.25,26
Acknowledgments
We thank George J. Lu for help with the preparation of the Fos-10/10-bromodecan-1-ol samples. This work was supported by the Joint Center for Innovative Membrane Protein Technologies (JCIMPT; NIH roadmap initiative Grant P50GM073197 for technology development). K.W. is the Cecil H. and Ida M. Green Professor of Structural Biology at The Scripps Research Institute.
Appendix.
Numerical Simulations of The Effects of Exchange of Fos-10 Monomers Between The Pools of Fos-10 Monomers, Fos-10 Micelles and OmpX-Containing Fos-10 Micelles on 1H PFG-STE NMR Experiments
The NMR experiments of Figures 2 to 5 present evidence for rapid exchange of Fos-10 monomers between the pools of Fos-10 monomers, Fos-10 micelles and OmpX-containing Fos-10 micelles because only a single set of Fos-10 NMR signals is observed. Here, numerical simulations of different exchange regimes present additional, independent evidence that the Fos-10 exchange in the presently studied solutions is indeed very rapid.
To describe the impact of exchange on the signals in 1H PFG-STE NMR experiments, we applied the theoretical treatment of PFG-NMR experiments with heterogeneous systems by Kärger24 to the situation in OmpX solutions at detergent concentrations above (Na,pm[OmpX] + c.m.c.) (Figure 1). We denote the contribution from detergents in the ith site to the signal attenuation, ΨQ, as yi. In the absence of exchange, yi is given by Eq. (11),
| (11) |
where i runs over m, em and pm, and [i] represents the concentrations of the different species (Figure 1). ΨQ is then given by the sum of the individual components yi, which can be written as the scalar product of two vectors,
| (12) |
with e = (1, 1, 1) and y = (ym, yem, ypm). Eqs. (11) and (12) show that the signal attenuation in a non-exchanging mixture of monomeric detergent, detergent micelles and IMP-containing detergent micelles can be described by a tri-exponential decay if the three pools of species have identical detergent NMR chemical shifts. In the case of exchange between the three pools, Kärger has shown that the signal attenuation for Tdiff » δ can be described by a coupled linear differential equation,24
| (13) |
where the matrix LQ is given by
| (14) |
In Eq. (14), τm, τem and τpm are the mean lifetimes for a detergent monomer in the pools of monomers, detergent micelles and IMP-containing detergent micelles, respectively. According to Eq. (12), ΨQ is then given by,
| (15) |
where y0 =([m],[em],[pm])/[Fos-10]. In terms of the independent variable Q, the dependence of the signal attenuation on the detergent exchange is complex, since Eq. (15) does not represent a simple superposition of three exponentials. Although solutions of Eq. (15) can, in principle, be determined in closed form,24 we found it more convenient to perform the calculation numerically.
Comparison of experimental and simulated ΨQ data for a solution containing 1 mM OmpX and 110 mM Fos-10 shows that while a plot of the experimental ln(ΨQ) values versus Q is linear, all simulations for τpm values ≥ 10 ms show deviations from linearity. In contrast, the simulation with τpm = 1 ms matches well with the experiment, thus establishing an upper limit for the mean lifetime of Fos-10 molecules in Fos-10 micelles and OmpX-containing Fos-10 micelles of about 1 ms. Since the experimental data set was acquired at [OmpX] = 1 mM and a Fos-10 concentration of about 110 mM, the Fos-10 is present primarily in OmpX-containing micelles and as monomers ([m] = 10 mM; [pm] = Na.pm[OmpX] = 100 mM). Interestingly, satisfactory agreement with the experiment is achieved by involving exclusively fast exchange of monomers between the three pools of species in Figure 1, so that indirect pathways via collisions between the micellar species appear to make at most negligibly small contributions to the signal attenuation in PFG-NMR experiments.
References
- 1.Stanczak P, Horst R, Serrano P, Wüthrich K. J Am Chem Soc. 2009;131:18450–18456. doi: 10.1021/ja907842u. [DOI] [PMC free article] [PubMed] [Google Scholar]
- 2.Lee D, Hilty C, Wider G, Wüthrich K. J Magn Reson. 2006;178:72–76. doi: 10.1016/j.jmr.2005.08.014. [DOI] [PubMed] [Google Scholar]
- 3.Horst R, Horwich AL, Wüthrich K. J Am Chem Soc. 2011;133:16354–16357. doi: 10.1021/ja206531c. [DOI] [PMC free article] [PubMed] [Google Scholar]
- 4.Zhang QH, Horst R, Geralt M, Ma XQ, Hong WX, Finn MG, Stevens RC, Wüthrich K. J Am Chem Soc. 2008;130:7357–7363. doi: 10.1021/ja077863d. [DOI] [PMC free article] [PubMed] [Google Scholar]
- 5.Gibbs SJ, Johnson CS. J Magn Reson. 1991;93:395–402. [Google Scholar]
- 6.Altieri AS, Hinton DP, Byrd RA. J Am Chem Soc. 1995;117:7566–7567. [Google Scholar]
- 7.Tanner JE. J Chem Phys. 1970;52:2523–2526. [Google Scholar]
- 8.Mills R. J Phys Chem. 1973;77:685–688. [Google Scholar]
- 9.Lindman B, Brun B. J Colloid Interface Sci. 1973;42:388–399. [Google Scholar]
- 10.Kamenka N, Lindman B, Brun B. Colloid Polym Sci. 1974;252:144–152. [Google Scholar]
- 11.Johannesson H, Halle B. J Chem Phys. 1996;104:6807–6817. [Google Scholar]
- 12.Chou JJ, Baber JL, Bax A. J Biomol NMR. 2004;29:299–308. doi: 10.1023/B:JNMR.0000032560.43738.6a. [DOI] [PubMed] [Google Scholar]
- 13.Piazza R, Degiorgio V, Corti M, Stavans J. Physical Review B. 1990;42:4885–4888. doi: 10.1103/physrevb.42.4885. [DOI] [PubMed] [Google Scholar]
- 14.Molinier V, Fenet B, Fitremann J, Bouchu A, Queneau Y. J Colloid Interface Sci. 2005;286:360–368. doi: 10.1016/j.jcis.2004.12.010. [DOI] [PubMed] [Google Scholar]
- 15.Lipfert J, Columbus L, Chu VB, Lesley SA, Doniach S. J Phys Chem B. 2007;111:12427–12438. doi: 10.1021/jp073016l. [DOI] [PubMed] [Google Scholar]
- 16.Chen AD, Wu DH, Johnson CS. J Phys Chem. 1995;99:828–834. [Google Scholar]
- 17.Crutchfield CA, Harris DJ. J Magn Reson. 2007;185:179–182. doi: 10.1016/j.jmr.2006.12.004. [DOI] [PubMed] [Google Scholar]
- 18.Lindman B, Puyal MC, Kamenka N, Brun B, Gunnarsson G. J Phys Chem. 1982;86:1702–1711. [Google Scholar]
- 19.Dominguez A, Fernandez A, Gonzalez N, Iglesias E, Montenegro L. J Chem Educ. 1997;74:1227–1231. [Google Scholar]
- 20.Chattopadhyay A, Harikumar KG. FEBS Lett. 1996;391:199–202. doi: 10.1016/0014-5793(96)00733-8. [DOI] [PubMed] [Google Scholar]
- 21.Cui XH, Mao SZ, Liu ML, Yuan HZ, Du YR. Langmuir. 2008;24:10771–10775. doi: 10.1021/la801705y. [DOI] [PubMed] [Google Scholar]
- 22.Furo I. J Mol Liq. 2005;117:117–137. [Google Scholar]
- 23.Amato ME, Caponetti E, Martino DC, Pedone L. J Phys Chem B. 2003;107:10048–10056. [Google Scholar]
- 24.Kärger J. Adv Colloid Interface Sci. 1985;23:129–148. [Google Scholar]
- 25.Horst R, Wider G, Fiaux J, Bertelsen EB, Horwich AL, Wüthrich K. Proc Natl Acad Sci U S A. 2006;103:15445–15450. doi: 10.1073/pnas.0607141103. [DOI] [PMC free article] [PubMed] [Google Scholar]
- 26.Andrec M, Prestegard JH. J Biomol NMR. 1997;9:136–150. doi: 10.1023/a:1018650119152. [DOI] [PubMed] [Google Scholar]


