

Abstract
Background
While many studies use gait symmetry as a marker of healthy gait, the evidence that gait symmetry exists is limited. Because gait symmetry is thought to arise through laterality (i.e., limb preference) and affects gait retraining efforts, it is important to understand if symmetry exists during gait in older adults. Therefore, the purpose of this study was to evaluate foot and gait symmetry in the population-based Framingham Foot Study as well as to determine the effects of vertical force symmetry on physical performance measures.
Methods
Members of the Framingham Foot Study were included in this analysis (N=1333). Foot function and force data were collected using the Tekscan Matscan during self-selected gait, with symmetry evaluated using the symmetry index. The short physical performance battery (SPPB) measures of balance, chair stands and gait speed assessed lower extremity physical function. Participants were evaluated using quartiles of gait speed and foot symmetry to determine the effects of symmetry on lower extremity physical function.
Results
Individuals with faster gait speed displayed greater foot function asymmetry; individuals with −3.0% to −9.5% asymmetry in foot function performed better on the short physical performance battery (SPPB). Further, with aging, the degree of asymmetry was reduced.
Conclusions
While this research suggests that a moderate degree of foot asymmetry is associated with better lower extremity function, the causes of vertical force asymmetry are unknown. Future studies should evaluate the causes of foot asymmetry and should track the changes in symmetry that occur with aging.
Keywords: foot function, functional asymmetry, physical performance, lower extremity
1. Introduction
Gait symmetry has often been used as a measure of gait health, with lower limb symmetry assumed to be characteristic of healthy gait. The scientific literature, however, shows inconsistent findings regarding the extent to which gait symmetry exists in healthy populations (for review [1]). The discrepancies between results reported in the literature may be related to how symmetry was determined.
Gait symmetry is often evaluated using the symmetry index (SI) equation. The SI indicates the percent deviation from perfect symmetry (e.g., 0 represents perfectly symmetrical gait) [2]. Mathematically, SI is:
| (eq. 1) |
with ‘X’ being the gait parameter of interest, such as loading force. While clinical studies using the SI use “X1” to refer to the unaffected or healthy side and “X2” to refer to the affected side, there is no common convention for defining which limb is “1” and “2” in healthy populations.
The lack of consistency in using the SI affects gait symmetry conclusions [1, 3]. Some researchers have used “1” for the right limb and “2” for the left (e.g., [4]), while others have randomly assigned which limb is “1” and “2” (e.g., [5]), and have concluded healthy gait is symmetrical. Other researchers have suggested the subscript “1” should be the dominant leg (e.g., limb used to kick a soccer ball) [6] or the peak propulsive limb [7], leading to the conclusion that a degree of functional asymmetry is characteristic of healthy gait. Nonetheless, as the SI has not been applied uniformly, it is unclear if healthy gait is associated with gait symmetry or asymmetry [1, 3].
The assumption for gait symmetry resides in the continuous nature of walking that each limb undergoes a swing and stance phase, whereas the theory behind functional gait asymmetry is based on the idea that each leg is tuned to a specific gait task during the stance phase. Sadeghi et al. [8] noted that one limb was more responsible for forward propulsion, whereas the other limb provided support and stability during normal walking. This conclusion was similar to prior research that noted the left limb was responsible for medio-lateral balance [9] and support [10–11] during gait, while the right leg provided more forward propulsion in young adults.
Taken together, these studies suggest that laterality (limb preference to a particular task) exists in the lower extremities [8–11]. However, notably absent from these studies is the degree to which asymmetry exists in healthy populations. Further, most gait symmetry studies base their conclusions on a convenience sample of young adults, which may not generalize to older adults, who are more likely to need gait retraining as a result of a stroke or joint injury. Because aging affects many neuromuscular structures and functions and because laterality affects the duration of gait retraining [12–13], it is imperative to understand the extent to which symmetry exists during gait as well as to quantify the level of asymmetry that is characteristic of healthy gait in older adults. Therefore, the purpose of this paper was to evaluate vertical force symmetry during gait and to determine its effects on lower extremity physical function in older adults. As young, healthy adults exhibit gait asymmetry [8–11], our hypothesis is that older adults who display functional asymmetry during gait will perform better in the lower extremity physical function measures.
2. Methods
2.1 Participants
Study participants included in this analysis are from the Framingham Foot Study. The Framingham Foot Study members are compiled from large, population-based samples of residents from Framingham, Massachusetts, USA. These participants are drawn from the Framingham Heart Study Original Cohort, which was started in 1948 [14], the Framingham Offspring cohort, which started in 1971 [15], and community members over 50 years of age recruited between 2002–2005 through random digit dialling from town lists [16]. Between 2002 and 2008 Framingham Foot Study participants received a validated foot exam to assess presence or absence of foot pain and foot disorders as well as a set of plantar pressure measurements while standing and walking. Other data included a medical history, lower extremity physical performance assessment, participant demographics and other self-reported data collected via questionnaires. The Framingham Foot Study was approved by the Hebrew SeniorLife institutional review board, and all participants signed an informed consent prior to enrollment.
Inclusion criteria for this study included Framingham Foot Study participants with valid plantar pressure data and completed lower extremity physical function from the short physical performance battery (SPPB); Framingham Offspring had to have a recorded leg length difference of less than 0.5 inch (approximately 1.3cm) or less [17]. We also evaluated a subset of Framingham Foot Study population (“Low Burden Group”) to determine if outcomes differed in individuals who were free from lower extremity (hips, knees and feet) pain or unilateral foot disorders. Participants in the Low Burden Group were free from seven foot conditions: hallux valgus, plantar fasciitis, hammer toes, claw toes, fat pad atrophy (heel or forefoot), Morton’s neuroma, or hallux rigidus, which were noted as present or absent by a podiatric physician-trained evaluator (kappas > 0.85, all P < 0.01) [18]. The purpose of creating this subset population was to reduce the effects of gait differences that may result as individuals compensate for these conditions.
Pain was assessed by the response to the NHANES-type question “On most days do you have pain, aching or stiffness in [your lower extremities]?” The Low Burden Group was free from pain at the hips, knees, and feet.
2.2 Foot Function Data Collection
Foot force and gait kinetic variables were collected using a Matscan system (Tekscan Inc., Boston MA) collected at a rate of 40 frames per second. The participants were asked to walk barefoot at a self-selected pace across the mat, using the two-step method [19]. The two-step method involves participants stepping on the pressure map on the second step and has been shown to as reliable as a step using the mid-gait approach [19]. There were two gait trials, one for each foot.
Data was extracted from the Matscan into a custom Matlab program (MathWorks, Natick, MA) in order to determine the regional forces within the foot. The foot was divided into four regions: toes, forefoot, arch, and rearfoot [20]. This entails the foot area, not including the toes, being divided into thirds along the foot’s longitudinal axis to yield the rearfoot, midfoot and forefoot regions. Peak forces were measured within these four regions and forefoot-to-rearfoot (FFRF) force ratios were used as they are indicative of foot function [21–22].
To calculate the vertical force symmetry, we used the symmetry index (SI; eq. 1). To address the common assumption that the right leg is the dominant leg, which may obscure some of the functional properties of the lower limbs [1], we used a functional definition when substituting our parameters of interest into the SI equation. For our analysis, the subscript “1” was defined as the limb generating the greater peak vertical propulsive force during gait [7, 11, 23]. Our parameters of interest were the peak forces in the four foot regions as well as the FFRF force ratio. We used the FFRF ratio as the main symmetry outcome when addressing the effects of foot symmetry on physical performance measures as it is a composite measure addressing foot function, and it shows the relative contribution of the forefoot (unloading) with respect to the rearfoot (loading) [21–22].
2.3 Physical Performance Measures
Physical performance was measured using the Short Physical Performance Battery (SPPB), a battery of lower extremity physical performance measures [24]. The SPPB includes (Figure 1): static balance (side-by-side, semi-tandem and full tandem balance for up to 10 seconds each), gait speed (timed 4-meter walk at a self-selected pace), and chair stand (ability and time needed to stand five times as quickly as possible with arms folded across the chest from a straight-backed chair) [25]. These measures have a high test-retest reliability (r >0.9) [26].
Figure 1.
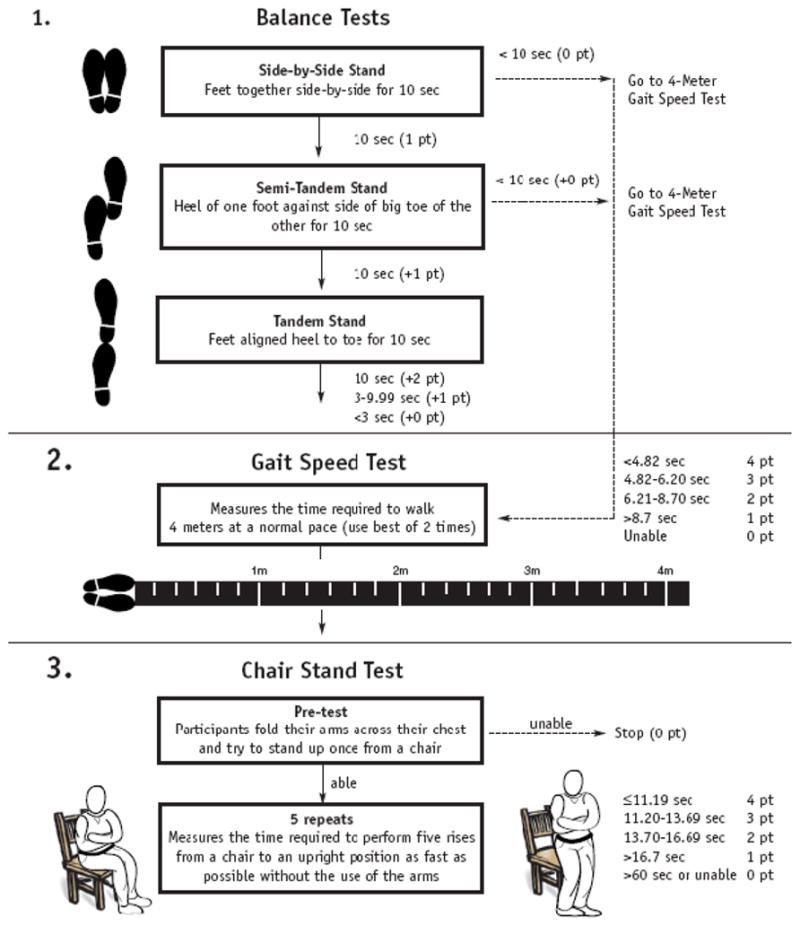
Short physical performance battery (SPPB) flowchart [23].
The SPPB performance measures are predictive of falls [27], disability [24, 28], and poor outcomes over 1–6 years (e.g., disability onset, hospitalizations and death) in studies of older adults [24, 27–28]. The individual component contributes up to 4 points in the overall score, so the SPPB scores range from 0 to 12, with higher scores reflecting better lower extremity physical function.
2.4 Data Analysis
Because the purpose of this study was to evaluate foot symmetry during walking and to determine the effect of foot symmetry on physical performance, we analyzed the data to evaluate the degree of foot force symmetry and to determine the effects of foot symmetry on physical performance. First, because research in young adults suggests that asymmetry was related to gait velocity, we assessed foot symmetry by quartiles of gait speed (using distance [4m] divided by time) using a multivariate generalized linear model. In this analysis, we combined the participants within the middle 50% of gait speed categories, leaving three gait speed groups: 1) fast: highest 25%, 2) slow: lowest 25%, and 3) moderate: middle 50% (referent). Participants were also evaluated by age group: less than 60 years, 60–74 years, 75–89 years, 90 years and older to determine if there were differences by age group.
In the second analysis that examined the effects of foot symmetry on lower extremity physical function, we evaluated the individual SPPB measures (i.e., three measures of balance, gait velocity and chair stand) as well as the overall SPPB score by quartiles of forefoot-to-rearfoot ratio symmetry values.
To control for multiple comparisons, we used Fisher’s least significant difference (LSD) procedure in post hoc testing. We tested data normality using graphical analysis and Shapiro-Wilk statistics, and the statistical significance was set to p <0.05.
Because a single walking trial is not as reliable as multiple assessments [29], we evaluated the power of our study. Using a conservative reliability of 0.5 [30] of the Tekscan measurement system to calculate the forefoot-to-rearfoot force ratios and with power at 80% and an alpha at 0.05, the projected total sample size was 220 participants.
3. Results
There were 1333 participants included in the Framingham Foot Group, with 929 free from lower extremity pain and unilateral foot disorders included in the Low Burden Group subset (Table 1; Figure 2). The lower extremity limb generating the peak vertical propulsive force was the right leg in 77% (N=1026) of the Framingham Foot Group and 74% (N=689) of the Low Burden group.
Table 1.
Demographics information of the included Framingham Foot Study (FFS) participants and the subset “Low Burden Group”, which was free from lower extremity pain and unilateral foot disorders. Data reported as mean ± standard deviation, unless otherwise noted.
| FFS Population (N=1333) | Low Burden Group (N=929) | |
|---|---|---|
| Age, years (range) | 66.4 ± 10.6 (36–100) | 73.0 ± 10.6 (36–98) |
| Female (%) | 745 (55.9) | 566 (61.0) |
| Height, cm | 166.4 ± 9.9 | 164.8 ± 10.2 |
| Weight, kg | 78.5 ± 17.9 | 69.7 ± 11.2 |
| BMI, kg/m2 (range) | 28.6 ± 4.6 (15.3–58. 5) | 25.7 ± 4.1 (15.5–56. 5) |
Figure 2.

Flowchart of included participants. LE = lower extremity; SPPB = short physical performance battery.
In the Framingham Foot Group, the force production between feet had greater asymmetry at the rearfoot and forefoot with increasing self-selected gait speed, but not at the toes or midfoot (Table 2). The Low Burden Group displayed a similar, significant (p=0.041) pattern of increasing asymmetry with the faster gait speeds. Moreover, when evaluating foot function by gait speed, those who walked the fastest having the greatest (p=0.034) forefoot-to-rearfoot (FFRF) force ratio asymmetry (Figure 3). While this trend of increasing asymmetry of FFRF force ratio with gait speed was not maintained for individuals 90 years and older in the Framingham Foot Group (p=0.445), for all other age groups increasing gait speed was associated with significantly (p<0.05) greater FFRF force ratio asymmetry.
Table 2.
Symmetry of foot regional forces by gait speed quartiles in the two study groups. Data reported as mean ± standard deviation, unless otherwise noted. FFRF = forefoot-to-rearfoot ratio; FFS = Framingham Foot Study; SI = symmetry index.
| FFS Population (N=1333) | Low Burden Group (N=929) | |||||||
|---|---|---|---|---|---|---|---|---|
| Slowest 25% of Gait Speed | Middle 50% of Gait Speed | Fastest 25% of Gait Speed | P value | Slowest 25% of Gait Speed | Middle 50% of Gait Speed | Fastest 25% of Gait Speed | P value | |
| Average Gait Speed, m/s (range) | 0.57 ± 0.16 (0.20–0.73) | 0.81 ± 0.10 (0.73–1.09) | 1.31 ± 0.17 (1.09–1.53) | 0.027 | 0.63 ± 0.28 (0.28–0.79) | 0.95 ± 0.20 (0.79–1.03) | 1.20 ± 0.19 (1.03–1.57) | 0.023 |
| SI at Toes, % | 0.89 ± 0.43 | −1.11 ± 0.62 | −4.33 ± 0.49 | 0.342 | 0.97 ± 0.54 | −1.51 ± 0.62 | −5.13 ± 0.42 | 0.431 |
| SI at Forefoot, % | 0.31 ± 1.01 | 6.21 ± 1.94 | 12.32 ± 1.89 | 0.043 | 0.53 ± 0.91 | 6.02 ± 1.37 | 13.32 ± 1.89 | 0.023 |
| SI at Midfoot, % | 0.22 ± 0.98 | −0.89 ± 0.76 | −1.43 ± 0.65 | 0.797 | 0.02 ± 0.63 | −0.78 ± 0.89 | −1.87 ± 0.45 | 0.689 |
| SI at Rearfoot, % | 0.19 ± 0.35 | −1.45 ± 0.78 | −3.42 ± 0.69 | 0.014 | 0.19 ± 0.65 | −1.98 ± 0.60 | −3.14 ± 0.53 | 0.014 |
| SI of FFRF Ratio, % | 0.20 ± 0.28 | −2.10 ± 1.69 | −6.30 ± 2.16 | 0.006 | −0.16 ± 0. | −2.78 ± 0. | −6.62 ± 0. | 0.002 |
Figure 3.

Forefoot-to-rearfoot (FFRF) ratio of Framingham Foot Group and Low Burden Group by age-group. * significantly different (p<0.05) between individuals aged 90 years and older and other age groups.
When evaluating the FFRF force ratio by quartiles, individuals in the Framingham Foot Group with approximately −3.0 to −9.5% of asymmetry performed significantly better in the SPPB measures than the other quartiles (Table 3). Using these same cut-points from the total population in Low Burden Group, the participants exhibiting FFRF force ratio asymmetry between the −3.0 to −9.5% performed significantly better in the SPPB measures of tandem balance, gait, and chair stands relative to the >3.0% and <−9.5% asymmetry groups. The 3.0 to −3.0% and −3.0 to −9.5% groups had similar overall SPPB scores, with only the chair stand times being significantly (p=0.046) faster in the −3.0 to −9.5% in the Low Burden Group.
Table 3.
Framingham Foot Study (FFS) and Low Burden participants SPPB scores of lower extremity physical performance by quartiles of forefoot-to-rearfoot (FFRF) force ratio during self-selected gait. Quartiles of FFRF were calculated for the total population, and these cut-point were used for the Low Burden group. Data reported as mean ± standard deviation.
| FFRF Symmetry Range (by quartiles) | Degree of Asymmetry | FFS (N=1333) | Side-by-Side Balance (s) | Semi-Tandem Balance (s) | Tandem Balance (s)* | Gait Speed (m/s)* | Chair Stand (s)* | SPPB Score (range: 0–12)* | |
|---|---|---|---|---|---|---|---|---|---|
| FFS | > 3.0% | Extreme | 334 | 9.91 ± 0.43 | 9.65 ± 0.81 | 8.98 ± 0.79 | 0.79 ± 0.31 | 16.00 ± 13.46 | 8.3 ± 2.25 |
| − 3.0% to 3.0% | Slight | 333 | 9.91 ± 0.09 | 9.75 ± 0.61 | 9.15 ± 1.09 | 0.82 ± 0.21 | 11.89 ± 7.21 | 9.4 ± 2.22 | |
| − 9.5% to −3.0% | Moderate | 333 | 10.0 ± 0.00 | 9.91 ± 0.41 | 9.71 ± 0.89 | 1.06 ± 0.17 | 11.69 ± 8.21 | 10.0 ± 2.41 | |
| < −9.5% | Extreme | 333 | 9.98 ± 0.36 | 9.81 ± 0.62 | 9.08 ± 1.02 | 0.82 ± 0.23 | 14.16 ± 13.21 | 9.0 ± 2.75 | |
| p-value | 0.856 | 0.215 | <0.001 | 0.030 | 0.033 | 0.039 | |||
| FFRF Symmetry Range (by quartiles) | Degree of Asymmetry | Low Burden (N=929) | Side-by-Side Balance (s) | Semi-Tandem Balance (s) | Tandem Balance (s) | Gait Speed (m/s)* | Chair Stand (s)* | SPPB Score (range: 0–12)* | |
| Low Burden | > 3.0% | Extreme | 187 | 10.0 ± 0.00 | 9.91 ± 0.69 | 9.60 ± 1.55 | 0.89 ± 0.27 | 15.10 ± 20.11 | 9.1 ± 1.65 |
| − 3.0% to 3.0% | Slight | 209 | 10.0 ± 0.00 | 9.91 ± 0.69 | 9.79 ± 1.52 | 0.99 ± 0.28 | 12.33 ± 8.21 | 10.3 ± 1.87 | |
| − 9.5% to −3.0% | Moderate | 301 | 9.98 ± 0.21 | 9.93 ± 1.13 | 9.88 ± 0.86 | 1.06 ± 0.21 | 11.13 ± 10.36 | 10.8 ± 1.81 | |
| < −9.5% | Extreme | 232 | 9.98 ± 0.20 | 9.85 ± 0.90 | 9.26 ± 1.82 | 0.93 ± 0.29 | 12.68 ± 4.11 | 9.6 ± 2.22 | |
| p-value | 0.75 | 0.75 | 0.111 | 0.042 | 0.043 | 0.047 | |||
significant difference
4. Discussion
The purpose of this study was to evaluate vertical force symmetry during gait in older adults as well as to determine its effects on lower extremity physical performance measures. We found significant differences in foot symmetry by gait speed, with individuals who had a greater self-selected gait speed tending to have a greater foot force asymmetry. Foot force asymmetry was seen predominantly in the forefoot and rearfoot, as well as in foot function assessed by the forefoot-to-rearfoot (FFRF) force ratio. Greater foot symmetry was also associated with lower physical performance. Our results suggest that individuals with 3.0 to −3% or were between −3 to −9.5% of FFRF force asymmetry performed better on the short physical performance battery (SPPB) than those with more extreme asymmetry.
4.1 Foot Asymmetry
Our results suggest that faster gait speeds are associated with a greater degree of asymmetry at the population-level in older adults. Even when removing individuals with lower extremity pain and unilateral foot disorders, the association between faster gait speed and greater foot asymmetry persisted. These results are similar to the research by Seeley et al., who found that within-person asymmetry increases with increases in gait speed [6]. Our study did not evaluate the within-person affects of increasing gait speed; however, we found that individuals with greater self-selected gait speeds had greater foot force asymmetries forefoot and rearfoot regions of the foot as well as in the FFRF force ratio.
When examining quartiles of the FFRF ratio, we noted that asymmetry values between-3.0 to −9.5% was associated with better lower extremity performance measures on the SPPB relative to those with more than 3% or less than −9.5, and marginally better than those who had a FFRF force ratio 3.0% to −3.0%. There are limited studies evaluating limb symmetry and physical performance in older adults. However, studies of younger adults show similar findings to ours in that international level athletes displayed a greater degree of asymmetry hamstring and quadriceps strength relative to the national level athletes [31]. Because SPPB performance can predict health outcomes (disability onset, hospitalizations and death) in older adults populations [24, 27–28], exhibiting and maintaining this asymmetry may be important in healthy aging.
4.2 Implications of Research
Our results suggest that laterality and functional dominance are a natural component in older adult gait as individual with FFRF force ratio symmetry values ranging from −3.0 to −9.5% was associated with better SPPB scores, regardless of lower extremity pain or foot disorders. While the SPPB has been noted as a predictor of poor health outcomes, it is unknown if FFRF asymmetry could also predictive of lower extremity health and function. Moreover, when evaluating symmetry of foot function by aging, we noted that the fastest walkers tended to have less asymmetry relative to the other age groups. Thus, longitudinal research should investigate how foot and gait asymmetry relates to long-term physical function and quality of life.
Further, given the cross-sectional associations of asymmetry in foot function to lower extremity physical function in our research, the mechanisms that affect, promote, or diminish foot asymmetry are unknown. Laterality of the central nervous system (CNS) is thought to arise as a function of the task specificity of the lower extremities during gait (i.e., balance and control versus forward propulsion) that cause differences in neural activation patterns and mapping at the CNS level [32–34]. The CNS laterality corresponds to peripheral nervous system laterality, with the dominant limb displaying a greater number of motoneurons [35]. The greater number of motoneurons in the dominant limb may be related to the greater energy generation needs of the plantar flexors for this limb’s more propulsive force [36].
This difference between functional tasks and subsequent loading responses may also affect bone density between the lower extremities. Research by Beck et al. [37] noted that femoral neck bone mineral density in adults (average age approximately 32 years) was different in dominant and non-dominant limbs, with limb dominance being defined by the Waterloo Footedness Questionnaire [38]. As the Waterloo Footedness Questionnaire is a self-report assessment of foot function, it does not objectively measure differences between functional tasks of gait. Hence, the association self-reported foot function to objective measures of footedness remains in question. However, with no objective measure in footedness, future research should evaluate if the limb’s task-specific tuning during gait is related to bone mineral differences between the lower extremities. Correspondingly, research should objectively evaluate how the limb’s tuning towards a functional task affects injury and risk of foot disorders [39], which may open up preventative measures to address future foot complications and injuries.
4.3 Strengths & Limitations
Though we found specific functional foot asymmetry to be associated with gait and lower extremity physical performance, there are several limitations to this study. First, our analysis was a cross-sectional evaluation of foot symmetry and function, and it thus cannot assess causal relationships. In the future, longitudinal studies of foot function and symmetry are needed to determine how symmetry changes with aging as well to evaluate the mechanism related to loss of foot symmetry. Further, only a single scan of each foot was recorded. As a result, we were unable to determine if the recorded step was an accurate or unbiased representation of the individual’s normal gait. However, the projected total sample size was estimated to be 220 participants based on the forefoot-to-rearfoot symmetry values, which is well below the participant numbers in the smaller Low Burden group (N=929). Therefore, due to the higher sample size of our study, we are confident that the study was adequately powered and that the findings noted are not an artifact of the single scan of each foot.
The strengths of this study include its participants, data collection, and analysis. The Framingham Foot Study is a well-described, population-based cohort of older adults evaluating foot health, foot function, and lower extremity physical function. This range of participant demographics (e.g., men and women, aged 36 to 100 years, BMI range of 15.3 to 58. 5 kg/m2) included in the study provides greater generalizability, relative to the smaller study samples (e.g., N=20) [6]. Further, this study also evaluated foot symmetry based on limb functional dominance. As many studies typically report symmetry between lower limbs between right and left feet, we evaluated symmetry with respect to functional task of the lower limbs, which may provide greater insights into the differences that exist between limbs [8–11].
5. Conclusion
This research suggests that in older adult gait, slight foot asymmetry during gait is associated with better lower extremity physical function. Because the work is cross-sectional, future work should explicitly evaluate differences in muscle activation and limb properties based on the task-specific tuning of the limb.
Acknowledgments
The authors would like to acknowledge Virginia Casey, PhD, MPH and Hylton Menz, PhD for their critical review of this manuscript. Funding for this project was provided by the NIH’s National Institute of Arthritis and Musculoskeletal and Skin Diseases (R01-AR047853) and National Institute of Aging (T32-AG023480).
Footnotes
Conflict of Interest
None
Publisher's Disclaimer: This is a PDF file of an unedited manuscript that has been accepted for publication. As a service to our customers we are providing this early version of the manuscript. The manuscript will undergo copyediting, typesetting, and review of the resulting proof before it is published in its final citable form. Please note that during the production process errors may be discovered which could affect the content, and all legal disclaimers that apply to the journal pertain.
References
- 1.Sadeghi H, et al. Symmetry and limb dominance in able-bodied gait: a review. Gait Posture. 2000;12(1):34–45. doi: 10.1016/s0966-6362(00)00070-9. [DOI] [PubMed] [Google Scholar]
- 2.Robinson RO, Herzog W, Nigg BM. Use of force platform variables to quantify the effects of chiropractic manipulation on gait symmetry. J Manipulative Physiol Ther. 1987;10(4):172–6. [PubMed] [Google Scholar]
- 3.Riskowski JL, et al. International Society of Biomechanics. Brussels, Belgium: 2011. Evaluating foot symmetry during gait in healthy older adults. [Google Scholar]
- 4.Giakas G, et al. Comparison of gait patterns between healthy and scoliotic patients using time and frequency domain analysis of ground reaction forces. Spine (Phila Pa 1976) 1996;21(19):2235–42. doi: 10.1097/00007632-199610010-00011. [DOI] [PubMed] [Google Scholar]
- 5.McCrory JL, White SC, Lifeso RM. Vertical ground reaction forces: objective measures of gait following hip arthroplasty. Gait Posture. 2001;14(2):104–9. doi: 10.1016/s0966-6362(01)00140-0. [DOI] [PubMed] [Google Scholar]
- 6.Seeley MK, Umberger BR, Shapiro R. A test of the functional asymmetry hypothesis in walking. Gait Posture. 2008;28(1):24–8. doi: 10.1016/j.gaitpost.2007.09.006. [DOI] [PubMed] [Google Scholar]
- 7.Potdevin FJ, et al. Using effect size to quantify plantar pressure asymmetry of gait of nondisabled adults and patients with hemiparesis. J Rehabil Res Dev. 2007;44(3):347–54. doi: 10.1682/jrrd.2006.07.0077. [DOI] [PubMed] [Google Scholar]
- 8.Sadeghi H, et al. Lower limb muscle power relationships in bilateral able-bodied gait. Am J Phys Med Rehabil. 2001;80(11):821–30. doi: 10.1097/00002060-200111000-00006. [DOI] [PubMed] [Google Scholar]
- 9.Matsusaka N. Control of the medial-lateral balance in walking. Acta Orthop Scand. 1986;57(6):555–9. doi: 10.3109/17453678609014793. [DOI] [PubMed] [Google Scholar]
- 10.Sadeghi H. Local or global asymmetry in gait of people without impairments. Gait Posture. 2003;17(3):197–204. doi: 10.1016/s0966-6362(02)00089-9. [DOI] [PubMed] [Google Scholar]
- 11.Hirokawa S. Normal gait characteristics under temporal and distance constraints. J Biomed Eng. 1989;11(6):449–56. doi: 10.1016/0141-5425(89)90038-1. [DOI] [PubMed] [Google Scholar]
- 12.Kerstein MD, et al. The delays in the rehabilitation in lower extremity amputees. Conn Med. 1977;41(9):549–51. [PubMed] [Google Scholar]
- 13.Kerstein MD, et al. Successful rehabilitation following amputation of dominant versus nondominant extremities. Am J Occup Ther. 1977;31(5):313–5. [PubMed] [Google Scholar]
- 14.Dawber TR, Meadors GF, Moore FE., Jr Epidemiological approaches to heart disease: the Framingham Study. Am J Public Health Nations Health. 1951;41(3):279–81. doi: 10.2105/ajph.41.3.279. [DOI] [PMC free article] [PubMed] [Google Scholar]
- 15.Feinleib M, et al. The Framingham Offspring Study. Design and preliminary data. Prev Med. 1975;4(4):518–25. doi: 10.1016/0091-7435(75)90037-7. [DOI] [PubMed] [Google Scholar]
- 16.Dufour AB, et al. Foot pain: is current or past shoewear a factor? Arthritis Rheum. 2009;61(10):1352–8. doi: 10.1002/art.24733. [DOI] [PMC free article] [PubMed] [Google Scholar]
- 17.Kaufman KR, Miller LS, Sutherland DH. Gait asymmetry in patients with limb-length inequality. J Pediatr Orthop. 1996;16(2):144–50. doi: 10.1097/00004694-199603000-00002. [DOI] [PubMed] [Google Scholar]
- 18.Hannan MT, et al. Physical limitations and foot disorders in elders. Arthritis Rheum. 1999;42(Suppl 9):S286. [Google Scholar]
- 19.McPoil TG, et al. Variability of plantar pressure data. A comparison of the two-step and midgait methods. J Am Podiatr Med Assoc. 1999;89(10):495–501. doi: 10.7547/87507315-89-10-495. [DOI] [PubMed] [Google Scholar]
- 20.VanZant RS, McPoil TG, Cornwall MW. Symmetry of plantar pressures and vertical forces in healthy subjects during walking. J Am Podiatr Med Assoc. 2001;91(7):337–42. doi: 10.7547/87507315-91-7-337. [DOI] [PubMed] [Google Scholar]
- 21.Ward ED, et al. 1998 William J. Stickel Gold Award. The effects of extrinsic muscle forces on the forefoot-to-rearfoot loading relationship in vitro. Tibia and Achilles tendon. J Am Podiatr Med Assoc. 1998;88(10):471–82. doi: 10.7547/87507315-88-10-471. [DOI] [PubMed] [Google Scholar]
- 22.Barna R. Natural plantar topology and posture: A new standard for anatomical footwear research. Third Symposium on Footwear Biomechanics; 1997; Tokyo Metropolitan University, Tokyo, Japan. [Google Scholar]
- 23.De Witt JK, Hagan RD, Cromwell RL. The effect of increasing inertia upon vertical ground reaction forces and temporal kinematics during locomotion. Journal of Experimental Biology. 2008;211(7):1087–1092. doi: 10.1242/jeb.012443. [DOI] [PubMed] [Google Scholar]
- 24.Guralnik JM, et al. A short physical performance battery assessing lower extremity function: association with self-reported disability and prediction of mortality and nursing home admission. J Gerontol. 1994;49(2):M85–94. doi: 10.1093/geronj/49.2.m85. [DOI] [PubMed] [Google Scholar]
- 25.Guralnik JM, et al. Lower-extremity function in persons over the age of 70 years as a predictor of subsequent disability. N Engl J Med. 1995;332(9):556–61. doi: 10.1056/NEJM199503023320902. [DOI] [PMC free article] [PubMed] [Google Scholar]
- 26.Ostir GV, et al. Reliability and sensitivity to change assessed for a summary measure of lower body function: results from the Women’s Health and Aging Study. J Clin Epidemiol. 2002;55:916–21. doi: 10.1016/s0895-4356(02)00436-5. [DOI] [PubMed] [Google Scholar]
- 27.de Rekeneire N, et al. Is a fall just a fall: correlates of falling in healthy older persons. The Health, Aging and Body Composition Study. J Am Geriatr Soc. 2003;51(6):841–6. doi: 10.1046/j.1365-2389.2003.51267.x. [DOI] [PubMed] [Google Scholar]
- 28.Guralnik JM, et al. Lower extremity function and subsequent disability: consistency across studies, predictive models, and value of gait speed alone compared with the short physical performance battery. J Gerontol A Biol Sci Med Sci. 2000;55(4):M221–31. doi: 10.1093/gerona/55.4.m221. [DOI] [PMC free article] [PubMed] [Google Scholar]
- 29.Perkins DO, Wyatt RJ, Bartko JJ. Penny-wise and pound-foolish: the impact of measurement error on sample size requirements in clinical trials. Biological Psychiatry. 2000;47(8):762–766. doi: 10.1016/s0006-3223(00)00837-4. [DOI] [PubMed] [Google Scholar]
- 30.Ahroni JH, Boyko EJ, Forsberg R. Reliability of F-scan in-shoe measurements of plantar pressure. Foot Ankle Int. 1998;19(10):668–73. doi: 10.1177/107110079801901004. [DOI] [PubMed] [Google Scholar]
- 31.Hadzic V, et al. The isokinetic strength profile of quadriceps and hamstrings in elite volleyball players. Isokinetics and Exercise Science. 2010;18(1):31–37. [Google Scholar]
- 32.Miyai I, et al. Cortical mapping of gait in humans: a near-infrared spectroscopic topography study. Neuroimage. 2001;14(5):1186–92. doi: 10.1006/nimg.2001.0905. [DOI] [PubMed] [Google Scholar]
- 33.Suzuki M, et al. Prefrontal and premotor cortices are involved in adapting walking and running speed on the treadmill: an optical imaging study. Neuroimage. 2004;23(3):1020–1026. doi: 10.1016/j.neuroimage.2004.07.002. [DOI] [PubMed] [Google Scholar]
- 34.Kapreli E, et al. Lateralization of brain activity during lower limb joints movement. An fMRI study. Neuroimage. 2006;32(4):1709–1721. doi: 10.1016/j.neuroimage.2006.05.043. [DOI] [PubMed] [Google Scholar]
- 35.Marsden CD, Obeso JA. The functions of the basal ganglia and the paradox of stereotaxic surgery in Parkinson’s disease. Brain. 1994;117(Pt 4):877–97. doi: 10.1093/brain/117.4.877. [DOI] [PubMed] [Google Scholar]
- 36.Ounpuu S, Winter DA. Bilateral electromyographical analysis of the lower limbs during walking in normal adults. Electroencephalogr Clin Neurophysiol. 1989;72(5):429–38. doi: 10.1016/0013-4694(89)90048-5. [DOI] [PubMed] [Google Scholar]
- 37.Beck BR, Weeks BK. Which Limb to Scan? Revisiting the Relationship Between Skeletal and Functional Limb Dominance. American Society for Bone and Mineral Research (ASBMR 2010) Annual Meeting; 2010; Toronto Canada. ASBMR 2010 Annual Meeting Abstracts. [Google Scholar]
- 38.Elias LJ, Bryden MP, Bulman-Fleming MB. Footedness is a better predictor than is handedness of emotional lateralization. Neuropsychologia. 1998;36(1):37–43. doi: 10.1016/s0028-3932(97)00107-3. [DOI] [PubMed] [Google Scholar]
- 39.Springett KP, Whiting MF, Marriott C. Epidemiology of plantar forefoot corns and callus, and the influence of dominant side. The Foot. 2003;13(1):5–9. [Google Scholar]