Abstract
A network analysis is used to uncover hidden folding pathways in free-energy landscapes usually defined in terms of such arbitrary order parameters as root-mean-square deviation from the native structure, radius of gyration, etc. The analysis has been applied to molecular dynamics (MD) trajectories of the B-domain of staphylococcal protein A, generated with the coarse-grained united-residue (UNRES) force field in a broad range of temperatures (270K ≤ T ≤ 325K). Thousands of folding pathways have been identified at each temperature. Out of these many folding pathways, several most probable ones were selected for investigation of the conformational transitions during protein folding. Unlike other conformational space network (CSN) methods, a node in the CSN variant implemented in this work is defined according to the nativelikeness class of the structure, which defines the similarity of segments of the compared structures in terms of secondary-structure, contact-pattern, and local geometry, as well as the overall geometric similarity of the conformation under consideration to that of the reference (experimental) structure. Our previous findings, regarding the folding model and conformations found at the folding-transition temperature for protein A (Maisuradze et al., J. Am. Chem. Soc. 132, 9444, 2010), were confirmed by the conformational space network analysis. In the methodology and in the analysis of the results, the shortest path identified by using the shortest-path algorithm corresponds to the most probable folding pathway in the conformational space network.
Introduction
Proteins have to fold into a unique ensemble of three-dimensional structures in order to perform their functions. To understand how proteins fold and function, knowledge of their free-energy landscapes (FELs)1–4 is required. It is impossible to present an FEL as a function of all degrees of freedom of a protein. Consequently, it is very important to find the coordinates along which the intrinsic folding pathways can be viewed. The common choices for reaction coordinates are root-mean-square-deviation (rmsd) with respect to the native structure, radius of gyration, number of native contacts and other order parameters. Recent studies5–8 have shown that FELs projected on one or two order parameters are relatively simple and may contain artifacts. Naturally, questions have been raised6,7,9 about the dimensionality of the FELs and the appropriate reaction coordinates, along which protein-folding progress can be described correctly. It has been demonstrated6–11 that principal components are one of the alternatives that answers these questions. Another alternative is to present the FEL without projecting the free energy on chosen coordinates.
Recent significant developments in network research12 have attracted attention for studying different complex systems, such as social interaction, the internet, and protein folding. One of the approaches, in which a small network was constructed for the description of folding behavior, was developed by Krivov and Karplus13 and applied to study the folding dynamics of the β-hairpin of protein G.5 An unprojected FEL, termed a transition disconnectivity graph (TRDG), was introduced13 for this purpose. Another example of the use of complex network theory for the analysis of conformational space with application to the folding of a 20-residue antiparallel β-sheet peptide was presented by Rao and Caflisch.14 In that work, the nodes in the conformational space network (CSN) represent the conformations, and the links correspond to direct transitions between different nodes. They also presented the free energy surface of the alanine “dipeptide” by network analysis,15 and the free-energy basins of the FEL were identified by partitioning the network into different clusters using a cluster-detection algorithm.15 Recently, by studying the dynamics of a small peptide in its native state using an inherent-structure (IS)16 based approach, i.e., by focusing on local minima in the potential energy surface, Rao and Karplus17 illustrated the correspondence between conformational changes, energy barriers and transition kinetics by mapping the potential energy onto an FEL using an IS-based CSN. All these investigations have demonstrated that the network approach can be used to obtain free-energy landscapes without having to identify the essential degrees of freedom. Moreover, network analysis can capture all the transitions between different conformations; consequently, it is a very useful approach with which to analyze folding pathways.
In previous studies of protein folding by network analysis, a node was usually defined according to secondary structure,14 rmsd,14 or backbone dihedral angles (φ, ψ).15 However, since the conformations in the same node should be structurally similar to each other, in this work a node in the CSN is defined according to the nativelikeness of the structure, as introduced recently,18,19 which considers more factors, not only secondary structure and rmsd but also the packing between pairs of secondary structure. Because all the conformational transitions can be captured in the CSN, every possible folding pathway is also presented in the CSN, and it is possible to identify the most probable folding pathways in the CSN. Therefore, in this work, for the first time, the shortest-path algorithm is applied to the CSN in order to identify the most probable folding pathways.
In this paper, the folding trajectories from molecular dynamics (MD) simulations of the B-domain of staphylococcal protein A (1BDD), a 46-residue three-α-helical protein,20 generated with the UNRES force field18,19,21–27 are analyzed by network analysis. Protein A has been studied intensively,7,8,28–45 because it is a small protein and folds rapidly to the native structure. Also, because of the loose native-like structure, which leads to quite a broad native state with several deep minima and the possibilities to fold by many pathways, 1BDD is quite a challenging system with which to test the network approach. Conformational space networks are constructed from 16 independent trajectories, each consisting of 100,000,000 MD steps (489 ns of UNRES time), at each of several temperatures (T = 270, 280, 300, 310, and 325K).
Methods
Simulation
Network analysis was applied here to the MD trajectories generated with the coarse-grained UNRES18,19,21–27 force field applied to polypeptide chains. In the UNRES force field, a polypeptide chain is represented by a sequence of α-carbon (Cα) atoms linked by virtual bonds with united peptide groups and united side chains. Each united peptide group is located in the middle between two neighboring α-carbons. Only these united peptide groups and the united side chains serve as interaction sites, the α-carbons serving only to define the chain geometry. The energy function of the virtual-bond chain is expressed by eq.127
| (1) |
with the temperature dependent factor
| (2) |
The successive terms in eq.1 represent side chain-side chain, side chain-peptide, peptide-peptide, torsional, double-torsional, bond-angle bending, side-chain local, distortion of virtual bonds, multibody (correlation) interaction, and formation of disulfide bonds, respectively. More details of the theoretical basis of the UNRES force field and parameterization of the energy terms are described in previous papers.18,19,21–27
Canonical molecular dynamics simulations for 1BDD were run at five different temperatures, 270K, 280K, 300K, 310K, and 325K, with 16 trajectories at each temperature. The version of the force field used in this study was calibrated27 with the 1GAB protein. The calibration procedure was based on a hierarchical-optimization method developed in our laboratory.18,19,26,27 In this method, the energy-term weights are optimized so that the free energy of a given sub-ensemble of conformations decreases with increasing native-likeness below the folding-transition temperature, increases above the folding-transition temperature, and so that the free energies of all sub-ensembles be equal at the folding-transition temperature. It should be noted that the calibration is only the last stage of force-field parameterization aimed at putting together the energy terms to give a folding force field, which are derived from free-energy surfaces of model systems24,25 and PDB statistics.22,23 Therefore, the obtained force field is transferable to other proteins, even though it was calibrated with one.27 In particular, it can fold protein A, a protein which was not used in calibration and which has little sequence similarity to 1GAB. The time step in the MD simulations was 0.1 mtu (1 mtu = 48.9 fs is the “natural” time unit of MD) and the coupling parameter of the Berendsen thermostat46 was 1 mtu.
Classification of structures
In the conformational space network, each node represents a conformation, and a link between two nodes corresponds to the transition between two conformations. In this work, the node was defined according to the nativelikeness of the structure,18,19 which was represented by a series of class numbers, called a class code (see Appendix for details).18,19 As an example, Table 119 shows the structural classification of 1BDD associated with a specific class number at each conformational level. For example, the native structure of 1BDD has class code 777.22.2. The class code has three levels. Level 1 represents the nativelikeness of the elementary fragments, which are defined as the consecutive three helices. Therefore, the first three digits (777) of the class code correspond to the first level, with each digit representing a helix. It can be seen from Table 1 that a “1” in level 1 means that the fragment matches the native fragment only in secondary structure contact (without interaction between the helices) and a “7” in level 1 means that it is also similar to the native fragment in contact pattern and in geometric details. The next two numbers (22) correspond to level 2, which accounts for the similarity of contact pattern of packing of the pairs of fragments to that in the experimental structure. In Table 1, a “2” in level 2 shows the native packing without a sequence shift between a pair of elementary fragments. The packing between a given pair of elementary fragments is considered native if the number of native contacts (the number of side-chain contacts for 1BDD) between this pair of fragments is greater than 70% of the native contacts and the rmsd of the segment consisting of this pair of fragments is lower than a certain threshold. The last number (2) represents level 3, and describes the overall similarity of the calculated to the experimental structure; a “2” is assigned if the rmsd is low, i.e. less than a chosen cut-off (“rmsd match”). A more extensive description of the class code is provided in the Appendix and in refs. 18 and 19.
Table 1.
The structural classification of 1BDD (the three-helix protein A) associated with a specific class number corresponding to secondary structure, packing between a given pair of secondary structures and rmsd match of the whole molecule.19
| levela | class numberb | structural similarity |
|---|---|---|
| 1 | 0 | non-native fragment |
| 1 | native secondary structure | |
| 2 | native hydrogen-bonding internal contacts, only after a sequence shift | |
| 3 | native secondary structure and hydrogen-bonding internal contacts after a sequence shift | |
| 4 | not used (see ref.17) | |
| 5 | not used (see ref.17) | |
| 6 | native hydrogen-bonding internal contacts only without a sequence shift | |
| 7 | native secondary structure and hydrogen-bonding internal contacts without a sequence shift | |
| 2 | 0 | non native packing |
| 1 | native packing after a sequence shift | |
| 2 | native packing without a sequence shift | |
| 3 | 0 | no rmsd match |
| 1 | rmsd match after a sequence shift | |
| 2 | rmsd match without a sequence shift | |
The levels in ref.18 and ref.19 have a totally different meaning from each other. The levels in ref.18 represent the hierarchy on the potential-energy surface. The energy levels of the structure in ref.18 decrease with increasing nativelikeness of the structure. The conformational levels in ref. 19 are defined to evaluate the nativelikeness of conformations.
Construction of the CSN
The class code is calculated for each conformation along the trajectory. The conformations with identical class code are grouped into the same node. If a transition between two conformations with different class codes is observed in the trajectory, a link is added between the two corresponding nodes. A weight wi assigned to node i is equal to the number of conformations with a given class code grouped in node i. A weight wij assigned to the link between nodes i and j is equal to the number of times this transition is observed in either direction along the trajectory.
CSN, as well as many other real networks47–49, have been found to have a community structure50 (which is also called a clustering51 or modular structure15), which is defined as the presence of groups of nodes in a network that have dense links within each group and sparse links between the groups. This kind of group of nodes is often called a cluster in the network. Many algorithms have been developed to detect the clusters in the network. In this work, two cluster-detection algorithms, the Markov clustering (MCL) algorithm,52,53 and the modularity maximization algorithm51 have been applied to identify the clusters in the CSN. The MCL algorithm with a stochastic matrix simulates the behavior of stochastic walks on the network. A parameter I is usually used to tune the granularity of the clustering. At I = 1, the network is considered as one single cluster. As the value of I increases, more and more clusters are generated by the algorithm. In this paper, a small value of I is used to identify the largest clusters in the network. The modularity maximization (MM) algorithm is a hierarchical agglomerative algorithm which searches over possible partitionings of the network for ones with a high value of the modularity , which measures the quality of the partitioning of the network. The quantity eii is the fraction of links between nodes in cluster i and ai = ∑jeji is the fraction of links connected to nodes in cluster i.
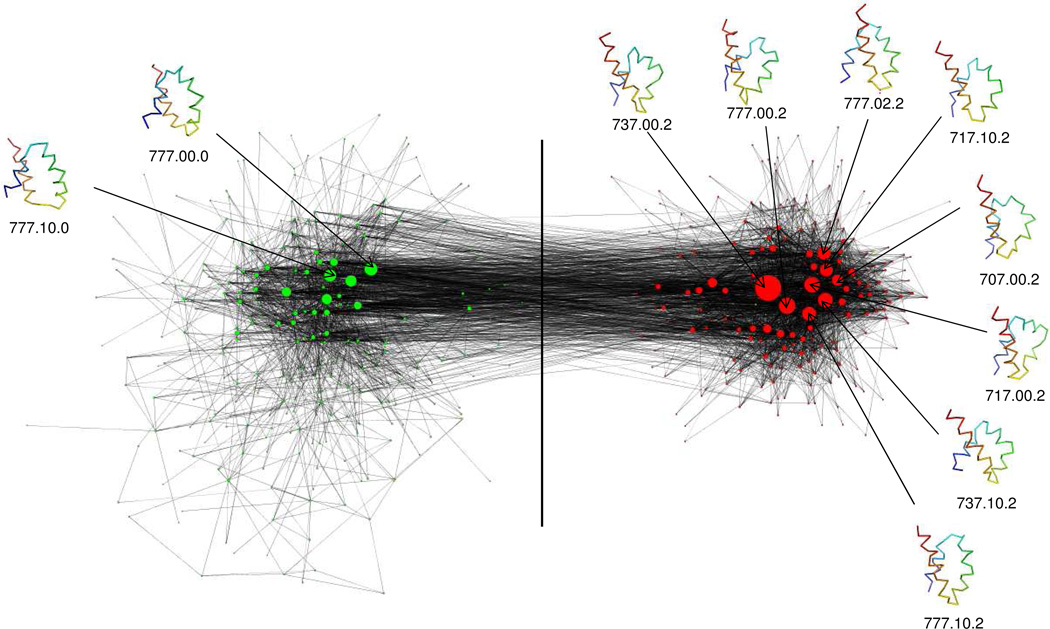
Both the MCL algorithm and the MM algorithm generated two major clusters in the CSN for T = 270K and 280K, as shown in Fig. 1 for 270K. The structures of the most populated nodes in each cluster were examined to see whether the node contains native-like structure. The nodes in one cluster contain mainly structures with an rmsd match, which shows that this cluster represents the native basin. The nodes in the native basin are colored in red (Fig. 1). The nodes in the other cluster are colored in green and contain structures without an rmsd match, which include mirror-image structures and molten-globule (MG) structures.54
Fig.1.
The 1BDD conformational space network with one metastable state (set of conformations linked by solid lines to green circles) and one basin (with examples of nativelike conformations linked to red circles) at T=270K. The circles are nodes that represent conformations, and the very thin lines are links that represent transitions between conformations. The green nodes represent high-rmsd structures (higher than a chosen cut-off of 5.0 Å from the native) while the red nodes represent structures with a low rmsd, i.e. ”rmsd match” (lower than the chosen cut-off). The magnitudes of the rmsd’s are not indicated in the diagram. The size of the nodes is proportional to their population. The representative conformations and the class codes of the 10 most populated nodes are shown. The network is plotted by using the network visualization software VISONE (http://visone.info). The network visualization program is designed to show the size and location of the nodes (not only the red and green circles but also the numerous small data for low-populated conformations) in the network in a way that is easier for visual inspection. The distance between the metastable state and the native basin has been increased artificially on both sides of the vertical line to facilitate easy visualizations.
For the CSN at T = 300K, 310K and 325K, one major cluster and several small clusters are generated by both the MCL algorithm and the MM algorithm. All of the most populated nodes belong to the major cluster, indicating one big basin in the network. The structures of the most populated nodes in the major cluster are mainly native and molten-globule structures.
After the free-energy basins were identified in the CSN at different temperatures, the most populated node in each basin, which represents the deepest minimum in the basin, was also found. From the information about the deepest minimum in the corresponding free-energy basin, the free-energy profiles at different temperatures can be sketched.
Coarse-grained CSN
A coarse-grained conformational space network17 is built from the original network by keeping the most populated nodes and the most populated links among these nodes. All others are deleted. In this paper, the top 10 most populated nodes are all kept in the coarse-grained CSN.
The shortest path
Since all of the possible transitions between different conformations are captured by the network, thousands of the potential folding pathways are also presented in the CSN. In this work, the shortest path from the initial structures to the native-like structures is calculated. As a fundamental concept in graph theory,55–57 the shortest path between two given nodes i and j is defined as a path connecting them with the shortest distance
| (3) |
where k,l,m, and n, etc. denote intermediate nodes on the path and wik is the weight of the link connecting nodes i and k. Among many algorithms, developed to solve the shortest-path problem,58–61 Dijkstra's algorithm59 is widely used to find the path with the lowest cost in the weighted network where the weight of the link between two nodes represents the cost of making this transition and links with high weights should be avoided in the shortest path. Newman62 extended Dijkstra’s algorithm by inverting the link weight to identify the shortest path in scientific collaboration networks, where the weight of a link represents the strength of the link between nodes, and links with high weights should now be included in the shortest path. In the conformational space network, the weight of a link represents the transition probability. Thus, the most probable pathway between the initial structure and the native-like structure should go along links that have as high a weight as possible. Therefore, the shortest path between a given pair of nodes identified by the implementation of Dijkstra's algorithm in Ref. 62 corresponds to the most probable pathway between these two nodes in the CSN. The distance along a path between node i and j in Ref. 62 is defined as
| (4) |
Consequently, d(i, j) is lowest for links with high weights, thereby defining the most probable pathway. In this work, we applied Newman’s implementation of Dijkstra's algorithm to identify the shortest path between the initial structures and the native-like structures in the CSN at different temperatures.
Results and Discussion
Use of CSN to analyze UNRES trajectories
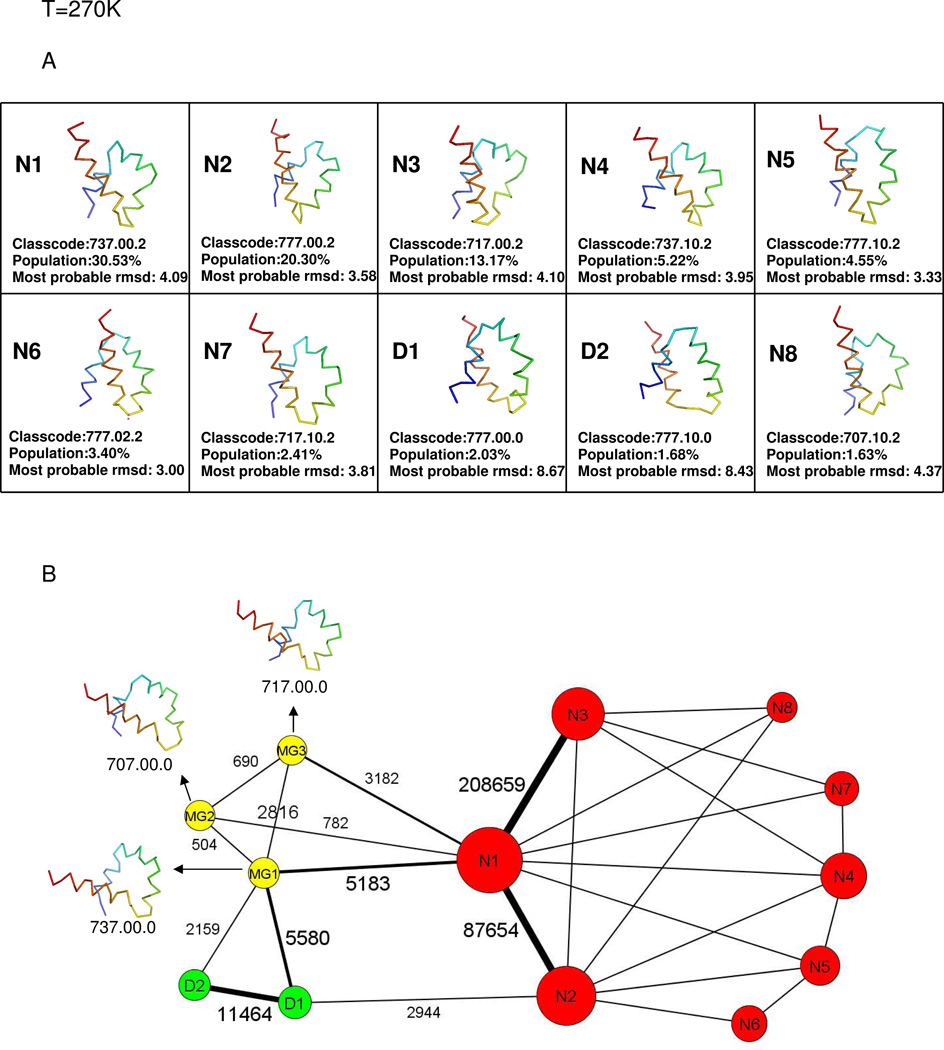
The representative structure of the top 10 most populated nodes at T = 270K are listed in Fig. 2A. The representative conformations, the most probable rmsd values (corresponding to the peak of the rmsd distribution) and the populations of the top 10 nodes with corresponding class code are also shown in Fig. 2A. The coarse-grained network at T = 270K is shown in Fig. 2B. The nodes with native-like structures are shown as red-colored circles and labeled with the letter N and a number. The nodes with molten-globule structures are shown as yellow-colored circles and labeled with the letters MG and a number. The nodes with topological mirror-image conformation are shown as green-colored circles and labeled with the letter D and a number. Each label corresponds to structures with a certain class code. For example, node N1, which is the most populated in the simulations at 270K, corresponds to native-like structures with class code 737.00.2. The sizes of the nodes are proportional to their populations. The top 10 most populated nodes are included in the coarse-grained network. The top 10 nodes account for 84.92% of the total number of conformations. Eight of the top 10 nodes belong to the native basin. The other two, D1 and D2, of the top 10 nodes are mirror-image structures with only a 3.71% contribution to the total number of conformations. The class code for D1 is 777.00.0, which means that the structures in D1 have three fully formed helices, no native packing, and no rmsd match. The class code for D2 is 777.10.0, which means that the structures in D2 have three fully formed helices, a native packing after a sequence shift between the N terminal helix and the middle helix, but no rmsd match. Both D1 and D2 contain mirror image structures and molten-globule structures, but the number of mirror image structures is five times (in D1) and ten times (in D2) higher, respectively, than that of the molten-globule structures. Therefore, D1 and D2 are actually kinetic traps in the folding process at T = 270K.
Fig.2.
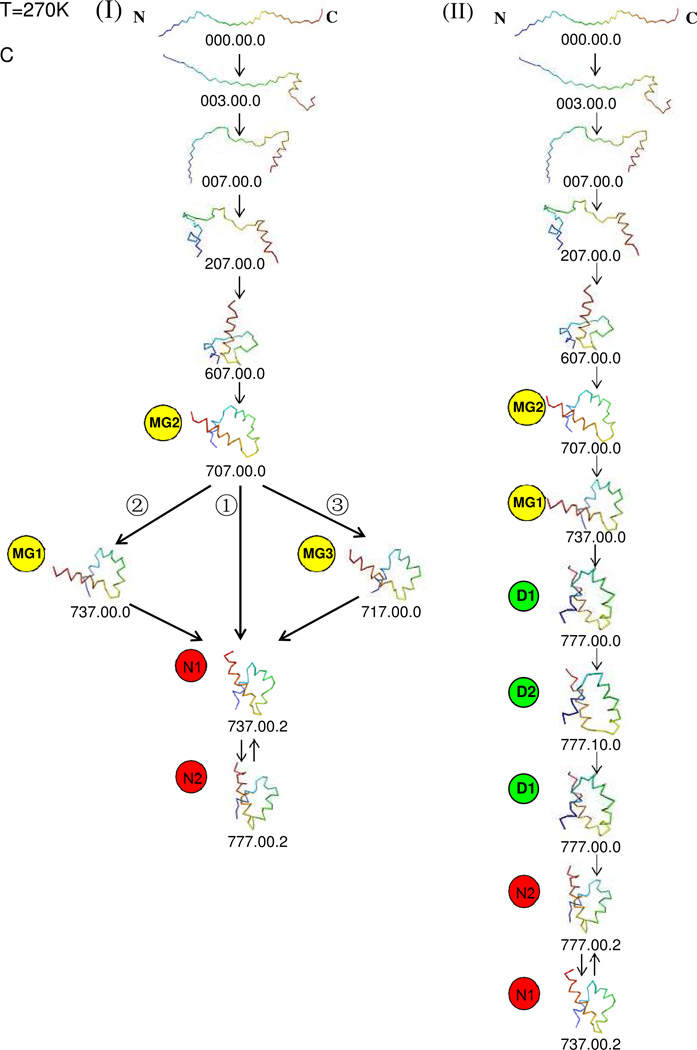
(A)Representative structures of the top 10 most populated nodes of Fig.1 at T=270K. (B) The coarse-grained CSN at T=270K. Nodes with native-like structures are in red-colored circles and labeled with the letter N and a conformation number. Nodes with molten-globule structures are in yellow-colored circles and labeled with the letters MG and a conformation number. Nodes with mirror-image structures are in green-colored circles and labeled with the letter D and a conformation number. The size of a node is proportional to its population. The number of transitions of the most probable links within the metastable state and within the native basin, and between the metastable state and the native basin, are also shown. The transition N1 ↔ N3 is the one with the highest number 208659 in the native basin, and the transition D1 ↔ D2 is the one with the highest number 11464 in the metastable state. The transition MG1 ↔ N1 is the one with the highest number 5183 connecting the metastable state and the native basin. The lengths of the links do not reflect the relative numbers of transitions. (C) Possible folding pathways from the initial structures (with the N- and C- terminal residues labeled N and C) to the native-like structure with (II) and without (I) going through the kinetic traps at T=270K. D1 and D2, which contain mainly mirror-image structures, are the kinetic traps. In both type I and II pathways, the path from the initial structure to one of the Molten-Globule structures MG2 was obtained by using the shortest-path algorithm (see Methods section). Among the paths from MG2 to one of the native-like structures, path ➀ in type I was generated by the shortest-path algorithm, and all the other paths could be identified from the coarse-grained CSN. (see Fig. 2B).
The cluster-detection algorithms identified one metastable state and one large basin, as shown in Fig.1. The metastable state is formed by mirror-image conformations (D1 and D2 nodes), and the large basin is formed by nodes with native-like structures. Among several folding pathways from the fully-unfolded conformation to the native state, illustrated in the coarse-grained CSN in Fig. 2B, two main types of pathways can be identified (Fig. 2C). In pathway type I [Fig. 2C(I)], the protein folds without being trapped in a metastable state formed by the mirror-image topology. Instead, the protein first reaches the molten-globule structure (MG2), forming the C-terminal helix first and the N-terminal helix later. The pathway from the initial structure to MG2 was calculated by the shortest-path algorithm. After reaching MG2, there are three possible pathways [labeled ➀, ➁, and ➂ in Fig. 2C(I)] to reach the native state. Path ➀ is the shortest one, and goes directly from MG2 to N1 [MG2→N1↔N2, in Fig. 2C(I)➀], in which the middle helix is not initially formed and begins to form only after the native basin is reached. When following path ➁ MG2→MG1→N1↔N2 [in Fig. 2C(I)➁], the system goes from MG2 to MG1 first forming half of the middle helix, and then jumping to the native basin with lower rmsd and with the half-formed middle helix retained. Path ➂ starts with the transition from MG2 to MG3, which results in partial formation of the middle helix, and then the system jumps to the native basin [MG2→MG3→N1↔N2, in Fig. 2C(I) ➂]. Pathway type II, from the initial fully-unfolded conformation to the native state, is shown in Fig. 2C(II), in which the protein folds through the kinetic trap. After reaching MG2, the protein follows the MG2 → MG1 → D1↔D2↔D1 pathway, forming the middle helix in the kinetic trap before jumping to the native basin (D1→N2↔N1). It should be noted that, unlike the first and third helices, the middle helix of 1BDD is not very stable in the native basin.
The representative structures of the top 10 most populated nodes at T = 280K are listed in Fig. 3A. The top 10 nodes account for 81.45% of the total conformations. Among the top 10 populated nodes, only D1 does not contain native-like structures. The nodes D1 and D2 at 280K are also found to contain mainly the conformations with mirror-image topology and fewer molten-globule structures. As at 270K, there are one metastable state and one basin at T = 280K: the metastable state is formed by nodes D1 and D2, and the basin is formed by nodes containing native-like structures. The coarse-grained network at T = 280K illustrated in Fig. 3B and showing several possible pathways, is very similar to that at 270K. There are two different types of pathways from the fully-unfolded conformation to the native state at 280K. Fig. 3C(I) shows pathway type I without going through kinetic traps. The pathway from the initial structure to the molten-globule structure MG1 is the shortest path between these two nodes. The C-terminal helix forms first and the N-terminal helix forms fully later when reaching MG1. After reaching MG1, it either takes the shortest path (path ➀) to the native-like structure by jumping to the native basin with a half-formed middle helix [MG1→N1↔N2, in Fig.3C(I)➀], or first goes to MG3 (path ➁), where the formation of the middle helix is degraded, and then to the native basin [MG1→MG3→N1↔N2, in Fig.3C(I)➁]. Fig. 3C(II) shows pathway type II going through the kinetic trap. In particular, after reaching MG1 the system takes the pathway MG1→D1↔D2↔D1 forming the middle helix completely before jumping to the native basin (D1→N2↔N1).
Fig.3.
same as (A) and (B) of Fig. 2 but at T=280K. (C) same as Fig. 2C but at T=280K. In both type I and II pathways, the path from the initial structure to MG1 was obtained by using the shortest-path algorithm. Among the paths from MG1 to one of the native-like structures, path ➀ in type I was generated by the shortest-path algorithm, and all the other paths could be identified from the coarse-grained CSN. (see Fig. 3B).
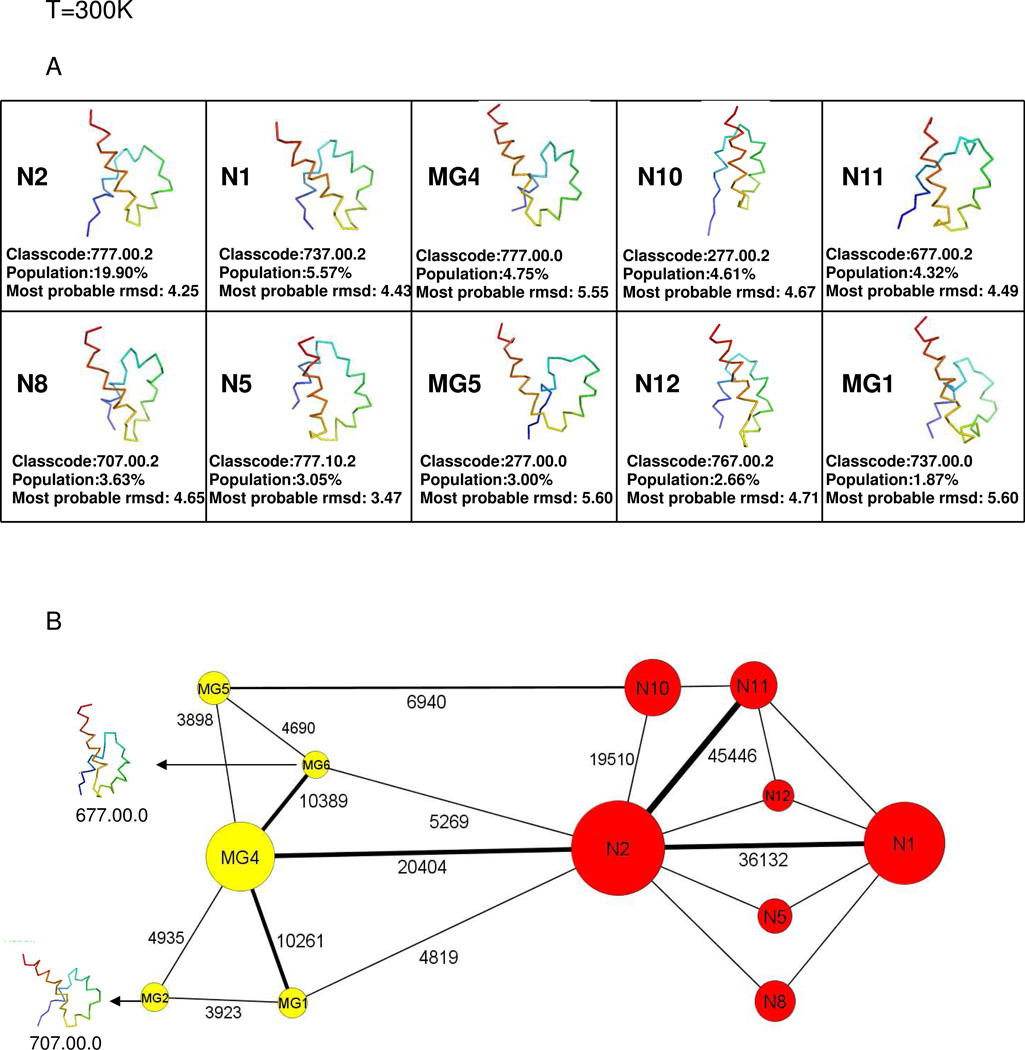
The representative structures of the top 10 nodes and the coarse-grained network at T = 300K are illustrated in Figs. 4A and 4B, respectively. The top 10 nodes account for 53.36% of the total conformations and consist of three molten-globule structures and seven native-like structures. No kinetic traps are found at T = 300K. The molten-globule structures and the native-like structures are found in one large basin by the cluster-detection algorithm. Among several pathways, illustrated in the course-grained CSN in Fig. 4B, Fig. 4C shows three of the possible pathways from the initial fully-unfolded structure to the native-like structure. The pathway from the initial structure to MG5 was calculated by the shortest-path algorithm. This pathway shows that, unlike the pathways at 270K and 280K, before reaching the MG5 structure the protein first forms the C-terminal helix and then the middle helix. After reaching MG5, the system either takes the shortest path (path ➀) to the native-like structure by jumping to the native-like node N10 with a not-fully-formed N-terminal helix (which becomes fully-formed in the native basin) [MG5→N10→N2, in Fig. 4C ➀]; or first goes to MG6 from MG5 with almost complete formation of the first helix, and then jumps to N2 [MG5→MG6→N2, path ➁ in Fig. 4C], or first goes from MG5 to MG6 and then to MG4 forming the full N-terminal helix and later jumps to the native basin [MG5→MG6→MG4→N2, path ➂ in Fig. 4C].
Fig.4.
same as (A) and (B) of Fig. 2 but at T=300K. (C) same as Fig. 2C but at T=300K, and without kinetic traps. The path from the initial structure to MG5 was obtained by using the shortest-path algorithm. Among the paths from MG5 to N2, path ➀ was generated by the shortest-path algorithm, and paths ➁ and ➂ could be identified from the coarse-grained CSN. (see Fig. 4B).
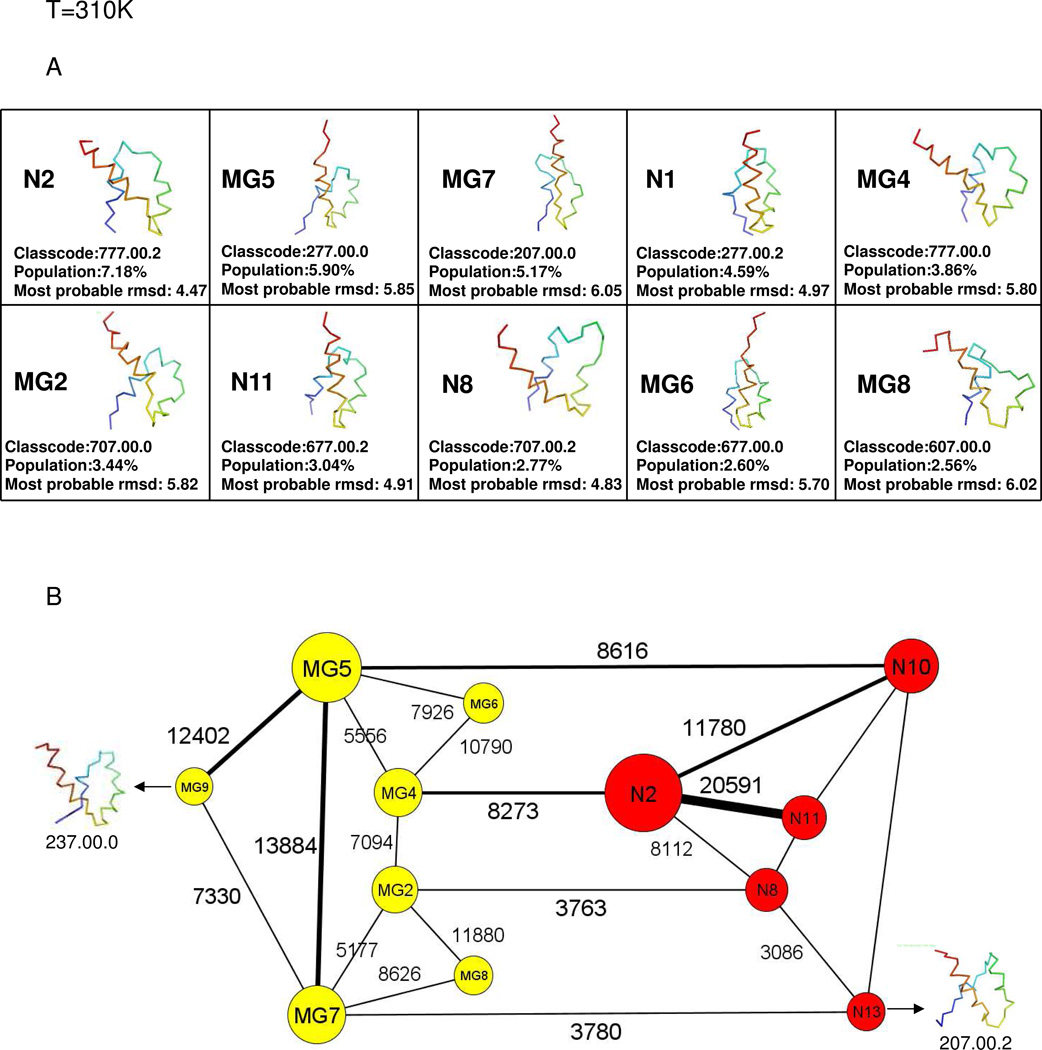
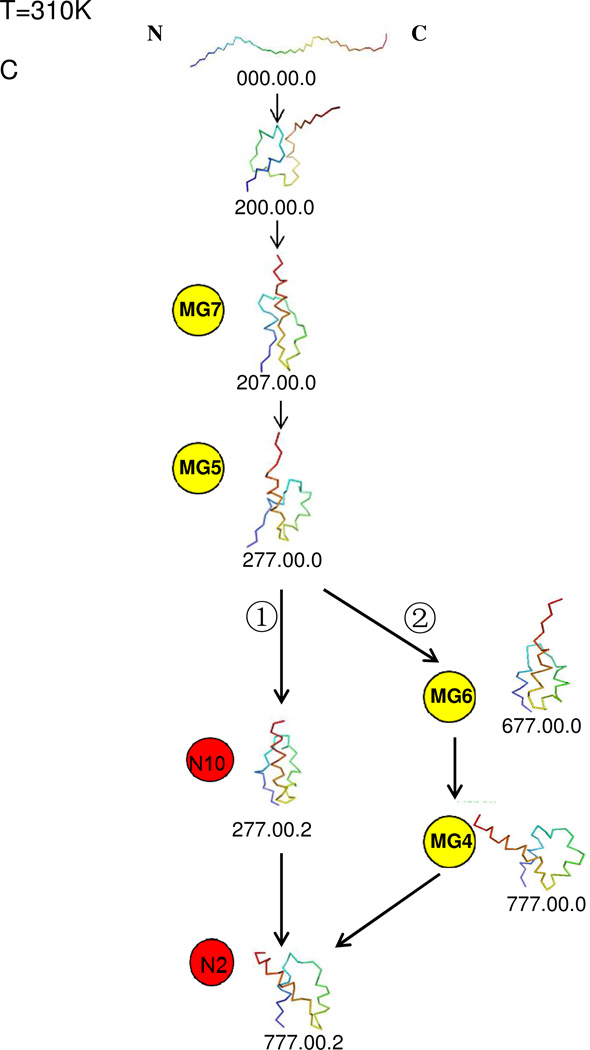
Fig. 5A shows the representative structures of the top 10 nodes at T = 310K and Fig. 5B shows the course-grained network at T = 310K. The top 10 nodes account for 41.11% of the total conformations and consist of six molten-globule structures and four native-like structures. There is no kinetic trap at T = 310K. The molten-globule structures and the native-like structures lie in one large basin. Among several pathways, illustrated in the coarse-grained CSN in Fig. 5B, two of the possible pathways from the initial structure to the native-like structure are shown in Fig. 5C. The shortest path between the fully-unfolded structure and the molten-globule structure MG5 shows that the N-terminal helix starts to partially form early; however, the C-terminal helix fully forms first followed by the middle helix. After reaching MG5, the system either takes the shortest path (path ➀) to the native-like structure by jumping directly to the native-like node N10 with a not-fully-formed N-terminal helix (which later forms fully in the native state) [MG5→N10→N2, in Fig. 5C ➀]. After reaching MG5, the other possible path ➁ goes from MG5→MG6→MG4 fully forming the N-terminal helix and then jumping to the native state [MG4→N2, in Fig. 5C ➁]
Fig.5.
same as (A) and (B) of Fig. 2 but at T=310K. (C) same as Fig. 2C but at T=310K, and without kinetic traps. The path from the initial structure to MG5 was obtained by using the shortest-path algorithm. Among the paths from MG5 to N2, path ➀ was generated by the shortest-path algorithm, and path ➁ could be identified from the coarse-grained CSN. (see Fig. 5B).
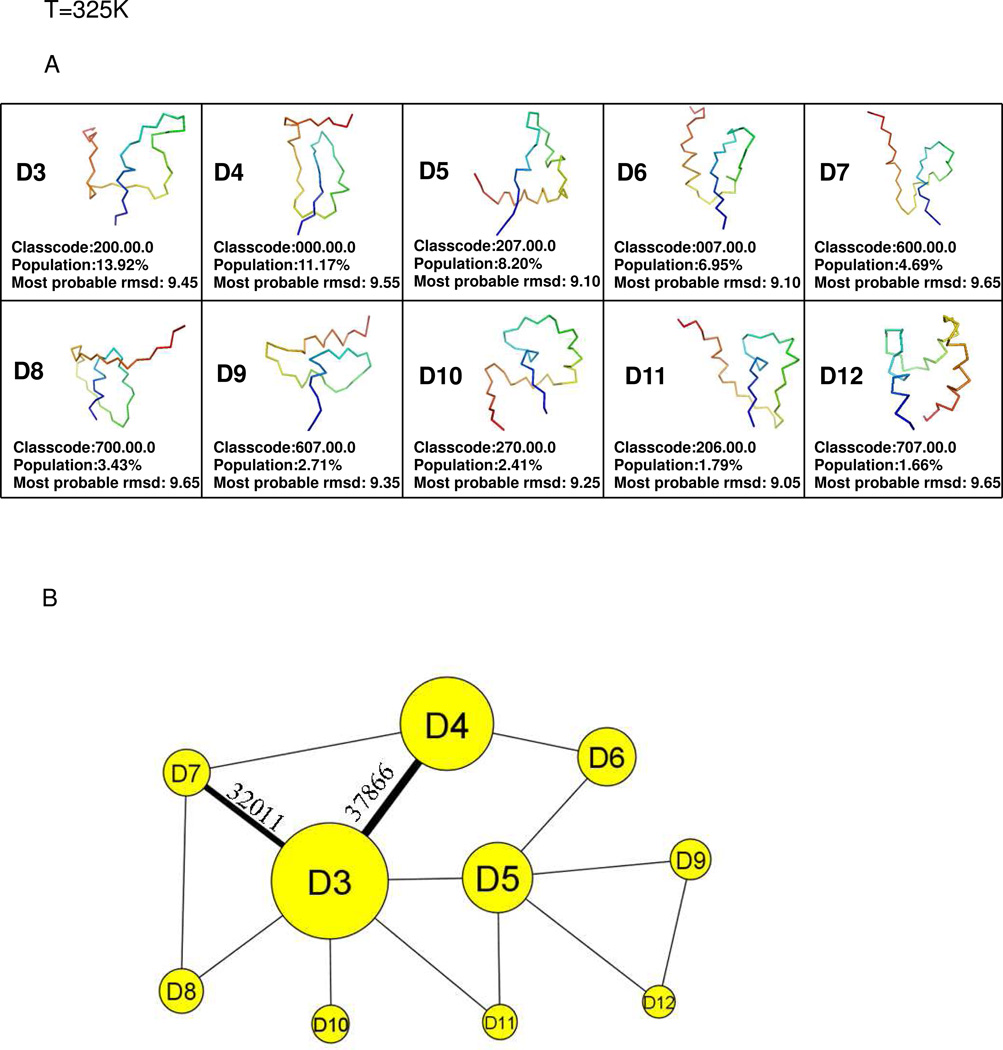
The representative structures of the top 10 most populated nodes, and the coarse-grained CSN at the folding-transition temperature 325K, are shown in Fig. 6A and 6B, respectively. No native minimum is found among the top 10 most populated nodes. All of the most populated minima contain either unfolded or partially (“residually”) folded structures. D3 (class code 200.00.0) is the most populated node in the network. D4 is the second most populated node with class code 000.00.0, which is also the class code of the initial structure in the simulation. Therefore, the initial structures are grouped into D4. The protein goes from the initial structure to the deepest minimum by following the transition D4→D3 which has the highest number of transitions in the whole network at this temperature. This finding that, at the folding-transition temperature (325K), protein A does not adopt its native, three-dimensional folded conformation and the only conformations found in the most populated nodes are conformations with only residual secondary structure, contradicts one of the widely used models for the description of single-domain protein folding – the two-state model.63
Fig.6.
same as (A) and (B) of Fig. 2 but at T=325K. The nodes with residually folded structures are in yellow colored circles and labeled with the letter D and a conformation number.
Effect of temperature on folding pathways
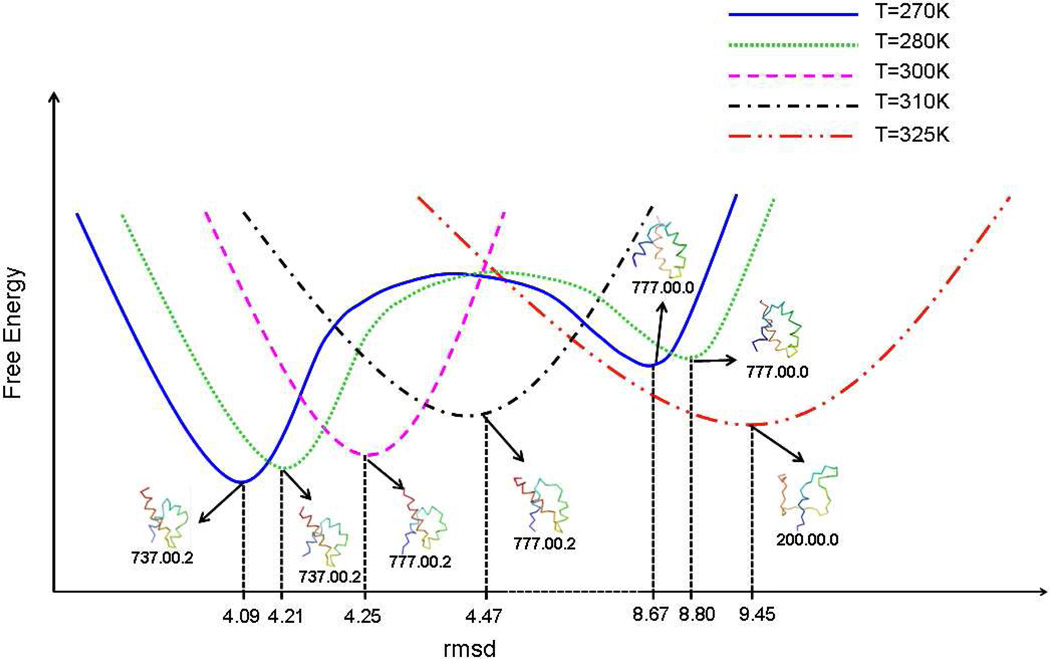
From the coarse-grained networks at different temperatures, it can be seen that mirror-image topology appears more frequently at lower temperature (270K and 280K). Therefore, at these temperatures, protein A folds either directly using a downhill folding scenario or through the kinetic trap. With increasing temperature (300K and 310K), the kinetic trap disappears, and hence the protein folds by downhill folding. Also, with increasing temperature, protein A gradually becomes unfolded and, at the folding-transition temperature (325K), the conformational ensemble of protein A is a collection of residually folded structures. This observation is consistent with our previous studies.8,45 In order to show these changes with temperature, Fig. 7 sketches the free-energy profiles for different temperatures. The representative structures with corresponding class codes of the most populated nodes at different temperatures are also shown in Fig.7. The most populated nodes at T = 270K and 280K have the same class code, and the most populated nodes at T = 300K and 310K have the same class code. The most populated node at T = 325K contains only a partially folded (or “residually folded”) structure. With increasing temperature, the most probable rmsd of the most populated node is shifted to higher values.
Fig.7.
Structures at minima of free energy, and a sketch of free energy profiles (see Methods section) at T=270,280,300,310, and 325K. Two minima are shown at 270 and 280K, the higher ones being the kinetic trap.
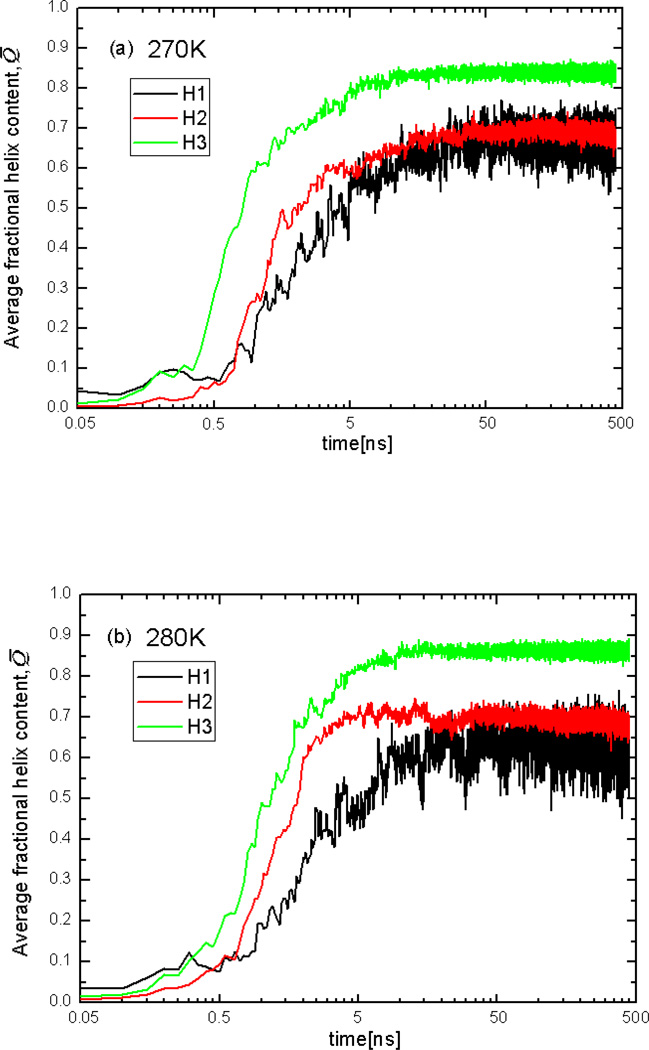
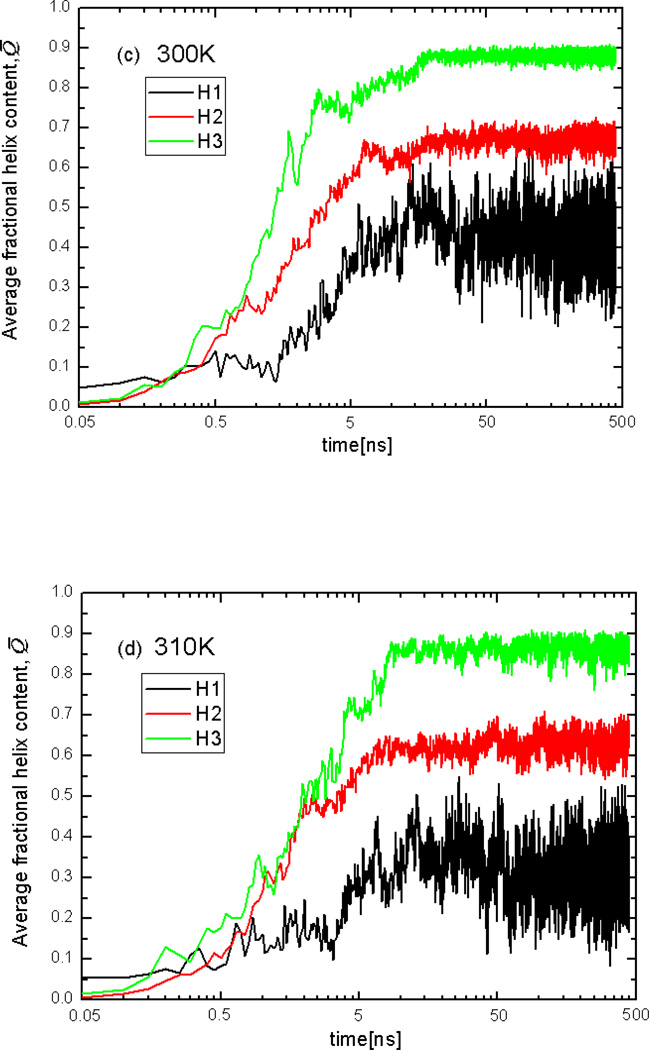
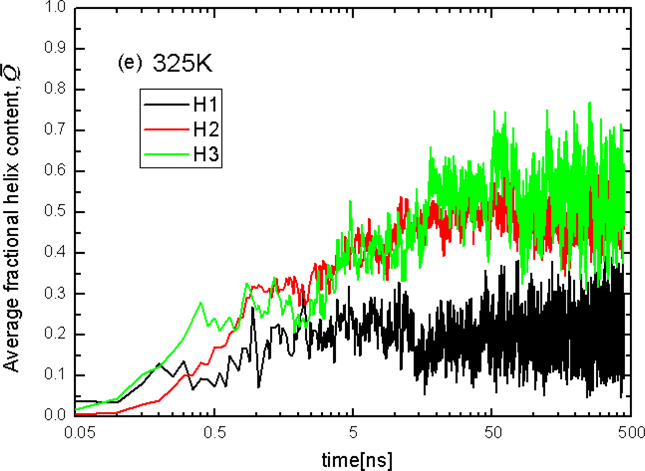
Figure 8 shows plots of the helix content Q̅64 of three helices averaged over the 16 trajectories at T = 270K, 280K, 300K, 310K, and 325K. It can be seen that, at all temperatures, the initial formation (in the first few MD steps) of the N-terminal helix is a bit faster than that of the middle and C-terminal helices, but the helix content of the C-terminal helix overgrows that of the N-terminal helix later, and the maximum helix content of the C-terminal helix is higher than that of middle and N-terminal helices. Figures 8a and 8b show that the middle helix starts forming later than the two end helices at T=270K and 280K (from 0.05 to 0.5ns). The middle helix and the N-terminal helix seem to compete in formation at lower temperatures, especially at 270K; consequently, it is hard to distinguish the differences between the speed of formation of these helices from the plot of averaged Q̅. However, it should be noted that, after 0.5ns, the middle helix starts forming faster and surpasses the N-terminal helix, although the maximum helix content of the middle helix and the N-terminal helix are still very close. To determine the order of helix full-formation, the folding pathways (along with helix content) for each trajectory were examined one by one (rather than in terms of the average value Q̅). The significant number of folding pathways with different orders of helix formation was observed at 270K and 280K; however, the order of formation of full helices: C-terminal helix, N-terminal helix, and the middle helix is slightly more probable than the other orders. This scenario of formation of the helices observed in Figures 8a and 8b agrees with the shortest path found at 270K and 280K (Figures 2C and 3C).
Fig.8.
Plots of the averaged helix content (Q̅) of the N-terminal helix(H1), middle helix(H2), and C-terminal helix(H3), averaged over the 16 trajectories at T=270K(a), 280K(b), 300K(c), 310K(d), and 325K(e).
It can be seen from Figs. 8c and 8d that, even though the N-terminal helix starts forming faster than the middle helix at the beginning, the helix content of the middle helix quickly overgrows that of the N-terminal helix, which shows that the whole middle helix forms before the N-terminal helix. Therefore, at T = 300K and 310K, the most probable order of formation of helices is the C-terminal helix, the middle helix and the N-terminal helix. This order of formation of the three helices agrees with the shortest path found at T=300K and 310K (Figures 4C and 5C). At all temperatures, the order of formation of helices, reflected in the plot of the helix content (Fig. 8 a–d), is consistent with the shortest path found in the CSN, which demonstrates that the shortest path identified by using the shortest-path algorithm corresponds to the most probable folding pathway in the conformational space network.
Figure 8e shows that none of the three helices are fully formed at the melting temperature of 325K. Based on the results illustrated in Figure 8, the order of stability of helices at all temperatures is the following: C-terminal helix, middle helix and N-terminal helix. This sequence of stability is in harmony with earlier experimental data.30
From the most probable pathways at T = 270K, 280K, 300K, and 310K, it can be seen that the C-terminal helix always fully forms first at these temperatures, which agrees with some of the earlier experimental30 and theoretical31,34–36,41,43,44 studies. Investigating the folding of protein A by different experimental methods, Bai et al.30 detected early formation of the C-terminal helix and the middle helix. Alonso and Daggett31 studied the unfolding process of protein A with all-atom molecular dynamics simulations in explicit solvent, and found that the C-terminal helix denatured later than the N-terminal helix and the middle helix, which suggested that the C-terminal helix forms earlier than the other two helices. Ghosh et al.34 computed the folding pathways of protein A with the stochastic difference equation and found that the C-terminal helix forms first, followed by the N-terminal helix and then the middle helix. Jang et al.35 investigated the folding process of protein A with all-atom MD simulation in implicit solvent and found that the C-terminal helix forms first in the early stage of folding. Garcia and Onuchic36 performed all-atom replica exchange molecular dynamics simulations with an explicit solvent to study the folding mechanism of protein A, and found that the C-terminal helix forms first, followed by the middle helix and then the N-terminal helix. Khalili et al.41,43 carried out MD simulations with the UNRES force field to study the folding pathways of protein A and found that the order of helix formation is the C-terminal helix, the N-terminal helix, and the middle helix. Jagielska and Scheraga44 used all-atom MD simulations in implicit solvent at different temperatures to investigate the folding of protein A, and found that the middle helix forms significantly later than the C-terminal helix and later than the N-terminal helix at lower temperature. They also found that, with increasing temperature, the speed of formation of the middle helix increases, and at higher temperatures the middle helix forms right after the formation of the other two helices. Since the same force field was used at each temperature in Ref. 44, the authors were able to conclude that the order of helix formation in protein A depends on the temperature used in the experimental, and theoretical studies with a given force field.
However, the folding pathways found in this paper do not agree with some other experimental39 and theoretical28,29,42 studies, which observed the early formation of the middle helix. Sato et al.39 used experimental Φ values to analyze the transition state for folding of protein A and found that the middle helix forms before the C-terminal and N-terminal helices. Brooks and coworkers28,29 examined the free-energy landscape of protein A with umbrella sampling and concluded that the C-terminal helix forms after the formation of the N-terminal helix and the middle helix. Cheng et al.42 carried out all-atom MD simulations for the folding of protein A in implicit solvent and found that the middle helix forms first, followed by the N-terminal helix, and then the C-terminal helix.
It should be noted that, in the present work, the middle helix was found to form before the N-terminal and the C-terminal helices in several trajectories at T = 300K and 310K, but this pathway was not the dominant one in the 16 trajectories from which the CSN were built; consequently, it was not identified by the shortest-path algorithm. Figure 8 illustrates the tendency of the middle helix to be formed faster with the increase of temperature. Also, as concluded in Ref. 44, the folding pathways can change with the change of temperature. Since the temperature has a different meaning for each force field, and different force fields were used in the computations of Refs. 28, 29, 42 and 44, it is not possible to attribute the discrepancies among Refs. 28, 29, 42 and 44 simply to possible differences in temperature.
The rmsd of protein A (averaged over 16 trajectories for each temperature) as a function of average helix content Q̅ over three helices (and over 16 trajectories for each temperature) illustrates the coupling between secondary and tertiary structure formation (see Fig. 9). In particular, the rmsd decreases with growing Q̅ at all temperatures, thus secondary structure and tertiary structure form simultaneously, which is consistent with the results reported earlier.31,36,39,42,44 It should be noted that at lower temperatures (T=270K and 280K) rmsd decreases linearly with increasing Q̅, whereas at higher temperatures (T=300K, 310K, and 325K) rmsd decreases fast first and then slowly later. Such behavior of rmsd at higher temperatures indicates that, with the increase of temperature, the tertiary structure starts forming faster than secondary structure.
Fig.9.
Plot of rmsd of the whole molecule (averaged over 16 trajectories for each temperature) vs. average helix content (Q̅) over three helices (and over 16 trajectories for each temperature). The rmsd is divided by the number of residues to keep it in the same range as Q̅.
Conclusions
In spite of many studies performed on protein A, to the best of our knowledge, the folding dynamics of protein A was investigated by an unbiased approach, the conformational space network, for the first time, enabling us to identify the large spectrum of folding pathways, hidden in the FELs along the order parameters, at different temperatures. Moreover, it was shown that the folding pathway changes with temperature for a given force field, as also concluded in Ref. 44.
In detail, our findings are the following:
At lower temperatures (270K and 280K), protein A can fold either directly following the downhill folding scenario or through an indirect route involving an intermediate (kinetic trap). The order of full formation of helices calculated by the shortest-path algorithm during the folding dynamics at T = 270K and 280K is the following: C-terminal helix, N-terminal helix and middle helix, which agrees with the pathway shown by the plot of the time dependence of the helix content of the three helices. However, it should be noted that the formation of the N-terminal and the middle helices occurs almost simultaneously; even in the interval of 0.5ns to 5ns, the middle helix forms faster than the N-terminal helix. In downhill folding, the middle helix fully forms after the protein jumps to the native basin. In the folding pathway through the kinetic trap the middle helix forms in the kinetic trap.
The kinetic trap disappears at higher temperatures (300K and 310K) and protein A follows downhill folding. The order of formation of helices calculated by the shortest-path algorithm during the folding dynamics at T = 300K and 310K is the following: the C-terminal helix, the middle helix, and the N-terminal helix, which is different from the order at lower temperature. This pathway agrees with the pathway shown by the plot of the time dependence of the helix content of the three helices. At higher temperatures, the protein does not always jump to the native basin with all helices fully-formed, which is also observed at lower temperatures. In particular, the N-terminal helix forms fully either in the native basin or before reaching the native basin at higher temperatures.
At the folding-transition temperature (325K), none of the three helices are fully formed, and the conformational ensemble of protein A is a collection of residually folded structures and not a 50-50% mixture of native and non-native conformations.45
Acknowledgements
This work was supported by grants from the National Institutes of Health (GM-14312) and the National Science Foundation (MCB-1019767), and conducted by using the resources of (a) our 588-processor Beowulf cluster at the Baker Laboratory of Chemistry and Chemical Biology, Cornell University, (b) the National Science Foundation Terascale Computing System at the Pittsburgh Supercomputer Center, (c) the John von Neumann Institute for Computing at the Central Institute for Applied Mathematics, Forschungszentrum Juelich, Germany, (d) the Beowulf cluster at the Department of Computer Science, Cornell University, (e) the Informatics Center of the Metropolitan Academic Network (IC MAN) in Gdańsk, and (f) the Interdisciplinary Center of Mathematical and Computer Modeling (ICM) at the University of Warsaw.
Appendix
The structures are classified based on levels of description (Table 119). Level 1 describes elementary fragments, which are usually identified as elementary units with defined secondary structure in the experimental structure (e.g., single α -helices, β -strands or β -hairpins, etc.) or are characterizable by other means (e.g., loops). For protein A, the elementary fragments are α -helices.
The elementary fragments are defined as follows:
An α -helix is a fragment in which (i) all of the virtual-bond dihedral angles γ are within 30° ≤ γ ≤ 60° and (ii) every peptide group is in electrostatic contact with its third neighbor. Two peptide groups are considered to be in electrostatic contact if their average electrostatic interaction energy is lower than −0.3 kcal/mol.
A two-stranded antiparallel β -sheet is a fragment in which (i) all virtual-bond dihedral angles γ except those at turn residues are greater in absolute value than 90° and (ii) an electrostatic-contact pattern characteristic of an antiparallel β -sheet is observed (i.e., if peptide group i is in electrostatic contact with peptide group j, then peptide group i + 1 is in electrostatic contact with peptide group j − 1, etc). This type of element can involve either a contiguous part of the chain (a β -hairpin) or a noncontiguous part.
A two-stranded parallel β -sheet is a fragment in which (i) all virtual-bond dihedral angles γ are greater in absolute value than 90° and (ii) an electrostatic-contact pattern characteristic of a parallel β -sheet is observed (i.e., if peptide group i is in electrostatic contact with peptide group j, then peptide group i + 1 is in electrostatic contact with peptide group j + 1, etc). This type of element always involves two noncontiguous parts of the chain.
A strand is a fragment in which (i) all virtual-bond dihedral angles γ are greater in absolute value than 90° and (ii) an electrostatic-contact pattern characteristic of a single chain in a parallel or antiparallel β -sheet is observed.
An elementary fragment with irregular structure is identified based on the values of the virtual-bond-valence, virtual-bond-dihedral angles, as well as the local geometry of the side-chain center.
The above definitions do not exhaust all possibilities; one is free to define other types of structural elements such as, for example, a 310 -helix, a β -helix, or a collagen helix.
The elementary fragments are compared as follows:
The secondary structure is considered native if at least 70% of the chain of the considered conformation has the same secondary structure as in the native conformation. In Table 1,19 a “1” in level 1 corresponds to native secondary structure.
The hydrogen-bonding contact pattern is considered native if the number of contacts between the peptide groups in the compared structure matching the native peptide group contacts is greater than 70% of the native contacts (this is called a match). Shifting the sequence by ±3 residues is allowed to obtain a match but it results in a decreasing class number. In a β -hairpin, such a shift corresponds to shifting the position of the β -turn. In Table 1, a “2” in level 1 corresponds to native hydrogen-bonding contacts after a sequence shift, and a “6” in level 1 corresponds to native hydrogen-bonding contacts only without a sequence shift.
Level 2 consists of pairs of elementary fragments. Each class number in level 2 represents the packing between a given pair of elementary fragments. In level 2 of protein A, only two class numbers (each of which could be any of the three numbers in level 2 of Table 1) are used. The first number corresponds to the packing between the N-terminal helix and the C-terminal helix. The second number corresponds to the packing between the middle helix and the C-terminal helix.
The packing of elementary fragments is compared as follows:
The number of side-chain contacts (for helix-to-helix packing and helix-to-strand packing), or the number of peptide-group contacts (for β -strand packing) corresponding to the native contact between a given pair of fragments is computed. If it is greater than 70% of the native contacts, the packing is considered native. Shifting the sequence by ±3 residues is allowed to obtain a match.
The rmsd of the segment consisting of the compared pair of fragments from the corresponding fragment of the experimental structure is computed. If the rmsd is less than the threshold value (0.1 Å per residue), the segment is considered to be geometrically conformable with the native segment.
If conditions 1 and 2 hold, then the packing is considered to be native-like; otherwise it is considered to be non-native. In Table 1, a “2” in level 2 corresponds to native packing without a sequence shift.
Level 3 pertains to the whole molecule. A single number from the ones in level 3 of Table 1 of the class code represents the whole molecule. If the rmsd value of the whole molecule is lower than a cutoff value (5.0 Å for protein A in this work, but different for each protein), an rmsd match is obtained. In Table 1, a “2” in level 3 corresponds to an rmsd match without a sequence shift.
References
- 1.Frauenfelder H, Sligar SG, Wolynes PG. The energy landscapes and motions of proteins. Science. 1991;254:1598–1630. doi: 10.1126/science.1749933. [DOI] [PubMed] [Google Scholar]
- 2.Wales DJ, Scheraga HA. Global optimization of clusters, crystals, and biomolecules. Science. 1999;285:1368–1372. doi: 10.1126/science.285.5432.1368. [DOI] [PubMed] [Google Scholar]
- 3.Brooks CL, III, Onuchic JN, Wales DJ. Taking a walk on a landscape. Science. 2001;293:612–613. doi: 10.1126/science.1062559. [DOI] [PubMed] [Google Scholar]
- 4.Wales DJ. Energy landscapes. Cambridge, UK: Cambridge University Press; 2003. p. 681. [Google Scholar]
- 5.Krivov S, Karplus M. Hidden complexity of free energy surfaces for peptide (protein) folding. Proc. Natl. Acad. Sci. USA. 2004;101:14766–14770. doi: 10.1073/pnas.0406234101. [DOI] [PMC free article] [PubMed] [Google Scholar]
- 6.Altis A, Otten M, Nguyen PH, Hegger R, Stock G. Construction of the free energy landscape of biomolecules via dihedral angle principal component analysis. J. Chem. Phys. 2008;128:245102. doi: 10.1063/1.2945165. [DOI] [PubMed] [Google Scholar]
- 7.Maisuradze GG, Liwo A, Scheraga HA. How adequate are one-and two-dimensional free energy landscapes for protein folding dynamics? Phys. Rev. Lett. 2009;102:238102. doi: 10.1103/PhysRevLett.102.238102. [DOI] [PMC free article] [PubMed] [Google Scholar]
- 8.Maisuradze GG, Liwo A, Scheraga HA. Relation between free energy landscapes of proteins and dynamics. J. Chem. Theory Comput. 2010;6:583–595. doi: 10.1021/ct9005745. [DOI] [PMC free article] [PubMed] [Google Scholar]
- 9.Hegger R, Altis A, Nguyen PH, Stock G. How complex is the dynamics of peptide folding? Phys. Rev. Lett. 2007;98 doi: 10.1103/PhysRevLett.98.028102. 028102. [DOI] [PubMed] [Google Scholar]
- 10.Zhou R, Berne BJ, Germain R. The free energy landscape for β hairpin folding in explicit water. Proc. Natl. Acad. Sci. USA. 2001;98:14931–14936. doi: 10.1073/pnas.201543998. [DOI] [PMC free article] [PubMed] [Google Scholar]
- 11.Zhou R, Parida L, Kapila K, Mudur S. PROTERAN: animated terrain evolution for visual analysis of patterns in protein folding trajectory. Bioinformatics. 2007;23:99–106. doi: 10.1093/bioinformatics/btl538. [DOI] [PubMed] [Google Scholar]
- 12.Newman MEJ. The structure and function of complex networks. SIAM Rev. 2003;45:167–256. [Google Scholar]
- 13.Krivov S, Karplus M. Free energy disconnectivity graphs: Application to peptide models. J. Chem. Phys. 2002;117:10894–10903. [Google Scholar]
- 14.Rao F, Caflisch A. The protein folding network. J. Mol. Biol. 2004;342:299–306. doi: 10.1016/j.jmb.2004.06.063. [DOI] [PubMed] [Google Scholar]
- 15.Gfeller D, De Los Rios P, Caflisch A, Rao F. Complex network analysis of free-energy landscapes. Proc. Natl. Acad. Sci. USA. 2007;104:1817–1822. doi: 10.1073/pnas.0608099104. [DOI] [PMC free article] [PubMed] [Google Scholar]
- 16.Stillinger F, Weber T. Hidden structure in liquids. Phys. Rev. A. 1983;28:2408–2416. [Google Scholar]
- 17.Rao F, Karplus M. Protein dynamics investigated by inherent structure analysis. Proc. Natl. Acad. Sci. USA. 2010;107:9152–9157. doi: 10.1073/pnas.0915087107. [DOI] [PMC free article] [PubMed] [Google Scholar]
- 18.Liwo A, Arlukowicz P, Czaplewski C, Oldziej S, Pillardy J, Scheraga HA. A method for optimizing potential-energy functions by a hierarchical design of the potential-energy landscape: Application to the UNRES force field. Proc. Natl. Acad. Sci. USA. 2002;99:1937–1942. doi: 10.1073/pnas.032675399. [DOI] [PMC free article] [PubMed] [Google Scholar]
- 19.Oldziej S, Liwo A, Czaplewski C, Pillardy J, Scheraga HA. Optimization of the UNRES force field by hierarchical design of the potential-energy landscape. 2. Off-lattice tests of the method with single proteins. J. Phys. Chem. B. 2004;108:16934–16949. [Google Scholar]
- 20.Gouda H, Torigoe H, Saito A, Sato M, Arata Y, Shimada I. Three-dimensional solution structure of the B domain of staphylococcal protein A: comparisons of the solution and crystal structures. Biochemistry. 1992;31:9665–9672. doi: 10.1021/bi00155a020. [DOI] [PubMed] [Google Scholar]
- 21.Liwo A, Pincus MR, Wawak RJ, Rackovsky S, Scheraga HA. Prediction of protein conformation on the basis of a search for compact structure: Test on avian pancreatic polypeptide. Protein Sci. 1993;2:1715–1731. doi: 10.1002/pro.5560021016. [DOI] [PMC free article] [PubMed] [Google Scholar]
- 22.Liwo A, Oldziej S, Pincus MR, Wawak RJ, Rackovsky S, Scheraga HA. A united-residue force field for off-lattice protein-structure simulations. I. Functional forms and parameters of long-range side-chain interaction potentials from protein crystal data. J. Comput. Chem. 1997;18:849–873. [Google Scholar]
- 23.Liwo A, Pincus MR, Wawak RJ, Rackovsky S, Oldziej S, Scheraga HA. A united-residue force field for off-lattice protein-structure simulation. II: Parameterization of local interactions and determination of the weights of energy terms by Z-score optimization. J. Comput. Chem. 1997;18:874–887. [Google Scholar]
- 24.Ołdziej S, Kozłowska U, Liwo A, Scheraga HA. Determination of the potentials of mean force for rotation about Cα…Cα virtual bonds in polypeptides from the ab initio energy surfaces of terminally-blocked glycine, alanine, and proline. J. Phys. Chem. A. 2003;107:8035–8046. [Google Scholar]
- 25.Liwo A, Oldziej S, Czaplewski C, Kozlowska U, Scheraga HA. Parametrization of backbone-electrostatic and multibody contributions to the UNRES force field for protein-structure prediction from ab initio energy surfaces of model systems. J. Phys. Chem. B. 2004;108:9421–9438. [Google Scholar]
- 26.Oldziej S, Lagiewka J, Liwo A, Czaplewski C, Chinchio M, Nanias M, Scheraga HA. Optimization of the UNRES force field by hierarchical design of the potential-energy landscape. 3. Use of many proteins in optimization. J. Phys. Chem. B. 2004;108:16950–16959. [Google Scholar]
- 27.Liwo A, Khalili M, Czaplewski C, Kalinowski S, Oldziej S, Wachucik K, Scheraga HA. Modification and optimization of the united-residue (UNRES) potential energy function for canonical simulations. I. Temperature dependence of the effective energy function and tests of the optimization method with single training proteins. J. Phys. Chem. B. 2007;111:260–285. doi: 10.1021/jp065380a. [DOI] [PMC free article] [PubMed] [Google Scholar]
- 28.Boczko EM, Brooks CL., III First principles calculation of the free energy surface for folding of a three helix bundle protein. Science. 1995;269:393–396. doi: 10.1126/science.7618103. [DOI] [PubMed] [Google Scholar]
- 29.Guo Z, Brooks CL, III, Boczko EM. Exploring the folding free energy surface of a three-helix bundle protein. Proc. Natl. Acad. Sci. USA. 1997;94:10161–10166. doi: 10.1073/pnas.94.19.10161. [DOI] [PMC free article] [PubMed] [Google Scholar]
- 30.Bai Y, Karimi A, Dyson HJ, Wright PE. Absence of a stable intermediate on the folding pathway of Protein A (B domain) Protein Sci. 1997;6:1449–1457. doi: 10.1002/pro.5560060709. [DOI] [PMC free article] [PubMed] [Google Scholar]
- 31.Alonso DOV, Daggett V. Staphylococcal protein A: Unfolding pathways, unfolded states, and differences between the B and E domains. Proc. Natl. Acad. Sci. USA. 2000;97:133–138. doi: 10.1073/pnas.97.1.133. [DOI] [PMC free article] [PubMed] [Google Scholar]
- 32.Berriz GF, Shakhnovich EI. Characterization of the folding kinetics of a three-helix bundle protein via a minimalist Langevin model. J. Mol. Biol. 2001;310:673–685. doi: 10.1006/jmbi.2001.4792. [DOI] [PubMed] [Google Scholar]
- 33.Myers JK, Oas TG. Preorganized secondary structure as an important determinant of fast protein folding. Nat. Struct. Biol. 2001;8:552–558. doi: 10.1038/88626. [DOI] [PubMed] [Google Scholar]
- 34.Ghosh A, Elber R, Scheraga HA. An atomically detailed study of the folding pathways of protein A with the stochastic difference equation. Proc. Natl. Acad. Sci. USA. 2002;99:10394–10398. doi: 10.1073/pnas.142288099. [DOI] [PMC free article] [PubMed] [Google Scholar]
- 35.Jang S, Kim E, Shin S, Pak Y. Ab initio folding of helix bundle proteins using molecular dynamics simulations. J. Am. Chem. Soc. 2003;125:14841–14846. doi: 10.1021/ja034701i. [DOI] [PubMed] [Google Scholar]
- 36.Garcia AE, Onuchic JN. Folding a protein in a computer: An atomic description of the holding/unfolding of protein A. Proc. Natl. Acad. Sci. USA. 2003;100:13898–13903. doi: 10.1073/pnas.2335541100. [DOI] [PMC free article] [PubMed] [Google Scholar]
- 37.Vila JA, Ripoll DR, Scheraga HA. Atomically detailed folding simulation of the B domain of staphylococcal protein A from random structures. Proc. Natl. Acad. Sci. USA. 2003;100:14812–14816. doi: 10.1073/pnas.2436463100. [DOI] [PMC free article] [PubMed] [Google Scholar]
- 38.Dimitriadis G, Drysdale A, Myers JK, Arora P, Radford SE, Oas TG, Smith DA. Microsecond folding dynamics of the F13W G29A mutant of the B domain of staphylococcal protein A by laser-induced temperature jump. Proc. Natl. Acad. Sci. USA. 2004;101:3809–3814. doi: 10.1073/pnas.0306433101. [DOI] [PMC free article] [PubMed] [Google Scholar]
- 39.Sato S, Religa TL, Daggett V, Fersht AR. Testing protein-folding simulations by experiment: B domain of protein A. Proc Natl. Acad. Sci. USA. 2004;101:6952–6956. doi: 10.1073/pnas.0401396101. [DOI] [PMC free article] [PubMed] [Google Scholar]
- 40.Liwo A, Khalili M, Scheraga HA. Ab initio simulations of protein-folding pathways by molecular dynamics with the united-residue model of polypeptide chains. Proc. Natl. Acad. Sci. USA. 2005;102:2362–2367. doi: 10.1073/pnas.0408885102. [DOI] [PMC free article] [PubMed] [Google Scholar]
- 41.Khalili M, Liwo A, Jagielska A, Scheraga HA. Molecular dynamics with the United-Residue model of polypeptide chains. II. Langevin and Berendsen-Bath dynamics and tests on model α-helical systems. J. Phys. Chem. B. 2005;109:13798–13810. doi: 10.1021/jp058007w. [DOI] [PMC free article] [PubMed] [Google Scholar]
- 42.Cheng S, Yang Y, Wang W, Liu HJ. Transition state ensemble for the folding of B domain of protein A: A comparison of distributed molecular dynamics simulation with experiments. J. Phys. Chem. B. 2005;109:23645–23654. doi: 10.1021/jp0517798. [DOI] [PubMed] [Google Scholar]
- 43.Khalili M, Liwo A, Scheraga HA. Kinetic studies of folding of the B-domain of staphylococcal protein A with molecular dynamics and a united-residue (UNRES) model of polypeptide chains. J. Mol. Biol. 2006;355:536–547. doi: 10.1016/j.jmb.2005.10.056. [DOI] [PubMed] [Google Scholar]
- 44.Jagielska A, Scheraga HA. Influence of temperature, friction, and random forces on folding of the B-domain of staphylococcal protein A: All-atom molecular dynamics in implicit solvent. J. Comput. Chem. 2007;28:1068–1082. doi: 10.1002/jcc.20631. [DOI] [PubMed] [Google Scholar]
- 45.Maisuradze GG, Liwo A, Oldziej S, Scheraga HA. Evidence, from simulations, of a single state with residual native structure at the thermal denaturation midpoint of a small globular protein. J. Am. Chem. Soc. 2010;132:9444–9452. doi: 10.1021/ja1031503. [DOI] [PMC free article] [PubMed] [Google Scholar]
- 46.Berendsen HJC, Postma JPM, van Gunsteren WF, Dinola A, Haak JR. Molecular dynamics with coupling to an external bath. J. Chem. Phys. 1984;81:3684–3690. [Google Scholar]
- 47.Gibson D, Kleinberg J, Raghavan P. Inferring web communities from link topology. New York: ACM Press; 1998. [Google Scholar]
- 48.Newman MEJ. The structure of scientific collaboration networks. Proc. Natl. Acad. Sci. USA. 2001;98:404–409. doi: 10.1073/pnas.021544898. [DOI] [PMC free article] [PubMed] [Google Scholar]
- 49.Barabasi AL, Oltvai ZN. Network biology: understanding the cell’s functional organizations. Nat. Rev. Genet. 2004;5:101–113. doi: 10.1038/nrg1272. [DOI] [PubMed] [Google Scholar]
- 50.Girvan M, Newman MEJ. Community structure in social and biological networks. Proc. Natl. Acad. Sci. USA. 2002;99:7821–7826. doi: 10.1073/pnas.122653799. [DOI] [PMC free article] [PubMed] [Google Scholar]
- 51.Clauset A, Newman MEJ, Moore C. Finding community structure in very large networks. Phys. Rev. E. 2004;70 doi: 10.1103/PhysRevE.70.066111. 066111. [DOI] [PubMed] [Google Scholar]
- 52.Van Dongen S. PhD thesis. University of Utrecht; 2000. May, Graph clustering by flow simulation. [Google Scholar]
- 53.Enright AJ, Van Dongen S, Ouzounis CA. An efficient algorithm for large scale detection of protein families. Nucleic Acids Res. 2002;30:1575–1584. doi: 10.1093/nar/30.7.1575. [DOI] [PMC free article] [PubMed] [Google Scholar]
- 54.Ohgushi M, Wada A. “Molten-globule state”: a compact form of globular proteins with mobile side-chains. FEBS Lett. 1983;164(1):21–24. doi: 10.1016/0014-5793(83)80010-6. [DOI] [PubMed] [Google Scholar]
- 55.Bondy JA, Murty USR. Graph Theory with Applications. London: Macmillan; 1976. [Google Scholar]
- 56.Harary F. Graph Theory. Cambridge, MA: Perseus; 1995. [Google Scholar]
- 57.Bollobas B. Modern Graph Theory. New York, NY: Springer; 1998. [Google Scholar]
- 58.Bellman Richard. On a Routing Problem. Quarterly of Applied. Mathematics. 1958;16(1):87–90. [Google Scholar]
- 59.Dijkstra EW. A note on two problems in connexion with graphs. Numerische Mathematik. 1959;1:269–271. [Google Scholar]
- 60.Floyd RW. Algorithm 97: Shortest Path. Communications of the ACM. 1962;5(6):345. [Google Scholar]
- 61.Hart PE, Nilsson NJ, Raphael B. Correction to "A Formal Basis for the Heuristic Determination of Minimum Cost Paths". SIGART Newsletter. 1972;37:28–29. [Google Scholar]
- 62.Newman MEJ. Scientific collaboration networks. II. Shortest paths, weighted networks, and centrality. Phys. Rev. E. 2001;64 doi: 10.1103/PhysRevE.64.016132. 016132. [DOI] [PubMed] [Google Scholar]
- 63.Privalov PL, Khechinashvili NN. A thermodynamic approach to the problem of stabilization of globular protein structure: a calorimetric study. J. Mol. Biol. 1974;86:665–684. doi: 10.1016/0022-2836(74)90188-0. [DOI] [PubMed] [Google Scholar]
- 64.Eastwood MP, Hardin C, Luthey-Schulten Z, Wolynes PG. Statistical mechanical refinement of protein structure prediction schemes: Cumulant expansion approach. J. Chem. Phys. 2002;117:4602–4615. [Google Scholar]


