Homocysteine is a risk factor for disorders including cardiovascular1 and Alzheimer's disease.2 Cysteine deficiency is involved in slowed growth, hair depigmentation, edema, lethargy, liver damage, muscle and fat loss, skin lesions, and weakness.3 The detection of important biological thiols including cysteine and homocysteine has been the focus of numerous research efforts.4 The majority of the reported methods are based on redox chemistry or derivatization with chromophores or fluorophores. The determination of specific thiols is often carried out in conjunction with HPLC or capillary electrophoresis separations or via immunoassays.4 Recent reports describe a need for much simpler methods that employ stable, nontoxic reagents5a,b which are less sensitive to pH5c and afford the requisite sensitivity5d,6a as well as high selectivity.6b
We have reported prior progress toward the colorimetric and fluorimetric detection of mono- and oligosaccharides.7 Our studies featured new functionalized xanthenes which we found arose in situ from ring-opened resorcinarenes and related materials.7c Our interest in the title compounds derives initially from the interference of cysteine with known sialic acid determinations.8 Herein we report the use of xanthene dye 19 for the efficient detection of cysteine and homocysteine.
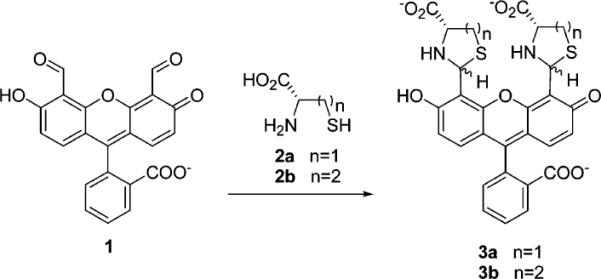
The selective reaction of aldehydes with N-terminal cysteines to form thiazolidines has been used to label and immobilize peptides and proteins.10 Compound 1 was employed as an intermediate toward the synthesis of a fluorescent sensor for zinc.9 We reasoned that the reaction of the aldehyde moieties of 1 with cysteine or homocysteine would promote readily monitored colorimetric and fluorometric responses (Scheme 1).
Scheme 1.

We find that upon addition of l-cysteine or l-homocysteine (1.0 × 10⁻³ M) to a solution of 1 (1.0 × 10⁻⁶ M, H2O, pH 9.5), a solution color change from bright yellow to brownish-orange is observed. Similar color changes are observed on C18-bonded silica (Figure 1). UV–vis absorbance changes of cysteine-1 solutions, readily monitored in the 10−5–10−6 M cysteine concentration range, exhibit a 25 nm red shift.11–13 Addition of 2a or 2b to solutions of 1 results in fluorescence quenching.13
Figure 1.

(Left) Color changes of solutions of 1 and various analytes. A, no analyte; B, l-cysteine; C, l-homocysteine; D, bovine serum albumin; E, l-glycine; and F, n-propylamine. (Right) Co-spots of 1 (1.0 × 10⁻³ M) with and without various analytes (1.0 × 10⁻³ M) under visible and UV light.
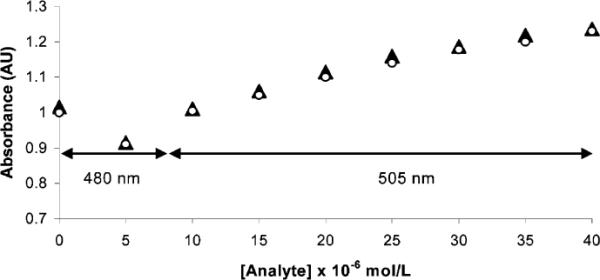
Respective solutions of 1 containing identical concentrations of 2a and 2b exhibit similar spectrophotometric changes (Figure 2). UV–vis spectra of solutions containing 1 and other common thiols (l-methionine, mercaptoethanol, glutathione), other amino acids (l-glutamine, l-serine, l-glycine, l-glutamic acid), and amines (d-glucosamine hydrochloride and n-propylamine (8.0 × 10⁻⁴ M, pH 9.5) confirm the selectivity of 1 for cysteine and homocysteine.13
Figure 2.

Absorbance vs concentration plots for l-cysteine (▲) or l-homocysteine (◯) in aqueous solutions of 1 (2.5 × 10⁻⁶ M) at pH 9.5. The figure highlights the similarity of the absorbance responses of 1 to 2a and 2b. An absorbance decrease is shown at 480 nm for 2a and 2b at 5.0 × 10⁻⁶ M concentrations, while the absorbance increase is shown at 505 nm for increasing concentrations of 2a and 2b from 10 × 10−6 to 40 × 10−6 M.
At most a 15% change in absorbance at 480 nm is observed in response to the aforementioned analytes. No wavelength shift occurs. Solutions containing 1 and bovine serum albumin or urease (8.0 × 10⁻⁴ M, pH 9.5) also exhibit relatively small absorbance (<15%) decreases and no λmax shifts.13
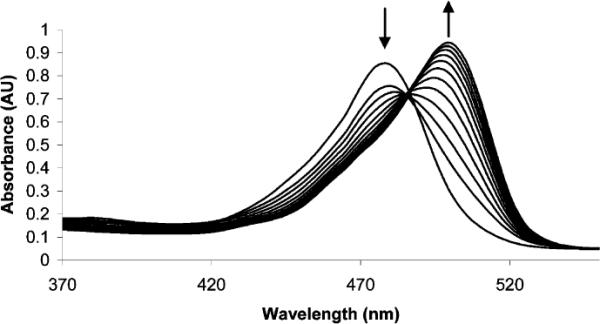
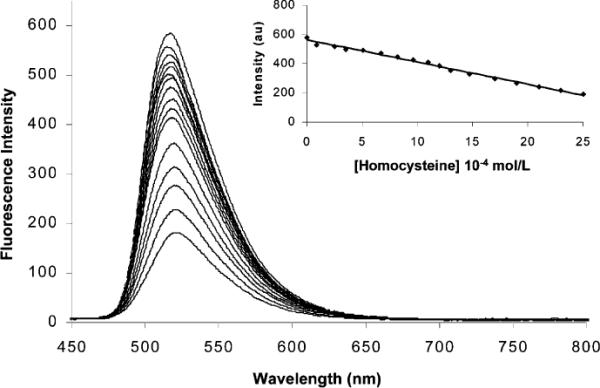
The addition of l-cysteine to a sample of commercial human blood plasma (previously centrifuged at 3000g through a cellulose 3000 MW cutoff filter, the low-molecular-weight fraction is used for analysis), containing 1 and excess glutathione (1.0 mM), results in concentration-dependent UV–vis changes (Figure 3). Figure 4 shows a linear correlation between fluorescence emission intensity and healthy to abnormal homocysteine concentrations in plasma containing 1.6a This demonstrates the potential utility of 1 toward calibrating and determining aminothiol concentrations in plasma samples in the presence of other biological thiols.
Figure 3.

UV–vis spectra of 1 (4 × 10⁻⁶ M) and l-cysteine (4.9 × 10⁻⁵−7.4 × 10⁻⁴ M) in deproteinized human plasma at room temperature containing 1.0 mM added glutathione (pH 9.5). Each spectrum is acquired 5 min after cysteine addition. As the concentration of l-cysteine increases, a red shift from 480 to 500 nm is observed.
Figure 4.

Fluorescence emission spectra of 1 (5.2 × 10⁻⁷ M) and l-homocysteine (2.9 × 10⁻⁶−2.5 10−3 M) in deproteinized human plasma excited at 460 nm (pH 9.5). (Inset) Fluorescence emission plotted vs [2b].
In conclusion, compound 1 can be used to readily detect l-cysteine and l-homocysteine in the range of their physiological levels.6a Interference from amines, amino acids, and certain thiols and proteins is minimal. The methodology shows great promise for the fluorescence and UV–vis detection of aminothiols in plasma.
Supplementary Material
Acknowledgment
We gratefully acknowledge the National Institutes of Health (8R01EB002044-03) for support of this research. We also thank Professor S. J. Lippard and members of his research group at MIT for helpful advice concerning the synthesis of 1 and congeners.
Footnotes
Supporting Information Available: UV–vis and fluorescence spectra of 1, 2a,b, and 3a,b in aqueous and plasma solutions, UV–vis spectra of various thiols, aminesf and protein analytes in solutions containing 1, and 1H NMR spectra of 1 and 3a,b (PDF). This material is available free of charge via the Internet at http://pubs.acs.org.
References
- (1).Review: Refsum H, Ueland PM, Nygård O, Vollset SE. Annu. Rev. Med. 1989;49:31. doi: 10.1146/annurev.med.49.1.31.
- (2).Seshadri S, Beiser A, Selhub J, Jacques PF, Rosenberg IH, D'Agostino RB, Wilson PWF. N. Engl. J. Med. 2002;346:476. doi: 10.1056/NEJMoa011613. [DOI] [PubMed] [Google Scholar]
- (3).Shahrokhian S. Anal. Chem. 2001;73:5972. doi: 10.1021/ac010541m. [DOI] [PubMed] [Google Scholar]
- (4).Recent review: Nekrassova O, Lawrence NS, Compton RG. Talanta. 2003;60:1085. doi: 10.1016/S0039-9140(03)00173-5.
- (5).For example: Amarnath V, Amarnath K. Talanta. 2002;56:745. doi: 10.1016/s0039-9140(01)00631-2. Ercal N, Yang P, Aykin N. J. Chromatogr. B. 2001;753:287. doi: 10.1016/s0378-4347(00)00560-0. Ivanov AR, Nazimov IV, Baratova LA. J. Chromatogr. A. 2000;870:433. doi: 10.1016/s0021-9673(99)00947-4. Pasas SA, Lacher NA, Davies MI, Lunte SM. Electrophoresis. 2002;23:759. doi: 10.1002/1522-2683(200203)23:5<759::AID-ELPS759>3.0.CO;2-4.
- (6).(a) Healthy plasma total homocysteine concentrations are ca. 12 μM. Cysteine concentrations are typically 20–30 times that of homocysteine (see refs 1 and 2). (b) The relatively large excess of glutathione present in biological samples can complicate the detection of other less abundant thiols.
- (7).(a) Davis CJ, Lewis PT, McCarroll ME, Read MW, Cueto R, Strongin RM. Org. Lett. 1999;1:331. doi: 10.1021/ol990105a. [DOI] [PubMed] [Google Scholar]; (b) Lewis PT, Davis CJ, Cabell LA, He M, Read MW, McCarroll ME, Strongin RM. Org. Lett. 2000;2:589. doi: 10.1021/ol9903990. [DOI] [PubMed] [Google Scholar]; (c) He M, Johnson R, Escobedo JO, Beck JA, Kim KK, St. Luce NN, Davis C. J.; Lewis PT, Fronczek F. R.; Melancon BJ, Mrse AA, Treleaven WD, Strongin RM. J. Am. Chem. Soc. 2002;124:5000. doi: 10.1021/ja017713h. [DOI] [PMC free article] [PubMed] [Google Scholar]
- (8).Warren L. J. Biol. Chem. 1959;234:1971. [PubMed] [Google Scholar]; (b) We are developing new methods for the detection of sialic acid, an important cell surface residue; see refs 7a and 7c.
- (9).Burdette SC, Walkup GK, Spingler B, Tsien RY, Lippard SJ. J. Am. Chem. Soc. 2001;123:7831. doi: 10.1021/ja010059l. [DOI] [PubMed] [Google Scholar]
- (10).Tolbert TJ, Wong C-H. Angew. Chem., Int. Ed. 2002;41:2171. doi: 10.1002/1521-3773(20020617)41:12<2171::aid-anie2171>3.0.co;2-q. and references therein. Reactions of carbonyls with cysteine and homocysteine: Fourneau JP, Efimovsky O, Gaignault JC, Jacquier R, LeRidant C. C. R. Acad. Sci. Ser. C. 1971;272:1982. Cooper AJL, Meinster A. J. Biol. Chem. 1982;257:816.
- (11).The conversion of 2a and 2b to thiazolidine dicarboxylic acids 3a and 3b is confirmed by 1H NMR. Reaction of 1 with propylamine or glucosamine (1:2 ratio of 1 to analyte, D2O) results in a diminishing aldehyde resonance (10.2 ppm) of 1 and the appearance of imine resonances centered at 9.6 ppm. When 2a or 2b is added to solutions of 1, imine resonances are observed at ca. 9.6 ppm which diminish over time (5 min). New resonances centered at 6.13 and 6.04 ppm appear, which we assign to the methine protons of the thiazolidine diastereomers 3a and 3b, respectively. Complete conversion to bis-thiazolidines 3a and 3b is evidenced by a 2:2 ratio of the integral areas of the new methine protons to the chromophore aromatic proton resonances as well as complete disappearance of the starting aldehyde and intermediate imine resonances. No evidence of aromatic heterocycle formation is observed. The formation of 3a and 3b is also confirmed by mass spectrometry: 3a MALDI TOF MS, calcd for C28H21N2O9S2Na (M + Na)9 618.61, found 618.42; 3b FAB MS, calcd for C30H25N2O9S2Na (M + Na)+ 646.66, found 646.80 (see also Supporting Information).
- (12).We obtain analogous absorption spectra under identical conditions at pH 6.5; however, we observe minor amounts of precipitate.
- (13).See Supporting Information.
- (14).Deproteinization is typically performed before biological thiol analysis: Caussé E, Issac C, Malatray P, Bayle C, Valdiguié P, Salvayre R, Couderc F. J. Chromatogr. A. 2000;895:173. doi: 10.1016/s0021-9673(00)00672-5.
Associated Data
This section collects any data citations, data availability statements, or supplementary materials included in this article.


