

Summary
Gamma-aminobutyric acid (GABA) is the major inhibitory neurotransmitter in the mammalian brain. Once released, it is removed from the extracellular space by cellular uptake catalyzed by GABA transporter proteins. Four GABA transporters (GAT1, GAT2, GAT3 and BGT1) have been identified. Inhibition of the GAT1 by the clinically available anti-epileptic drug tiagabine has been an effective strategy for the treatment of some patients with partial seizures. Recently, the investigational drug EF1502, which inhibits both GAT1 and BGT1, was found to exert an anti-convulsant action synergistic to that of tiagabine, supposedly due to inhibition of BGT1. The present study addresses the role of BGT1 in seizure control and the effect of EF1502 by developing and exploring a new mouse line lacking exons 3–5 of the BGT1 (slc6a12) gene. The deletion of this sequence abolishes the expression of BGT1 mRNA. However, homozygous BGT1-deficient mice have normal development and show seizure susceptibility indistinguishable from that in wild-type mice in a variety of seizure threshold models including: corneal kindling, the minimal clonic and minimal tonic extension seizure threshold tests, the 6 Hz seizure threshold test, and the i.v. pentylenetetrazol threshold test. We confirm that BGT1 mRNA is present in the brain, but find that the levels are several hundred times lower than those of GAT1 mRNA; possibly explaining the apparent lack of phenotype. In conclusion, the present results do not support a role for BGT1 in the control of seizure susceptibility and cannot provide a mechanistic understanding of the synergism that has been previously reported with tiagabine and EF1502.
Keywords: GABA uptake, Epilepsy, Betaine–GABA transporter, SLC6A12, Conditional knockout, EF1502
Introduction
Gamma-aminobutyric acid (GABA) is the major inhibitory neurotransmitter in the adult mammalian brain, and its action is terminated by cellular uptake catalyzed by GABA transporter proteins (Conti et al., 2004; Madsen et al., 2010). Therefore, GABA transporters are highly interesting as targets for the development of anticonvulsant and antiepileptic drugs (Schousboe et al., 2004). The most important GABA transporter subtypes are believed to be GAT1 (slc6a1) and GAT3 (slc6a11). GAT1 is present in axon terminals and in astrocytes, while GAT3 is astrocyte specific (Madsen et al., 2010; Conti et al., 2004). The roles of the two other subtypes, GAT2 (slc6a13) and BGT1 (slc6a12), remain elusive. The taurine transporter (slc6a6) can also transport GABA, but it has a lower affinity and is not believed to contribute to GABA homeostasis.
The GAT1 selective inhibitor tiagabine (Nielsen et al., 1991; Borden et al., 1994) is clinically valuable, but its use is limited by a short half-life and by side effects (dizziness, fatigue, confusion). In fact deletion of the GAT1 gene in mice causes tremor, ataxia and nervousness (Chiu et al., 2005). A better-tolerated GABA uptake inhibitor would therefore be desirable. EF1502 (N-[4,4-bis(3-methyl-2-thienyl)-3-butenyl]-4-(methylamino-4,5,6,7-tetrahydrobenzo [d]isoxazol-3-ol) has approximately equal affinity for GAT1 and BGT1 (Clausen et al., 2005). When (R,S)-EF1502 was co-administered with tiagabine, a synergistic anticonvulsant effect was observed in the absence of enhanced toxicity in the Frings mouse, a model of genetic audiogenic seizures (White et al., 2005). Furthermore, electrophysiological studies determined that (R,S)-EF1502 decreases spontaneous interictal-like bursting frequency in a hippocampal slice model of neuronal network hyper-excitability, while tiagabine fails to do so (Smith et al., 2008). These pharmacological studies suggested that BGT1 is important in seizure control.
However, a number of questions remain unanswered. Despite extensive specificity testing (White et al., 2005), EF1502 may have other targets. Further, it is not clear from the literature where BGT1 is localized. BGT1 mRNA is present in the brain (e.g. López-Corcuera et al., 1992; Borden et al., 1995a), but appears to be at low levels and mostly in the leptomeninges rather than in brain tissue proper (Evans et al., 1996). Further, the affinity of BGT1 for GABA is considerably lower than that of the other GABA transporters (López-Corcuera et al., 1992; Liu et al., 1993). BGT1 mRNA has been detected in cultured astrocytes and in an astrocytoma cell line, but not in cultured neurons (Borden et al., 1995b; Bitoun and Tappaz, 2000; Ruiz-Tachiquin et al., 2002). BGT1 protein has been reported in brain endothelium (Takanaga et al., 2001), in astrocyte and astrocytoma cultures (Olsen et al., 2005; Ruiz-Tachiquin et al., 2002), in pyramidal neurons (but not astrocytes) in untreated rats (Zhu and Ong, 2004a) and in Macaca fascicularis monkeys (Zhu and Ong, 2004b). However, all the immunocytochemical studies appear to be based on antibodies to the carboxy terminal of rat BGT1 and knockout animals were not available as specificity controls. Consequently, it is not known if the reported labeling actually represents BGT1 (Holmseth et al., 2006). Further, quantitative information is lacking.
Here we have generated a new mouse line lacking BGT1 and show that BGT1 is non-essential for survival and does not affect seizure threshold or corneal kindling acquisition. Further, we show that the BGT1 mRNA expression levels are two to three orders of magnitude lower than those of GAT1.
Experimental procedures
Materials
Plastic culture dishes were purchased from NUNC A/S (Roskilde, Denmark) and fetal bovine serum (FBS) from In Vitro A/S (Fredensborg, Denmark). [3H]-Taurine (37 MBq/mL) from PerkinElmer (MA, USA). (R)-EF1502 was synthesized as we described previously (Clausen et al., 2005), while tiagabine was obtained from Cephalon Inc. (Frazer, PA, USA). TaqMan probes and High Capacity cDNA Archive Kit were from Applied Biosystems (Carlsbad, CA, USA). All other reagents were obtained from Sigma–Aldrich (St. Louis, MO, USA) unless otherwise stated.
Animals
All animal experimentation was carried out in accordance with the European Communities Council Directive of 24 November 1986 (86/609/EEC). Formal approval to conduct the experiments described was obtained from the animal subjects review board of the Norwegian Governmental Institute of Public Health (Oslo, Norway). Care was taken to minimize the number of animals used and to avoid suffering.
Mice were housed in individually ventilated (IVC) cages at constant temperature (22 ± 0.7 °C) and relative humidity (56 ± 6%), and with water ad libitum. The cycle of light was 14 h of light and 10 h of darkness. Cages, changed every 2 weeks, were bedded with Nestpaks™ (Datesand LTD, Manchester, UK) and enriched with red huts and wooden sticks. The mice were fed Harlan Teklad 2018 (Harland Laboratories Inc., Indianiapolis, IN, USA). Mice were sacrificed by cervical dislocation.
Floxing of the BGT1 gene
The targeting vector was constructed using the recombineering technique previously described (Liu et al., 2003). A fragment of 5291 bp genomic DNA containing exons 3–5 was floxed to create an out of frame deletion after Cre excision (Fig. 1). The targeting vector was electroporated into D1 ES cells which were derived from F1 hybrid blastocyst of 129S6 × C57BL/6 by the Gene Targeting and Transgenic Facility at the University of Connecticut Health Center (USA). The G418 resistant ES clones were screened by nested PCR using primers outside the construct paired with primers inside the neo cassette. The chimeric mice were generated by aggregating targeted ES cells with 8-cell embryos of CD-1 strain. The neo cassette was removed by breeding germline chimeras with ROSA26FLP1 (Jax stock#: 003946) homozygous females. The ensuing mice, with LoxP sites in the BGT1 gene, are hereafter referred to as “BGT1-flox” mice.
Figure 1.

Generation of the BGT1-flox mice. The gene targeting construct contained exons 1–7 of the BGT1 gene. A loxP sequence (blue arrow) was inserted into intron 2 and an EcoRV (RV) site was created at the front of the loxp site. A frt-PGKneo-frt-loxP cassette was inserted into intron 5 and an endogenous EcoRV (RV) site was deleted. The lengths of the homologous arms and the floxed fragment are indicated below the construct. The black arrows indicate the positions of the primers used for ES cell screening. The neo cassette was removed in the BGT1-flox mice generated from chimera x Rosa26FLP crossing. The genotyping primers are indicated by black arrows below the After FLP excision allele and after Cre excision allele. After Cre excision the DNA encoding amino acid residues 72–193 are deleted. This region is essential for transport activity and there is no transport activity without it (Bismuth et al., 1997; Yamashita et al., 2005). Further, the deletion causes the remaining sequences to be out of frame.
Production of knockout mice
While backcrossing to the C57Bl6 mouse strain, BGT1-flox mice were crossed with Hprt1-Cre (Tang et al., 2002) mice in the C57Bl6 background. The Hprt1-promotor causes Cre-expression and thereby deletion of the BGT1 gene in all cells. The offspring lacking BGT1 completely are hereafter referred to as “BGT1-fKO” mice. These mice have a mixed 129/C57Bl6 genetic background and are in effect conventional knockouts. The experiments in this report are based on these mice when not stated otherwise. All mice used in seizure studies were bred as heterozygotes in order to ensure that wild-types and knockouts were as similar as possible.
While experimenting with the above mice, backcrossing of the BGT1-flox mice was completed (8 generations). The backcrossed mice were then crossed with Nestin11-Cre mice (Cat. no. 003771; The Jackson Laboratory, Bar Harbor, Maine, USA) in the C57Bl6 background to produce conditional BGT1-knockout mice (hereafter referred to as “BGT1-flox × Nestin-Cre”). Nestin11-Cre mice express Cre in the nervous system. The mice used in seizure studies were bred by crossing mice homozygote with respect to flox [BGT1-(flox/flox)] with mice homozygote for flox and heterozygote for Nestin-Cre [BGT1-(flox/flox); Nestin-Cre (0/1)]. Thus, mice deficient in Nestin-Cre (0/0) are referred to as “wild-types” in the context of seizure testing while their littermates containing the Cre-allele are referred to as “knockouts”.
Genotyping
Biopsies from ear or tail were Proteinase K digested and subjected to PCR. The primers to detect the BGT1-flox genotype are 5′ -caggcccttggctaaaagta-3′ and 5′ -acccagagataggctttcct-3′. The expected PCR products are 299 bp for the wild-type allele and 389 bp for the floxed allele. The primers used to detect the knockout allele after Cre excision are 5′ -tgacctcaagctgaatccac-3′ and 5′ -caagcagatatgggaaggct-3′. The expected products were 147 bp for the wild-type allele and 203 bp for knockout the allele.
Animal phenotyping
Data obtained from each individual mouse was tracked using a database (Science Linker AS, Oslo, Norway). Growth curves were made for each genotype by calculating the average bodyweight and the standard error of the mean at 3 day intervals (using software from Science Linker AS). Graphs and best fit curves were made in GraphPad Prism (GraphPad Software, San Diego, CA, USA). Numbers of mice in each litter were tracked to check for possible differences in survival for each genotype as well as for calculation of average number of mice in each litter and their genotype distribution.
Measurement of blood glucose levels
The mice were fasted for 5 h prior to blood sampling with water ad libitum, and blood glucose measured using Glucostrip® (Roche Diagnostics GmbH, Mannheim, Germany) attached to a glucometer (Accu-chek aviva nano by Roche Diagnostics GmbH, Mannheim, Germany).
RNA isolation, cDNA synthesis and TaqMan Assays
Pieces of tissues (5–15 mg) were collected and immediately protected in RNAlater (Ambion), before homogenization and RNA extraction using RNeasy® (Qiagen). The RNA concentration was quantified by using NanoDrop UV spectrometry (NanoDrop Technologies, Wilmington, USA). Two μg RNA were converted into cDNA by using High Capacity cDNA Archive Kit (Applied Biosystems; Carlsbad, CA, USA). BGT1 expression was measured using TaqMan probes (Mm00446665_m1 and Mm00446675_m1) on a 7900HT Fast Real-Time PCR system (Applied Biosystems; Carlsbad, CA, USA). The probes used to detect GAT1 and GAPDH were, respectively, Mm00618601_m1 and Mm03302249_g1. The kidney samples were obtained from whole kidney.
Seizure threshold testing and analysis
The role of BGT1 in seizure control was tested in acute electrical tests (minimal clonic, minimal tonic hindlimb extension, and 6 Hz seizure threshold tests), in a chronic electrical test (corneal kindling acquisition), and in an acute chemical test (i.v. PTZ). Electrical stimulation was done transcorneally with a Woodbury–Davenport stimulator (Woodbury and Davenport, 1952). Prior to the electrical stimulations, a drop of 0.5% tetracaine was applied to the cornea of each mouse, inducing local anesthesia and ensuring good electrical conductivity. Mice were reused after stimulation free periods (two days or longer). The total number of mice involved in the seizure studies was 411 (361 wildtype-type and BGT1-fKO littermates, and 55 BGT1-flox and BGT1-flox × Nestin-Cre) and thereby lower than the sum of all the numbers given in the text.
Corneal kindling
Mice were kindled as described (Matagne and Klitgaard, 1998). Briefly, mice received twice-daily corneal stimulations of 3 mA at 50 Hz for 3 s. Stimulations were at least four hours apart. Mice were considered kindled when displaying five consecutive stage five seizures according to the Racine scale (Racine, 1972). The mean and SEM for time to first seizure, time to kindling, and time to first stage 5 seizure were determined for each of the four groups (male wild-types, male knockouts, female wild-types, and female knockouts). Following the acquisition of kindling, mice were allowed a two-day stimulation free period prior to drug testing, but were stimulated once the day before to ensure they had maintained a kindled state. The drugs (tiagabine and (R)-EF1502) were suspended in vehicle (0.5% methyl cellulose in 0.9% saline) and sonicated for 15 min prior to administration (i.p.) to ensure complete dissolution or a micronized suspension. At the time to peak effect for each drug (1 h for tiagabine, 0.5 h for (R)-EF1502), mice were challenged with the corneal kindling as above. They were scored as protected (seizure score of <4) or not protected, (seizure score ≥4) based on the Racine scoring system (Racine, 1972). To assess difference between wild-type and knockout for males and females we used one-way within-subjects ANOVA. Data from drug studies were analyzed using logistic regression to assess the impact of measured parameters (sex, age, weight, genotype and dose) on seizures.
Minimal clonic and minimal tonic extension thresholds
For minimal clonic and minimal tonic extension tests mice were stimulated at 50 Hz for 0.2 s exactly as described (Otto et al., 2009). Seizure thresholds were determined according to the staircase procedure (Finney, 1971). Briefly, groups of 8 mice each were subjected to various stimulus intensities until at least four points were established between the intensity that failed to induce the desired seizure type and that which induced the desired seizure in 100% of mice. A minimal clonic seizure involves rhythmic jaw and forelimb clonus which may progress to rearing and falling. A tonic hindlimb extension seizure begins with a tonic forelimb extension followed by hindlimb flexion, and finally full hindlimb extension (White, 2002). Data were analyzed using logistic regression to assess the impact of measured parameters (sex, age, genotype and current) on seizures.
6 Hz seizure threshold tests
Mice were stimulated at 6 Hz for 3 s as described (Otto et al., 2009), and seizure thresholds were determined according to the staircase procedure (Finney, 1971). The 6 Hz seizure is characterized by rhythmic jaw and forelimb clonus, immobility, and Straub-tail (Barton et al., 2001). On the day of the drug study, groups of mice (n = 8) were injected with drugs as described above. At the time to peak effect for each drug (1 h for tiagabine, 0.5 h for (R)-EF1502), mice were challenged with the 6 Hz stimulus of 32 mA for 3 s. Mice were scored as protected or not protected in the 6 Hz test by the presence of a clonic seizure. Data were analyzed using logistic regression to assess the impact of measured parameters (sex, age, weight, genotype and dose) on seizures. ED50, the dose that gave 50% seizure among female animals for (R)-EF1502 and for Tiagabine in 6 Hz model, was calculated by logistic regression analysis
I.v. pentylenetetrazol (i.v. PTZ) test
This was done as described (Orloff et al., 1949) using 0.5% heparinized PTZ solution prepared as follows: 250 mg of PTZ and 3.4 mg of dry heparin (140 usp units/mg) were added in 0.9% saline to a total volume of 50 ml. The dose of PTZ (mg/kg bodyweight) infused (i.v.) to produce the first twitch and sustained clonus was recorded. On the day of the drug study, groups of mice (n = 8) received an i.p. injection (0.01 ml/g body weight). EF1502 was suspended in vehicle (0.5% methyl cellulose in 0.9% saline) as described above. The ED97 of (R)-EF1502 determined in the 6 Hz seizure threshold test was used in this test. At the time to peak effect for each drug (0.5 h for (R)-EF1502), mice were challenged with i.v. PTZ. Data were analyzed using hierarchical linear regression to asses the measured parameters (sex, weight, age, genotype, and drug) with time to seizure as outcome. The amount of PTZ infused (mg/kg) to produce the first twitch and full clonus in the i.v. PTZ test was calculated using the formula: (19.95 × infusion time (s) (T))/weight of animal in grams (W). This formula is derived from the calculation of mg/kg PTZ = (T × rate of infusion (ml/min) × mg PTZ/ml × 1000 g)/(60 s × W in grams) = (T × 0.2394 × 5 × 1000)/60 × W = (19.95 × T)/W.
Statistical analysis of seizure data
One-way within-subjects ANOVA
The analysis was performed in R 2.9 (R Development Core Team.: R: A Language and Environment for Statistical Computing. Vienna: R Foundation for Statistical Computing; 2008).
Regression analysis and significance testing
SPSS version 14.0.0 (May 2005) for Windows, SPSS Inc. P-value 0.05 was set as boundary between (statistically) significant and non-significant.
Graphs
Graphs were made in GraphPad Prism version 4.02 (May 17, 2004) for Windows, GraphPad Software, San Diego, CA, USA, (www.graphpad.com).
Testing the effect of EF1502 on [3H]taurine uptake in primary neuronal cell cultures
NMRI mice were obtained from Taconic Europe (Ry, Denmark). Cerebral cortical neurons were obtained from 15-day-old mouse embryos and prepared as described previously (Hertz et al., 1989). After dissociation of the tissue by a mild trypsinization and trituration in a DNase solution containing soybean trypsin inhibitor, cells were plated onto poly-d-lysine-coated 24-well multidishes at a density of 106 cells/mL with 1 ml pr well. Cells were cultured in DMEM supplemented with 10% FBS. To prevent astroglial proliferation cytosine arabinoside were added to a final concentration of 20 μM, 24–48 h after preparation (Hertz et al., 1989).
The uptake of [3H]taurine in the cultured neurons in the presence or absence of beta-alanine and (RS)-EF1502 was investigated essentially as described previously (Larsson et al., 1986). The incubations were carried out at 37 °C in phosphate buffered saline (PBS) containing [3H]taurine with 1 μM cold taurine. The incubations were terminated after 3 min and the cells were solubilized in 0.4 M potassium hydroxide. The amount of protein was determined using Pierce Micro BCA™ assay kit (Thermo Scientific, Rockford, IL, USA) and radioactivity was counted after neutralization with formic acid in Tri-Carb 2900TR liquid scintillation analyzer (PerkinElmer, MA, USA). Uptake of [3H]taurine in the presence of inhibitor was compared to the situation without inhibitor after the uptake was corrected for the amount of protein in the wells and for non-specific binding.
Results
Construction of BGT1 knockout mice
The mice were first tested using PCR to verify that the genomic changes were as intended. DNA from wild-type mice, BGT1-flox mice and BGT1-fKO mice were collected. As shown (Fig. 2) the lengths of the PCR products were as they should be according to the design.
Figure 2.

PCR of genomic DNA. (A) PCR products for (Lane 1) wild-type, (Lane 2) BGT1-flox (homozygotous Flox/Flox), and (Lane 3) BGT1-flox (heterozygotous Flox/WT). Lane 4 shows the 100 bp DNA-ladder. (B) Lane 1 shows the 100 bp DNA-ladder. Lanes 2–5 show PCR products from wild-type mice (Lane 2), heterozygous (Lanes 3 and 4), and homozygous (Lane 5) for the deletion of exons 3–5 in the BGT1 gene.
Breeding and examination of the mice
Heterozygous BGT1-fKO mice bred well, and mice homozygous for the deletion (KO mice) appeared normal. Gross anatomy of the KO mice was normal, but detailed examinations were not performed so minor differences cannot be excluded. Similarly, when caring for the mice, no behavioral differences were noted, but refined behavioral studies were not carried out. No differences in bodyweights between knockout and wild-type mice were observed over the first 100 days after birth (Fig. 3A). Three KO mice and two wild-type mice were kept to get an indication of long term survival. After 25 months, one KO and one wild-type had died leaving two of the three KO mice still alive. The gender and genotype distributions were normal (Fig. 3B and C), giving no indication of prenatal lethality. Knockout mice (homozygous BGT1-fKO) crossed with each other bred well, and their offspring were fertile. Similarly, when BGT1-flox mice were crossed with Nestin11-Cre to conditionally delete BGT1, deletion of BGT1 did neither have any impact on gender distribution (50.5% females and 49.5% males) nor growth curves (data not shown), and the genotype frequencies were: 18.1% knockout, 55.3% heterozygous, 18.1% wild-type, 8.5% not genotyped.
Figure 3.

Growth curves and breeding data for BGT1-fKO mice. (A) Bodyweights (average for 3-day intervals) were plotted according to sex and genotype as indicated. The average numbers of mice tested for each data point were n = 29 for female knockout mice and n = 30 for wild-type mice and male knockout mice. There are no significant differences between wild-type and knockout mice (P-values t-test: females = 0.479, males = 0.327). (B) A total of 972 mice were born. Males represented 51.3% while females represented 46.4%. Gender information is missing on some mice (2.3%). (C) The distribution of homozygous knockout, heterozygous (H) and homozygous wild-type were almost exactly 1:2:1 (22.4% knockout, 45.6% heterozygotous, 22.7% wild-type, 9.3% not genotyped). In conclusion, deletion of the BGT1 gene had no effect on growth and breeding. There was no increased mortality within the age span studied (0–100 days).
Because neurotransmitter transporters have been reported in pancreatic islets of Langerhans (Gammelsaeter et al., 2004), blood glucose levels were measured in BGT1-fKO and in wild-type mice after 5 h of fasting. Mean blood glucose levels ± SEM were 8.6 mmol/L ± 0.829 for fKO mice (n = 3) and 8.6 mmol/L ± 0.825 for wild-type mice (n = 3) indicating no difference between genotypes (P-value = 0.957).
Expression of BGT1 mRNA
To test if BGT1 mRNA in fact was absent, Taqman real-time PCR was used. BGT1 mRNA was present at detectable levels in brains from wild-type mice, but only at background levels in brains from knockout mice (Fig. 4). This confirmed that the knockout construct (Fig. 1) behaved as intended, and that mice thereby do not have any BGT1 encoding gene.
Figure 4.

BGT1 mRNA levels in knockout and wild-type mice. BGT1 mRNA levels were determined using Taqman real-time PCR analysis with two different BGT1 probes and tissue samples from three pairs of male fKO and wild-type littermates (2–3 months old; mixed 129 and C57Bl6 background). Panel A: The Mm00446665_m1 probe is directed to a part of the sequence that has been deleted (see Fig. 1) while the Mm00446675_m1 probe is directed to a part still present in the genome. The two probes gave similar results in wild-type (WT) mice. Panels B and C: the highest BGT1 levels were found in the cerebellum in agreement with Evans and co-workers (1996), but even here the levels were low (see Fig. 9). Samples from knockout mice gave no signal with the Mm00446665_m1 probe (Panel B), but a weak signal with the Mn00446675_ml probe (Panel C) indicating that some of the non-deleted part of the gene is still transcribed, albeit at low levels and with a frame shift (see Fig. 1).
The Taqman assay was subsequently used to quantify the relative BGT1 mRNA expression levels in the BGT1-fKO mice. The levels in the hippocampus and the neocortex were, respectively, 48 ± 26 and 16 ± 6 and 9.9 ± 0.3% of the levin the cerebellum. Tissue from knockout mice was used as negative controls (Fig. 4).
Seizure susceptibility
The corneal kindling acquisition rates were significantly higher for females than for males, but there were no differences between knockout (BGT1-fKO) and wild-type mice of either sex (Fig. 5). There was also no significant difference between wild-type and BGT1-fKO mice in the i.v. PTZ seizure threshold test (Fig. 6). Furthermore, mice were subjected to the minimal clonic seizure threshold test (84 males, age range 32–77 days; 99 females, age range 37–145 days), the 6 Hz seizure threshold test (265 males, age range 36–119 days; 294 females, age range 36–179 days) and minimal tonic extension threshold test (79 males, age range 40–89 days; 92 females, age range 40–153 days). None of these tests revealed any difference between wild-type and BGT1-fKO mice. The P-values for the minimal clonic seizure threshold test, the 6 Hz seizure threshold test and the tonic extension threshold test were, respectively 0.065, 0.102 and 0.827 (data not shown). Apart from dose (convulsive voltage or drug), the single most influential parameter was gender (P-values: minimal clonic test < 0.0001, 6 Hz test = 0.097, tonic extension test = 0.006). Finally, the BGT1-(flox/flox) × Nestin11-Cre mice (which were fully backcrossed to C57Bl6) were tested in the 6 Hz seizure threshold model (107 males, 91 females; age range 43–133 days). Again, there was no significant difference between BGT1 deficient and BGT1 expressing mice (P-value = 0.951), but there was a significant gender difference (P-value = 0.006).
Figure 5.
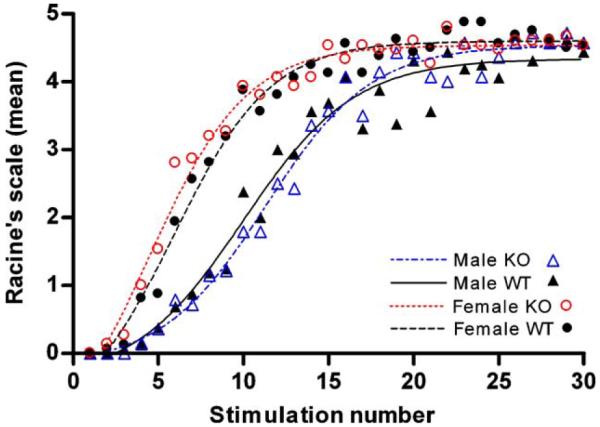
Corneal kindling of BGT1-fKO mice. Mice were electrically stimulated (3 mA, 50 Hz, 3 s) twice a day for 15 days, and the stimulations were numbered sequentially. Mean values of seizure severity (measured on Racine’s scale) for each of 4 groups (16 wild-type and 14 knockout males, age range 51–74 days, average age 64 days; 16 wild-type and 15 knockout females, age range 56–95 days, average age 74 days) were calculated for each stimulation. The graph shows mean values for each of the groups plotted against stimulation number (dots) as well as trend lines (smoothed in GraphPad Prism). There were significant differences between gender (ANOVA: P-value < 0.001), but no differences between genotype (ANOVA P-values: males = 0.9401, females = 0.662).
Figure 6.

Effect of intravenous pentylenetetrazol (PTZ) on male (A) and female (B) BGT1 wild-type (WT) and BGT1-fKO knockout (KO) mice (age range 57–126 days). Mice were injected with either vehicle alone (KO and WT) or with 20 mg (R)-EF1502/kg bodyweight (KO-EF1502 and WT-EF1502) 30 min prior to the PTZ challenge. The number of males injected with vehicle alone and with EF1502 were, respectively, 27 (14 knockouts and 13 wild-types) and (7 knockouts and 5 wild-types), while the corresponding numbers of female mice were 9 (5 knockouts and 4 wild-types) and 21 (10 knockouts and 11 wild-types). Note that there were no significant differences between wild-type and knockout mice (P-value = 0.684). The P-value for gender was 0.083.
The anticonvulsant effects of BGT1 inhibitors in the BGT1 knockout mice
Although no genotype related differences were detected in the above tests, possible differences might be uncovered with GABA uptake inhibitors. Therefore, (R)-EF1502 and tiagabine were tested separately in the corneal kindling model and in the 6 Hz seizure threshold model. As shown (Fig. 7) there was no significant differences between wild-type and BGT1-fKO mice, except in the 6 Hz seizure threshold model where (R)-EF1502 was more potent in BGT1-fKO mice than in wild-type mice (P-value = 0.009). We also studied the ED50, the dose of either (R)-EF1502 or tiagabine (when each of the drugs was used alone) that gave seizures in 50% of the female animals (124 mice, age range 52–177 days). These results were then implemented in the model for seizure for (R)-EF1502 and Tiagabine in combination. That gave a 49.9% seizure for the combination. Thus, there the effect of (R)-EF1502 and Tiagabine in combination is no different from (R)-EF1502 given alone. A significant effect of gender was found with Tiagabine in the 6 Hz model (P-value = 0.007).
Figure 7.

Seizure thresholds for BGT1 wild-type (WT) and BGT1-fKO knockout (KO) mice in the corneal kindling model (A and B) and in the 6 Hz seizure threshold model (C and D) after treatment with tiagabine (A and C) or (R)-EF1502 (B and D). Note that both drugs offered protection in both wild-type and knockout mice in both models. There were no significant differences between wild-type and knockout mice in A, B and C (P-values were, respectively, 0.388, 0.359 and 0.961). In contrast, (R)-EF1502 was more potent in the knockout mice than in the wild-type mice in the 6 Hz seizure threshold model (P-value = 0.009). Lines in C and D are best fit curves. The numbers of mice in A, B, C and D were, respectively, 63 (31 knockouts and 32 wild-types, age range 71–133 days), 47 (24 knockouts and 23 wild-types, age range 77–135 days), 148 (71 knockouts and 77 wild-types, age range 48–155 days) and 172 (85 knockouts and 87 wild-types, age range 48–174).
Because the taurine transporter has affinity for GABA and because this transporter was not included in the previous specificity testing of (RS)-EF1502 (White et al., 2005), the possibility existed that the actions of EF1502 could involve this transporter. However, as shown (Fig. 8), (RS)-EF1502 did not inhibit [3H]taurine uptake.
Figure 8.
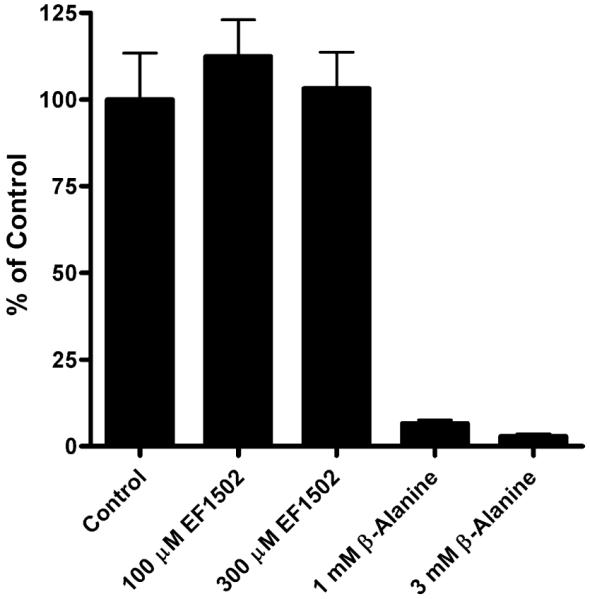
The effects of EF1502 on taurine uptake. The uptake of [3H]taurine in the cultured neurons in the presence or absence of beta-alanine and EF1502 was investigated essentially as described previously (Larsson et al., 1986). The incubations were carried out at 37 °C in phosphate buffered saline (PBS) containing [3H]taurine with 1 μM cold taurine. The incubations were terminated after 3 min. As it can be seen EF1502 does not inhibit taurine uptake at 300 μM which is the solubilization limit of the compound in water.
BGT1 mRNA expression levels relative to GAT1 mRNA expression levels
The above results did not provide any clues to what roles BGT1 may play in the brain. We therefore compared the mRNA levels of the most abundant GABA transporter (GAT1) with those of BGT1 in mice with pure C57Bl6 background. As shown in Fig. 9 (note that the scale is logarithmic), the brain levels of BGT1 mRNA are several hundred times lower than those of GAT1 mRNA.
Figure 9.
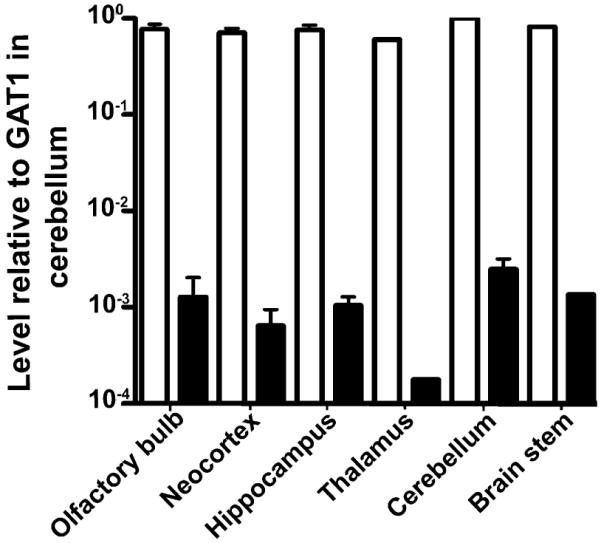
Comparison of BGT1 mRNA levels with those of GAT1. Taqman real-time PCR was used to compare levels of BGT1 mRNA (solid bars) and GAT1 (open bars) mRNA in C57Bl6 mice (8 weeks old; 2 males and 1 female). The data are expressed relative to GAT1 mRNA in the cerebellum. Note that BGT1 mRNA levels were considerably lower than those of GAT1 mRNA in all brain regions examined. These results are in agreement with those obtained from the mice with the mixed 129/C57Bl6 background (Fig. 4).
Discussion
Previous pharmacological studies (Madsen et al., 2010) of Frings and CF1 mice have shown a synergistic anticonvulsant effect of (R,S)-EF1502 with the GAT1-selective inhibitor tiagabine in the absence of enhanced toxicity. In these studies, (R,S)-EF1502 was extensively tested and the only targets identified were BGT1 and GAT1 suggesting that inhibition of BGT1 was contributing to the anticonvulsant effect. This interpretation, however, depends on the specificity of (R,S)EF1502 and on the expression levels and distribution of BGT1 in the brain.
Deletion of BGT1 has little impact on acute seizure susceptibility
The seizure data (Figs. 5–7) contain several variables in addition to BGT1, namely gender, age and body weight. Further, the mice had a mixed genetic background, and some were used more than once. Consequently, the data had to be analyzed with tools that can handle multiple variables simultaneously (binominal logistic regression analysis). This complexity may have masked a weak effect of BGT1, but it allows us to conclude that if there is any effect of BGT1, then this must be weaker than those of the other variables. Gender differences, for instance, are clearly identifiable in agreement with data from the literature (e.g. Statler et al., 2008).
The functional impact of a protein is determined by its expression level
Low BGT1 levels in the brain were expected (e.g. López-Corcuera et al., 1992; Evans et al., 1996), but it was surprising to find that the hippocampal levels were three orders of magnitude lower than those of GAT1, and that the thalamic and neocortical ones were even lower. This is unlikely to be a strain specific phenomenon because the mice with the mixed 129/C57Bl6 background, pure C57Bl6 background and CD1 background showed similar results. Further, Evans and co-workers (1996) show that most of the little BGT1 mRNA that is in the adult brain localizes to the leptomeninges rather than neuropil, and that BGT1 mRNA levels peaked at postnatal day 10 in the cerebellum declining to low levels shortly thereafter in agreement with our data.
Quantitative considerations are particularly relevant for transporter proteins because cotransport is a relatively slow process requiring tens of milliseconds for completing a full transport cycle. Thus, one transporter molecule can only transport a dozen or so substrate molecules per second. Sub-millisecond transmitter removal thereby requires more vacant binding sites (transporter molecules) than released neurotransmitter molecules. This explains why GAT1 (Chiu et al., 2002) and GLT1 (Lehre and Danbolt, 1998) are expressed at such high levels in the brain. In contrast, less demanding needs that can be satisfied in minutes or hours rather than milliseconds, may require fewer transporters. Thus, numbers limit the physiological roles that are possible. If a physiological role can be demonstrated and the numbers are insufficient, then it should be considered if the transporter can mediate its effect via novel mechanisms that require fewer molecules (e.g. by acting as a receptor). Alternatively, if a physiological role cannot be demonstrated and the protein is expressed at low levels, then it may not play any role at all. Because most DNA is transcribed (Birney et al., 2007) it follows that most mRNAs can be found in most cells and tissues. It is not known if all of these mRNA molecules are translated, but the presence of a protein does not necessarily imply that it plays a physiological role.
Can BGT1 have any impact on the removal of extracellular GABA?
The mouse isoforms of GAT1 and GAT3 have higher affinity for GABA than BGT1 (Madsen et al., 2010), and a number of studies suggest that the ambient GABA levels around synapses are relatively low, probably well below one micromolar in quiescent tissue (e.g. Westergren et al., 1994). The low extracellular GABA levels suggest that it is effectively removed to an extent where BGT1 is much less efficient than GAT1 and GAT3. However, recent findings (Olah et al., 2009) show that GABA concentrations can rise to levels well above the Km of BGT1 during periods of intense synaptic activity (also reviewed in Semyanov et al., 2004). Consequently, it is conceivable that there are situations when BGT1 may be activated. However, it is highly unlikely that BGT1 could have any effect on GABA uptake because our comparison indicates that BGT1 levels are approximately 1000 times lower than those of GAT1, and there are no data from the literature suggesting that BGT1 is any faster than the other GABA transporters. Thus, even when GABA levels are high, BGT1 can at most be responsible for a tiny fraction of the total GABA transport. The contribution will be far less at lower GABA levels. This could change if BGT1 should be dramatically up-regulated at the same time as GAT1 and GAT3 are down-regulated, but all existing evidence argues against this, because reported changes in BGT1 expression levels have been less than a factor of 10 (e.g. Miyai et al., 1996; Bitoun and Tappaz, 2000; Kempson and Montrose, 2004; Kempson et al., 2005; Olsen et al., 2005).
Furthermore, the precise localizations of the GABA transporter subtypes are unlikely to be important in this context because neurotransmitters diffuse quickly out of the synaptic cleft on a low microsecond timescale until they bind to transporters and are removed (e.g. Clements, 1996; Danbolt, 2001; Lehre and Rusakov, 2002; Rusakov et al., 2005). Thus, unless there are more transporters in the immediate vicinity of synapses than released GABA molecules (possibly 3000–5000 molecules), then GABA molecules will pass by all occupied transporters diffusing multiple synapse diameters away. The reason for this is that the distances are so small: one cubic micrometer of tissue contains about one nerve terminal (see Section 3.2.1 in Danbolt, 2001). This is such a small volume that the concentrations of terminals can be expressed in molar units: 1 l contains 1015 cubic micrometers and this divided by Avogadros number gives about 10−9 or about one nanomoles per liter.
What are the targets of EF1502?
Clearly, (R)-EF1502 has an anticonvulsant effect in BGT1 deficient mice (Fig. 7). This is expected because (R)-EF1502 inhibits both GAT1 and BGT1 (IC50 values: 4 and 22 μM, respectively: Madsen et al., 2010). But this would only explain an additive effect with tiagabine, and not why (R,S)-EF1502 is synergistic with tiagabine as described above. The original assumption (White et al., 2005) that the synergism was due to an action on BGT1, seems less likely now considering the low brain BGT1 levels and similar seizure thresholds in BGT1 knockout and wild-type mice. However, to reach a definitive conclusion, it is probably necessary to backcross the present BGT1 knockout mice and the GAT1 knockout mice (Chiu et al., 2005) to the Frings or CF1 background, and then cross them with each other to create BGT1-GAT1 double knockouts. If EF1502 is anticonvulsant in such mice, then it is acting on non-GABA transporter target. If it is inactive, then the effect has to do with either GAT1 alone or with both GAT1 and BGT1. If the synergistic effect is due to GAT1 alone, then it should be tested if tiagabine and EF1502 somehow affect GAT1 in different ways with respect to properties other than the transport activity (e.g. associated ion channel activities or on cell surface expression). Alternatively, it could be that the synergistic effect with tiagabine is due to the (S)-EF1502 enatiomer, but this would be unexpected considering that (S)-EF1502 has a similar affinity for BGT1 (IC50: 34 μM).
Concluding remarks
This study demonstrates that lack of BGT1 does not alter acute seizure susceptibility, and make it legitimate to ask if BGT1 functions as a GABA transporter in the brain. Although this study has not identified any role of BGT1, it is important to keep in mind that we have only done experiments with healthy adult mice reared in non-challenging environments, and that we have not studied samples from epilepsy patients.
Acknowledgements
We thank Jo Røislien for help with one-way within-subjects ANOVA for kindling data, and Henriette Danbolt for technical assistance. This work was supported by the Lundbeckfonden (R19-A2199) and by the Norwegian Research Council (FUGE, FRIBIOFYS, and STORFORSK).
Abbreviations
- EDTA
sodium ethylenediamine tetraacetate
- EF1502
(N-[4,4-bis(3-methyl-2-thienyl)-3-butenyl]-4-(methylamino-4,5,6,7-tetrahydrobenzo[d]isoxazol-3-ol
- GABA
gamma-aminobutyric acid
- KO
knockout with respect to BGT1 and implying homozygotous BGT1-fKO mice unless stated otherwise
- NaPi
sodium phosphate buffer with pH 7.4
- PTZ
pentylenetetrazol
- SDS
sodium dodecyl sulfate
- WT
wild-type mice (littermates of knockout mice when not stated otherwise)
References
- Barton ME, Klein BD, Wolf HH, White HS. Pharmacological characterization of the 6 Hz psychomotor seizure model of partial epilepsy. Epilepsy Res. 2001;47:217–227. doi: 10.1016/s0920-1211(01)00302-3. [DOI] [PubMed] [Google Scholar]
- Birney E, Stamatoyannopoulos JA, Dutta A, Guigo R, Gingeras TR, Margulies EH, Weng Z, Snyder M, Dermitzakis ET, Thurman RE, et al. Identification and analysis of functional elements in 1% of the human genome by the ENCODE pilot project. Nature. 2007;447:799–816. doi: 10.1038/nature05874. [DOI] [PMC free article] [PubMed] [Google Scholar]
- Bismuth Y, Kavanaugh MP, Kanner BI. Tyrosine 140 of the gamma-aminobutyric acid transporter GAT-1 plays a critical role in neurotransmitter recognition. J. Biol. Chem. 1997;272:16096–16102. doi: 10.1074/jbc.272.26.16096. [DOI] [PubMed] [Google Scholar]
- Bitoun M, Tappaz M. Gene expression of the transporters and biosynthetic enzymes of the osmolytes in astrocyte primary cultures exposed to hyperosmotic conditions. Glia. 2000;32:165–176. [PubMed] [Google Scholar]
- Borden LA, Dhar TG, Smith KE, Weinshank RL, Branchek TA, Gluchowski C. Tiagabine, SK&f 89976-a, CI-966, and NNC-711 are selective for the cloned GABA transporter GAT-1. Eur. J. Pharmacol. 1994;269:219–224. doi: 10.1016/0922-4106(94)90089-2. [DOI] [PubMed] [Google Scholar]
- Borden LA, Smith KE, Gustafson EL, Branchek TA, Weinshank RL. Cloning and expression of a betaine/GABA transporter from human brain. J. Neurochem. 1995a;64:977–984. doi: 10.1046/j.1471-4159.1995.64030977.x. [DOI] [PubMed] [Google Scholar]
- Borden LA, Smith KE, Vaysse PJ, Gustafson EL, Weinshank RL, Branchek TA. Re-evaluation of GABA transport in neuronal and glial cell cultures: correlation of pharmacology and mRNA localization. Recept. Channels. 1995b;3:129–146. [PubMed] [Google Scholar]
- Chiu CS, Brickley S, Jensen K, Southwell A, Mckinney S, Cull-Candy S, Mody I, Lester HA. GABA transporter deficiency causes tremor, ataxia, nervousness, and increased GABA-induced tonic conductance in cerebellum. J. Neurosci. 2005;25:3234–3245. doi: 10.1523/JNEUROSCI.3364-04.2005. [DOI] [PMC free article] [PubMed] [Google Scholar]
- Chiu CS, Jensen K, Sokolova I, Wang D, Li M, Deshpande P, Davidson N, Mody I, Quick MW, Quake SR, Lester HA. Number, density, and surface/cytoplasmic distribution of GABA transporters at presynaptic structures of knock-in mice carrying GABA transporter subtype 1-green fluorescent protein fusions. J. Neurosci. 2002;22:10251–10266. doi: 10.1523/JNEUROSCI.22-23-10251.2002. [DOI] [PMC free article] [PubMed] [Google Scholar]
- Clausen RP, Moltzen EK, Perregaard J, Lenz SM, Sanchez C, Falch E, Frolund B, Bolvig T, Sarup A, Larsson OM, Schousboe A, Krogsgaardlarsen P. Selective inhibitors of GABA uptake: synthesis and molecular pharmacology of 4-N-methylamino-4,5,6,7-tetrahydrobenzo[d]isoxazol-3-ol analogues. Bioorg. Med. Chem. 2005;13:895–908. doi: 10.1016/j.bmc.2004.10.029. [DOI] [PubMed] [Google Scholar]
- Clements JD. Transmitter timecourse in the synaptic cleft: its role in central synaptic function. Trends Neurosci. 1996;19:163–171. doi: 10.1016/s0166-2236(96)10024-2. [DOI] [PubMed] [Google Scholar]
- Conti F, Minelli A, Melone M. GABA transporters in the mammalian cerebral cortex: localization, development and pathological implications. Brain Res. Brain Res. Rev. 2004;45:196–212. doi: 10.1016/j.brainresrev.2004.03.003. [DOI] [PubMed] [Google Scholar]
- Danbolt NC. Glutamate uptake. Prog. Neurobiol. 2001;65:1–105. doi: 10.1016/s0301-0082(00)00067-8. [DOI] [PubMed] [Google Scholar]
- Evans JE, Frostholm A, Rotter A. Embryonic and postnatal expression of four gamma-aminobutyric acid transporter mRNAs in the mouse brain and leptomeninges. J. Comp. Neurol. 1996;376:431–446. doi: 10.1002/(SICI)1096-9861(19961216)376:3<431::AID-CNE6>3.0.CO;2-3. [DOI] [PubMed] [Google Scholar]
- Finney DJ. Probit Analysis. Cambridge University Press; Cambridge, UK: 1971. pp. 1–333. [Google Scholar]
- Gammelsaeter R, Frøyland M, Aragon C, Danbolt NC, Fortin D, Storm-Mathisen J, Davanger S, Gundersen V. Glycine, GABA and their transporters in pancreatic islets of Langerhans: evidence for a paracrine transmitter interplay. J. Cell Sci. 2004;117:3749–3758. doi: 10.1242/jcs.01209. [DOI] [PubMed] [Google Scholar]
- Hertz E, Yu AC, Hertz L, Juurlink BH, Schousboe A. Preparation of primary cultures of mouse cortical neurons. In: Shahar A, de Vellis J, Vernadakis A, Haber B, editors. A Dissection and Tissue Culture Manual of the Nervous System. Alan R. Liss, Inc.; New York: 1989. [Google Scholar]
- Holmseth S, Lehre KP, Danbolt NC. Specificity controls for immunocytochemistry. Anat. Embryol. 2006;211:257–266. doi: 10.1007/s00429-005-0077-6. [DOI] [PubMed] [Google Scholar]
- Kempson SA, Beck JA, Lammers PE, Gens JS, Montrose MH. Membrane insertion of betaine/GABA transporter during hypertonic stress correlates with nuclear accumulation of TonEBP. Biochim. Biophys. Acta Biomembr. 2005;1712:71–80. doi: 10.1016/j.bbamem.2005.03.006. [DOI] [PubMed] [Google Scholar]
- Kempson SA, Montrose MH. Osmotic regulation of renal betaine transport: transcription and beyond. Pflugers Arch. Eur. J. Physiol. 2004;449:227–234. doi: 10.1007/s00424-004-1338-6. [DOI] [PubMed] [Google Scholar]
- Larsson OM, Griffiths R, Allen IC, Schousboe A. Mutual inhibition kinetic analysis of gamma-aminobutyric acid, taurine, and beta-alanine high-affinity transport into neurons and astrocytes: evidence for similarity between the taurine and beta-alanine carriers in both cell types. J. Neurochem. 1986;47:426–432. doi: 10.1111/j.1471-4159.1986.tb04519.x. [DOI] [PubMed] [Google Scholar]
- Lehre KP, Danbolt NC. The number of glutamate transporter subtype molecules at glutamatergic synapses: chemical and stereological quantification in young adult rat brain. J. Neurosci. 1998;18:8751–8757. doi: 10.1523/JNEUROSCI.18-21-08751.1998. [DOI] [PMC free article] [PubMed] [Google Scholar]
- Lehre KP, Rusakov DA. Asymmetry of glia near central synapses favors presynaptically directed glutamate escape. Biophys. J. 2002;83:125–134. doi: 10.1016/S0006-3495(02)75154-0. [DOI] [PMC free article] [PubMed] [Google Scholar]
- Liu P, Jenkins NA, Copeland NG. A highly efficient recombineering-based method for generating conditional knockout mutations. Genome Res. 2003;13:476–484. doi: 10.1101/gr.749203. [DOI] [PMC free article] [PubMed] [Google Scholar]
- Liu QR, López-Corcuera B, Mandiyan S, Nelson H, Nelson N. Molecular characterization of 4 pharmacologically distinct alpha-aminobutyric acid transporters in mouse brain. J. Biol. Chem. 1993;268:2106–2112. [PubMed] [Google Scholar]
- López-Corcuera B, Liu QR, Mandiyan S, Nelson H, Nelson N. Expression of a mouse brain cDNA encoding novel gamma-aminobutyric acid transporter. J. Biol. Chem. 1992;267:17491–17493. [PubMed] [Google Scholar]
- Madsen KK, White HS, Schousboe A. Neuronal and non-neuronal GABA transporters as targets for antiepileptic drugs. Pharmacol. Ther. 2010;125:394–401. doi: 10.1016/j.pharmthera.2009.11.007. [DOI] [PubMed] [Google Scholar]
- Matagne A, Klitgaard H. Validation of corneally kindled mice: a sensitive screening model for partial epilepsy in man. Epilepsy Res. 1998;31:59–71. doi: 10.1016/s0920-1211(98)00016-3. [DOI] [PubMed] [Google Scholar]
- Miyai A, Yamauchi A, Moriyama T, Kaneko T, Takenaka M, Sugiura T, Kitamura H, Ando A, Tohyama M, Shimada S, Imai E, Kamada T. Expression of betaine transporter mRNA: its unique localization and rapid regulation in rat kidney. Kidney Int. 1996;50:819–827. doi: 10.1038/ki.1996.381. [DOI] [PubMed] [Google Scholar]
- Nielsen EB, Suzdak PD, Andersen KE, Knutsen LJ, Sonnewald U, Braestrup C. Characterization of Tiagabine (NO-328), a New Potent and Selective GABA Uptake Inhibitor. Eur. J. Pharmacol. 1991;196:257–266. doi: 10.1016/0014-2999(91)90438-v. [DOI] [PubMed] [Google Scholar]
- Olah S, Fule M, Komlosi G, Varga C, Baldi R, Barzo P, Tamas G. Regulation of cortical microcircuits by unitary GABA-mediated volume transmission. Nature. 2009;461:1278–1281. doi: 10.1038/nature08503. [DOI] [PMC free article] [PubMed] [Google Scholar]
- Olsen M, Sarup A, Larsson OM, Schousboe A. Effect of hyperosmotic conditions on the expression of the betaine-GABA-transporter (BGT-1) in cultured mouse astrocytes. Neurochem. Res. 2005;30:855–865. doi: 10.1007/s11064-005-6879-3. [DOI] [PubMed] [Google Scholar]
- Orloff MJ, Williams HL, Pfriffer CC. Timed intervenous infusion of metrazol and strychine for testing anticonvulsant drugs. Proc. Soc. Exp. Biol. Med. 1949;70:254–257. doi: 10.3181/00379727-70-16891. [DOI] [PubMed] [Google Scholar]
- Otto J, Singh N, Dahle E, Leppert M, Pappas C, Pruess T, Wilcox K, White H. Electroconvulsive seizure thresholds and kindling acquisition rates are altered in mouse models of human Kcnq2 and Kcnq3 mutations for benign familial neonatal convulsions. Epilepsia. 2009;50:1752–1759. doi: 10.1111/j.1528-1167.2009.02100.x. [DOI] [PubMed] [Google Scholar]
- Racine RJ. Modification of seizure activity by electrical stimulation. II. Motor seizure. Electroencephalogr. Clin. Neurophysiol. 1972;32:281–294. doi: 10.1016/0013-4694(72)90177-0. [DOI] [PubMed] [Google Scholar]
- Ruiz-Tachiquin M-E, Sanchez-Lemus E, Soria-Jasso L-E, Arias-Montano J-A, Ortega A. Gamma-aminobutyric acid transporter (BGT-1) expressed in human astrocytoma U373Mg cells: pharmacological and molecular characterization and phorbol ester-induced inhibition. J. Neurosci. Res. 2002;69:125–132. doi: 10.1002/jnr.10258. [DOI] [PubMed] [Google Scholar]
- Rusakov DA, Saitow F, Lehre KP, Konishi S. Modulation of presynaptic Ca2+ entry by AMPA receptors at individual GABAergic synapses in the cerebellum. J. Neurosci. 2005;25:4930–4940. doi: 10.1523/JNEUROSCI.0338-05.2005. [DOI] [PMC free article] [PubMed] [Google Scholar]
- Schousboe A, Sarup A, Larsson OM, White HS. Gaba transporters as drug targets for modulation of Gabaergic activity. Biochem. Pharmacol. 2004;68:1557–1563. doi: 10.1016/j.bcp.2004.06.041. [DOI] [PubMed] [Google Scholar]
- Semyanov A, Walker MC, Kullmann DM, Silver RA. Tonically active GABA A receptors: modulating gain and maintaining the tone. Trends Neurosci. 2004;27:262–269. doi: 10.1016/j.tins.2004.03.005. [DOI] [PubMed] [Google Scholar]
- Smith MD, Saunders GW, Clausen RP, Frolund B, Krogsgaard-Larsen P, Larsson OM, Schousboe A, Wilcox KS, White HS. Inhibition of the betaine-GABA transporter (mGAT2/BGT-1) modulates spontaneous electrographic bursting in the medial entorhinal cortex (mEC) Epilepsy Res. 2008;79:6–13. doi: 10.1016/j.eplepsyres.2007.12.009. [DOI] [PMC free article] [PubMed] [Google Scholar]
- Statler KD, Swank S, White HS. Strain and age affect electroconvulsive seizure testing in rats. Epilepsy Res. 2008;78:232–234. doi: 10.1016/j.eplepsyres.2007.11.001. [DOI] [PMC free article] [PubMed] [Google Scholar]
- Takanaga T, Ohtsuki S, Hosoya KI, Terasaki T. GAT2/BGT-1 as a system responsible for the transport of gamma-aminobutyric acid at the mouse blood-brain barrier. J. Cerebr. Blood Flow Metab. 2001;21:1232–1239. doi: 10.1097/00004647-200110000-00012. [DOI] [PubMed] [Google Scholar]
- Tang S-HE, Silva FJ, Tsark WM, Mann JR. A Cre/loxP-deleter transgenic line in mouse strain 129S1/SvImJ. Genesis. 2002;32:199–202. doi: 10.1002/gene.10030. [DOI] [PubMed] [Google Scholar]
- Westergren I, Nystrom B, Hamberger A, Nordborg C, Johansson BB. Concentrations of amino acids in extracellular fluid after opening of the blood-brain barrier by intracarotid infusion of protamine sulfate. J. Neurochem. 1994;62:159–165. doi: 10.1046/j.1471-4159.1994.62010159.x. [DOI] [PubMed] [Google Scholar]
- White HS. Animal models of epileptogenesis. Neurology. 2002;59:S7–S14. doi: 10.1212/wnl.59.9_suppl_5.s7. [DOI] [PubMed] [Google Scholar]
- White HS, Watson WP, Hansen SL, Slough S, Perregaard J, Sarup A, Bolvig T, Petersen G, Larsson OM, Clausen RP, Frolund B, Falch E, Krogsgaardlarsen P, Schousboe A. First demonstration of a functional role for central nervous system betaine/gamma-aminobutyric acid transporter (MGAT2) based on synergistic anticonvulsant action among inhibitors of mGAT1 and mGAT2. J. Pharmacol. Exp. Ther. 2005;312:866–874. doi: 10.1124/jpet.104.068825. [DOI] [PubMed] [Google Scholar]
- Woodbury LA, Davenport VD. Design and use of a new electroshock seizure apparatus, and analysis of factors altering seizure threshold and pattern. Arch. Int. Pharm Ther. 1952;92:97–107. [PubMed] [Google Scholar]
- Yamashita A, Singh SK, Kawate T, Jin Y, Gouaux E. Crystal structure of a bacterial homologue of Na+/Cl--dependent neurotransmitter transporters. Nature. 2005;437:215–223. doi: 10.1038/nature03978. [DOI] [PubMed] [Google Scholar]
- Zhu XM, Ong WY. Changes in GABA transporters in the rat hippocampus after kainate-induced neuronal injury: Decrease in GAT-1 and GAT-3 but upregulation of betaine/GABA transporter BGT-1. J. Neurosci. Res. 2004a;77:402–409. doi: 10.1002/jnr.20171. [DOI] [PubMed] [Google Scholar]
- Zhu XM, Ong WY. A light and electron microscopic study of betaine/GABA transporter distribution in the monkey cerebral neocortex and hippocampus. J. Neurocytol. 2004b;33:233–240. doi: 10.1023/b:neur.0000030698.66675.90. [DOI] [PubMed] [Google Scholar]