

Abstract
A genome-wide association study of Han Chinese subjects was conducted to identify genetic susceptibility loci for nonobstructive azoospermia (NOA). In the discovery stage, 802 azoospermia cases and 1,863 controls were screened for genetic variants in the genome. Promising SNPs were subsequently confirmed in two independent sets of subjects: 818 azoospermia cases and 1,755 controls from northern China, and 606 azoospermia cases and 958 controls from central and southern China. We detected variants at human leukocyte antigen (HLA) regions that were independently associated with NOA (HLA-DRA, rs3129878, pcombine = 3.70 × 10⁻¹⁶, odds ratio [OR] = 1.37; C6orf10 and BTNL2, rs498422, pcombine = 2.43 × 10⁻¹², OR = 1.42). These findings provide additional insight into the pathogenesis of NOA.
Main Text
Azoospermia (MIM 415000), defined as the absence of spermatozoa in the ejaculate, affects 1% of the general population and 10%–15% of infertile men.1,2 Compared with obstructive azoospermia, which can be treated by testicular sperm extraction and intracytoplasmic sperm injection, nonobstructive azoospermia (NOA) is more common, accounting for 60% of azoospermia, and more difficult to treat because of spermatogenesis failure.2,3
Several genetic abnormalities have been associated with NOA, including Y chromosome microdeletions and chromosomal abnormalities.4,5 However, these known genetic alterations account for a small portion of NOA cases, whereas most cases are idiopathic.6 Sequence variants in dozens of spermatogenesis genes have been evaluated for the identification of additional NOA risk-associated genetic alterations through the use of a candidate-gene approach.7 A genome-wide association study (GWAS) was also performed among 40 NOA cases and 80 controls of European descent.8 However, none of the sequence variants reached a genome-wide significance level, nor were they consistently replicated in independent populations.9–11 Additional studies are needed for the identification of genetic variants associated with idiopathic NOA.
Thus, to identify genetic susceptibility loci for NOA, we conducted a three-stage GWAS with the goal of identifying SNPs in the genome that are associated with risk for NOA in the Han Chinese population.
Written informed consent was obtained from all subjects. Additional demographic information was collected from both cases and controls through a structured questionnaire. This study was approved by each participating center's institutional ethics committee and was conducted according to Declaration of Helsinki principles. Cases included in this study were selected on the basis of an andrological examination that included medical history, physical examination, semen analysis, hormone analysis, scrotal ultrasound, karyotype testing, and Y chromosome microdeletion screening. Cases with varicocele, cryptorchidism (MIM 219050), obstructive azoospermia, hypogonadotropic hypogonadism (MIM 146110), recurrent infections, testis trauma, iatrogenic infertility, karyotype anomalies, or Y chromosome microdeletions were excluded.
In stage I, genetic variants in the genome were screened among 802 NOA cases and 1,863 controls. None of the NOA cases had detectable sperm in the ejaculate after evaluation of the centrifuged pellet, nor did they have any other known etiology. The NOA cases were all recruited from Shandong province in northern China. Population controls included 1,000 men from a community-based study in Shanghai and 863 healthy women from the Shandong province.
Subjects in stage II included 818 NOA cases and 1,755 controls born in eight provinces of northern China12 (Shandong, Heilongjiang, Jilin, Liaoning, Hebei, Henan, Tianjin, and Beijing). Subjects in stage III included 606 NOA cases and 958 controls, all born in five provinces of central and southern China (Jiangsu, Anhui, Shanghai, Hubei, and Guangxi). Inclusion criteria for controls were sperm concentration > 20 million/ml, progressive sperm motility > 40%, viability > 50% on the basis of a membrane structure test, normal sperm heads > 30%, and normal sperm tails > 65%, in accordance with World Health Organization criteria (1999).13
EDTA anticoagulated venous blood samples were collected from all participants. Genomic DNA was extracted from peripheral-blood lymphocytes by standard procedures with the use of FlexiGene DNA kits (QIAGEN) and diluted to working concentrations of 50 ng/μl for genome-wide genotyping and 15–20 ng/μl for the validation study.
Two genotyping methods were used for GWAS in stage I. For NOA cases and population controls from the Shanghai region, the HumanOmniExpress (OmniExpress) BeadChip was used (Illumina, San Diego, CA, USA). For population controls from the Shandong region, the Affymetrix Genome-Wide Human SNP Array 6.0 was used (Affymetrix, Santa Clara, CA, USA).
A series of quality control steps were applied so that high-quality samples and SNPs were obtained. Subjects were excluded from the analysis if the genotype call rate was less than 95%. SNPs were excluded if (1) the missing rate was > 2% in any of the three sets of subjects, (2) the p value for Hardy-Weinberg equilibrium (HWE) was < 0.001 in any of the two control subsets, or (3) minor allele frequency was < 0.03 in the entire cohort. A total of 912,924 SNPs were retained in the analysis.
Two criteria were used to select SNPs from stage I for further confirmation in stage II: (1) SNPs that were associated with NOA risk at p < 10−6 and (2) the most significant SNP from each independent associated region as defined by the CLUMP computer program (with an r2 of 0.5 as a cutoff for linkage disequilibrium [LD] among SNPs). A total of 37 SNPs were selected for confirmation in stage II. Genotyping of five SNPs failed due to poor clusters. Four SNPs that were confirmed in stage II at p < 0.001 (adjusted for 32 tests) were selected for further confirmation in stage III.
Genotyping of SNPs in the confirmation stages (II and III) was performed with the Sequenom iPLEX platform (Sequenom, San Diego, CA, USA). PCR and extension primers for the SNPs were designed with the MassARRAY Assay Design 3.0 software. PCR and extension reactions were performed according to the manufacturer's instructions, and extension product sizes were determined by mass spectrometry via the Sequenom iPLEX system. All genotyping reactions were performed in 384-well plates. Each plate included a duplicate for three or four subjects selected at random, as well as six to nine negative controls in which water was substituted for DNA. The average concordance rate was 99.8%.
Tests for HWE were performed for each SNP separately among case patients and control subjects with the use of Fisher's exact test. The EIGENSTRAT computer program was used to examine the potential effect of population substructure and to obtain principal components (eigens) based on genotyped data.14 The IMPUTE computer program was used for inferring the genotypes of SNPs (e.g., SNPs catalogued in Hapmap phase II CHB [Han Chinese in Beijing] population release no. 24) in the genome that were not directly genotyped.15 A posterior probability of >0.90 was applied to call genotypes that were imputed from IMPUTE software. Allele frequency differences between case patients and control subjects were tested for each genotyped and imputed SNP, adjusted for age and the first two eigen vectors, as implemented in PLINK.16 Regional plots were generated with the computer program LocusZoom.17 We used the Haploview software (version 4.1) to infer the LD structure in the vicinity of the susceptibility loci.18
In stage I, genotype frequencies of SNPs in the genome were compared between 802 NOA cases and 1,863 control subjects. An allelic test adjusted for age and the first principal component (eigen) of a population stratification analysis (Figure 1) showed that multiple SNPs in the genome were significantly associated with NOA risk, at p < 9.99 × 10⁻⁵ (Figure 2). Considering that some of these SNPs were in LD, we performed a CLUMP analysis to identify independent associations, using an r2 of 0.5 as a cutoff for LD among SNPs. This analysis revealed 37 regions in the genome that were associated with NOA risk (Table S1 available online). We then selected the most significant SNP in each of these 37 regions for confirmation in an additional 818 NOA cases and 1,755 controls from northern China (stage II). Among 32 successfully genotyped SNPs, four (rs498422, rs2076531, rs3129878, and rs7192, all at 6p22) were confirmed to be associated with NOA risk, at p < 0.001. This p value cutoff was chosen to guard against inflated type I error due to 32 tests (≤5% type I error). As a further confirmation, we compared the allele frequencies of these four SNPs in an additional 606 NOA cases and 958 subjects without NOA from central and southern China (stage III). The NOA risk-associated alleles of these SNPs were consistently higher in NOA cases than in controls in this stage; however, the evidence of association for those four SNPs was marginally significant (p ranged from 0.02 to 0.07, Table 1). Finally, to assess the overall evidence for association between the SNPs and NOA risk, we performed a combined allelic test for the three stages based on a logistic regression analysis, adjusted for age and stage information. The combined p value ranged from 2.43 × 10⁻¹² to 3.70 × 10⁻¹⁶ for these four SNPs (Table 1), each exceeding a genome-wide significance level of 5 × 10⁻⁸.
Figure 1.
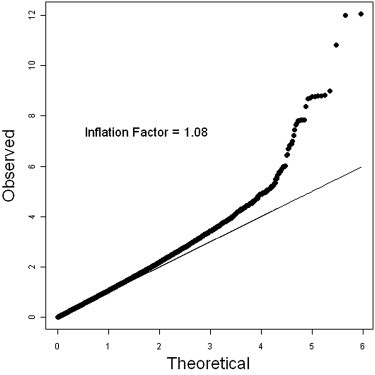
Quantile-Quantile Plots
The quantile-quantile plot of observed versus expected test statistics was adjusted for age and first eigen (χ2 test).
Figure 2.
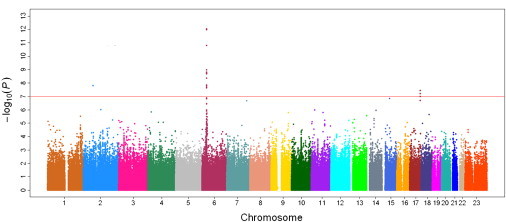
Manhattan Plot of Genome-wide Association Analyses for Nonobstrusive Azoospermia
The x axis shows chromosomal positions. The y axis shows –log10 p values from allelic tests adjusted for age and first principal component from a population stratification analysis. The horizontal dashed line indicates the preset threshold of p = 1 × 10⁻⁵. The horizontal solid line indicates the preset threshold of genome-wide significance: p = 5 × 10⁻⁸.
Table 1.
GWAS, Case-Control Replication Study, and Metaanalysis Results for Significant SNPs
| Independencea | Alleleb | Stage | Case | Ctrl | ORc | p Valuec | HWEd | Statuse | Qf | I2f | ORg | p Valueg | ORh | p Valueh |
|---|---|---|---|---|---|---|---|---|---|---|---|---|---|---|
| Chromosome 6, rs498422 | ||||||||||||||
| Yes |
G/T |
GWAS | 0.20 | 0.13 | 1.81 | 1.53 × 10⁻¹¹ | 0.36 |
G/I |
0.006 |
80.12 |
1.42 |
2.43 × 10⁻¹² |
1.44 |
1.8 × 10⁻³ |
| replication 1 | 0.17 | 0.13 | 1.37 | 1.46 × 10⁻⁴ | ||||||||||
| replication 2 | 0.16 | 0.14 | 1.21 | 0.068 | ||||||||||
| Chromosome 6, rs2076531 | ||||||||||||||
| No |
G/A |
GWAS | 0.11 | 0.06 | 2.03 | 1.49 × 10⁻⁹ | 0.67 |
I/G |
0.04 |
67.84 |
1.61 |
6.60 × 10⁻¹³ |
1.60 |
1.4 × 10⁻⁴ |
| replication 1 | 0.10 | 0.07 | 1.42 | 9.75 × 10⁻⁴ | ||||||||||
| replication 2 | 0.08 | 0.06 | 1.40 | 0.018 | ||||||||||
| Chromosome 6, rs3129878 | ||||||||||||||
| Yes |
C/A |
GWAS | 0.40 | 0.29 | 1.63 | 1.03 × 10⁻¹² | 0.74 |
G/G |
0.005 |
81.07 |
1.37 |
3.70 × 10⁻¹⁶ |
1.36 |
9.0 × 10⁻⁴ |
| replication 1 | 0.36 | 0.30 | 1.32 | 1.48 × 10⁻⁵ | ||||||||||
| replication 2 | 0.32 | 0.28 | 1.17 | 0.051 | ||||||||||
| Chromosome 6, rs7192 | ||||||||||||||
| No | T/G | GWAS | 0.32 | 0.26 | 1.42 | 1.02 × 10⁻⁶ | 0.58 | G/I | 0.19 | 39.42 | 1.28 | 1.10 × 10⁻⁹ | 1.29 | 2.9 × 10⁻⁶ |
| replication 1 | 0.32 | 0.27 | 1.26 | 3.70 × 10⁻⁴ | ||||||||||
| replication 2 | 0.29 | 0.26 | 1.17 | 0.050 | ||||||||||
Ctrl, control; OR, odds ratio; HWE, Hardy-Weinberg equilibrium.
“Independence” indicates whether the SNPs remained independently associated with NOA risk when adjusted for the other SNPs in the model.
Minor allele/major allele.
OR is estimated on the basis of the minor allele; OR and p values are estimated on the basis of logistic regression analysis, adjusted for age and the first two eigen vectors, estimated on the basis of principal component analysis.
HWE tests were based on Fisher's exact tests in the combined control subjects.
G, genotyped; I, imputed. The letter before the forward slash indicates the imputation status for cases, and the letter after the forward slash indicates the imputation status for controls.
The p values of Q test and I2 values are based on tests for heterogeneity.
The combined analysis was based on logistic regression analysis, adjusted for age and stage information.
The combined analysis was based on metaanalysis, with the assumption of a random effect model.
Considering that these four SNPs all reside in a 144 kb genomic region at 6p22, we tested for independent association of these SNPs with NOA risk among subjects in stage I by using a stepwise multivariate analysis. Two SNPs (rs3129878 and rs498422) were retained in the model, and each showed a highly significant association with NOA risk, with p value of 1.55 × 10⁻¹¹ and 4.19 × 10⁻⁸, respectively.
This result suggests that these two SNPs were independently associated with NOA risk, whereas the observed associations of two other SNPs (rs2076531 and rs7192) with NOA risk in the univariate analysis were probably partly due to their LD with these two SNPs. Similar results were found in subjects from stages II and III, and two SNPs (rs3129878 and rs498422) were retained in the multivariate analysis (p = 0.0002 and p = 0.0008, respectively).
An examination of LD structure (based on the CHB and JPT [Japanese in Tokyo] HapMap populations) and known genes at the 6p22 region provides additional information on NOA risk-associated variants (Figure 3). SNP rs3129878 was the most significant at this region in stage I (p = 5.49 × 10⁻¹⁵) and is located in intron 1 of HLA-DRA (MIM 142860). Several other SNPs that were in moderate LD (r2 ≈ 0.4–0.6, green dots) or modest LD (r2 ≈ 0.2–0.4, light blue dots) with rs3129878 were also highly significant (p ≈ 10−8−10−10). They were in a weakly defined haplotype block that contains two known genes, HLA-DRA and BTNL2 (MIM 606000). One of these SNPs, rs7192, is a nonsynonymous change in exon 4 of HLA-DRA that results in an amino acid substitution from valine to leucine. However, the p value of this SNP (p = 9.66 × 10⁻⁸) was noticeably weaker than that of other flanking SNPs; therefore, this nonsynonymous change is unlikely to be the driver of the association observed at this region.
Figure 3.
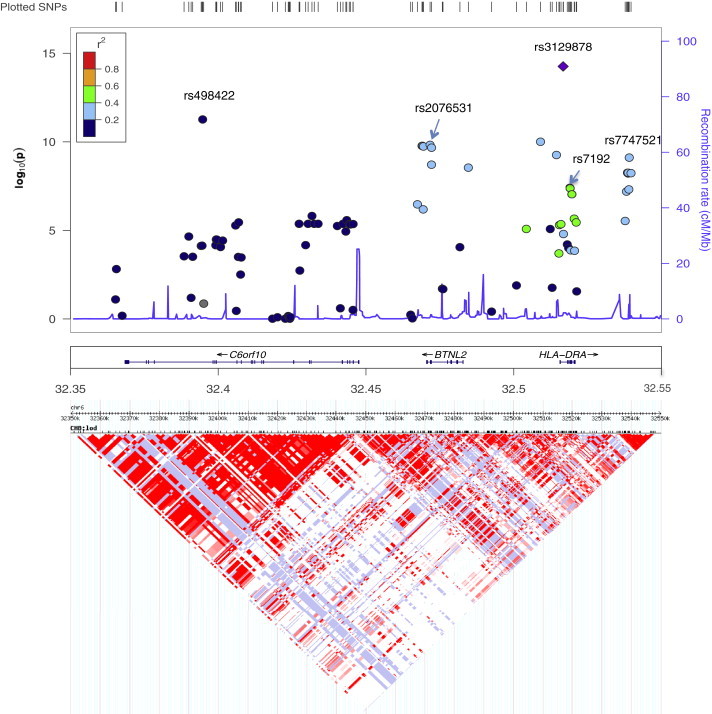
Plots of the 6p22 Region
Top panel: the x axis shows chromosomal positions. The left y axis shows –log10 p values from an association test. Colors of the dots indicate the LD relationship between the most significant associated SNP (rs3129878) and the remaining SNPs in the 200 kb region. The right y axis shows the recombination rate between SNPs.
Bottom panel: Heatmap of SNPs at the region. Both the LD and recombination rates are estimated on the basis of the Hapmap phase II CHB and JPT population.
The other independent NOA-associated SNP (rs498422) was not in LD with rs3129878 (r2 = 0.01, blue dot). It is located in a haplotype block that is different from that of rs3129878 (Figure 3). These two haplotype blocks are separated by a recombination hotspot. The SNP rs498422 is within another gene, chromosomal open reading frame 10 (C6orf10). Multiple SNPs in the haplotype block were also associated with NOA risk; however, the statistical evidence for their association was weaker than that for rs498422.
We evaluated whether the most significant findings could tag the classical human leukocyte antigen (HLA) alleles and then performed the imputation of the HLA alleles through the approach suggested by De Bakker et al.19 The most significant SNP, rs3129878, can be used together with rs2516049 to tag for HLA-DRB∗0405 (HLA-DRB [MIM 142857]) in the CHB population. Using the imputation approach, we found that the HLA-DRB∗0405 allele was significantly associated with increased NOA risk, with a frequency of 0.087 in the cases and 0.05 in the controls (p = 7.9 × 10⁻⁷). Association of the HLA-DRB∗0405 allele with rheumatoid arthritis (MIM 180300) has been reported in previous studies.20 The other independent NOA-associated SNP (rs498422) did not tag any known HLA alleles in the CHB population. However, rs2076531, the SNP in LD with rs498422 (r2 = 0.58 in CHB), is in complete LD with rs2076528. The latter SNP, together with rs1694112 and rs6937034, can tag for HLA-DQB∗0402 (HLA-DQB [MIM 604305]) in the CHB population. Through imputation analysis, we found that the HLA-DQB∗0402 allele was also significantly associated with increased NOA risk, with a frequency of 0.098 in the cases and 0.057 in the controls (p = 6.7 × 10⁻⁸). This HLA allele was found to be associated with type 1 diabetes (MIM 222100).21
HLA-DRA is a member of HLA class II genes. It encodes the alpha chain of HLA-DR and heterodimerizes with beta chains (HLA-DRBs) anchoring in the cell membrane. Like other HLA molecules (major histocompatibility complex [MHC] class I and II), HLA-DRA plays an important role in the immune system by presenting peptides on the cell surface of antigen-presenting cells (APCs, including B lymphocytes, dendritic cells, and macrophages) for recognition by T cells. BTNL2 encodes butyrophilin-like 2, an immunoglobulin superfamily membrane protein implicated in regulating T cell activation. The function of C6orf10 is unknown. Several autoimmune diseases have been reported to be associated with this region, such as ulcerative colitis (MIM 266600),22 systemic lupus erythematosus (MIM 152700),23 vitiligo (MIM 606579),24 sarcoidosis (MIM 181000),25 multiple sclerosis (MIM 126200),26 and Parkinson disease(MIM 168600).27 Thus, it is likely that variations in this region might mediate the response to testicular microenvironmental antigens and cause testicular azoospermia through autoimmune inflammatory responses.
Spiess et al.28 performed global gene expression profiling of testicular biopsies from azoospermia patients and identified inflammation-related genes involved in spermatogenic failure. Our study of SNPs throughout the genome further supports the involvement of the HLA region in susceptibility to NOA and suggests that inflammation in testicular tissues might cause the failure of interactions between immune-germ and somatic testicular cells, disrupting the process of spermatogenesis. Thus, controlling inflammation therapeutically may significantly improve the disease outcomes.
Our results must be interpreted with caution. First, as shown in Table 1, the magnitude of association differed in the GWAS discovery stage and the replication 1 and 2 studies. The significant p values of the Q test and the relatively high I2 statistics also indicated that certain levels of heterogeneity existed in our study. In this situation, a random effect model maybe more appropriate for estimating the combined effect of the SNPs identified in our study. However, assuming a random effect model would greatly reduce the statistical power in comparison to the approach of using individual-level of data adjusted according to study stage. In our case, the magnitude of association significantly decreased (p = 1.8 × 10⁻³ for rs498422 and p = 9.0 × 10⁻⁴ for rs312987) when a random effect model was assumed. Therefore, additional studies are warranted if we are to infer a more stable estimate of the magnitude of association of the SNPs identified here. Second, an inflation factor of 1.08 was observed for the GWAS stage. In this study, we have carefully applied a series of quality control (QC) criteria to both individuals and SNPs, including removing samples with a low call rate, unintended duplicated samples, and individuals who are potentially related on the basis of identity-by-state estimates. Population stratification was also evaluated, and the first two eigen vectors were included as the covariate in the analysis. A relatively high inflation factor of 1.08 remained after all of the QC criteria had been applied. This may indicate some undetected population structure, although adjusting additional eigen vectors did not result in a lower inflation factor (data not shown). However, when we calibrated the test statistics using the inflation factor, it had a limited effect on our main findings. For example, the magnitude of association for rs3129878 was slightly decreased from a p value of 1.03 × 10⁻¹² to a p value of 7.03 × 10⁻¹² if we calibrated by dividing the test statistics by the inflation factor of 1.08.
In summary, our GWAS and subsequent replication analyses identified variants at the HLA region that are associated with idiopathic NOA in the Han Chinese population. These results highlight the possible involvement of chronic immune activation pathways in the etiology of NOA and point to a potential therapeutic target for this disease.
Acknowledgments
We thank Di Wu, Changming Zhang, Yongzhi Cao, Gang Ma, Chongfu Zhong, Jiaolong Liu and Yanhong Xiao from Shandong University for sample collection and categorization; Qingzhi Hao and Pingshuai Jiang for data organization. This study was supported by grants from the National Basic Research Program of China (973 Program) (2012CB944700), the National Natural Science Foundation of China (30973170, 81000238, 81000236), the National Key Technology Research and Development Program (2011BAI17B00), the Science Research Foundation Item of No-earnings Health Vocation (201002013), and an intramural grant from Huashan Hospital. We thank all participants involved in this study. All authors critically reviewed the article and approved the final manuscript.
Supplemental Data
Web Resources
The URLs for data presented herein are as follows:
Haploview program, http://www.broad.mit.edu/mpg/haploview
International HapMap Project, http://www.hapmap.org
Online Mendelian Inheritance in Man (OMIM), http://www.omim.org
References
- 1.Willott G.M. Frequency of azoospermia. Forensic Sci. Int. 1982;20:9–10. doi: 10.1016/0379-0738(82)90099-8. [DOI] [PubMed] [Google Scholar]
- 2.Jarow J.P., Espeland M.A., Lipshultz L.I. Evaluation of the azoospermic patient. J. Urol. 1989;142:62–65. doi: 10.1016/s0022-5347(17)38662-7. [DOI] [PubMed] [Google Scholar]
- 3.Matsumiya K., Namiki M., Takahara S., Kondoh N., Takada S., Kiyohara H., Okuyama A. Clinical study of azoospermia. Int. J. Androl. 1994;17:140–142. doi: 10.1111/j.1365-2605.1994.tb01233.x. [DOI] [PubMed] [Google Scholar]
- 4.Reijo R., Alagappan R.K., Patrizio P., Page D.C. Severe oligozoospermia resulting from deletions of azoospermia factor gene on Y chromosome. Lancet. 1996;347:1290–1293. doi: 10.1016/s0140-6736(96)90938-1. [DOI] [PubMed] [Google Scholar]
- 5.Van Assche E., Bonduelle M., Tournaye H., Joris H., Verheyen G., Devroey P., Van Steirteghem A., Liebaers I. Cytogenetics of infertile men. Hum. Reprod. 1996;11(Suppl 4):1–24. doi: 10.1093/humrep/11.suppl_4.1. discussion 25–26. [DOI] [PubMed] [Google Scholar]
- 6.Dohle G.R., Halley D.J., Van Hemel J.O., van den Ouwel A.M., Pieters M.H., Weber R.F., Govaerts L.C. Genetic risk factors in infertile men with severe oligozoospermia and azoospermia. Hum. Reprod. 2002;17:13–16. doi: 10.1093/humrep/17.1.13. [DOI] [PubMed] [Google Scholar]
- 7.Matzuk M.M., Lamb D.J. Genetic dissection of mammalian fertility pathways. Nat. Cell Biol. 2002;4(Suppl):s41–s49. doi: 10.1038/ncb-nm-fertilityS41. [DOI] [PubMed] [Google Scholar]
- 8.Aston K.I., Carrell D.T. Genome-wide study of single-nucleotide polymorphisms associated with azoospermia and severe oligozoospermia. J. Androl. 2009;30:711–725. doi: 10.2164/jandrol.109.007971. [DOI] [PubMed] [Google Scholar]
- 9.Tüttelmann F., Rajpert-De Meyts E., Nieschlag E., Simoni M. Gene polymorphisms and male infertility—a meta-analysis and literature review. Reprod. Biomed. Online. 2007;15:643–658. doi: 10.1016/s1472-6483(10)60531-7. [DOI] [PubMed] [Google Scholar]
- 10.Matzuk M.M., Lamb D.J. The biology of infertility: research advances and clinical challenges. Nat. Med. 2008;14:1197–1213. doi: 10.1038/nm.f.1895. [DOI] [PMC free article] [PubMed] [Google Scholar]
- 11.Nuti F., Krausz C. Gene polymorphisms/mutations relevant to abnormal spermatogenesis. Reprod. Biomed. Online. 2008;16:504–513. doi: 10.1016/s1472-6483(10)60457-9. [DOI] [PubMed] [Google Scholar]
- 12.Xu S., Yin X., Li S., Jin W., Lou H., Yang L., Gong X., Wang H., Shen Y., Pan X. Genomic dissection of population substructure of Han Chinese and its implication in association studies. Am. J. Hum. Genet. 2009;85:762–774. doi: 10.1016/j.ajhg.2009.10.015. [DOI] [PMC free article] [PubMed] [Google Scholar]
- 13.World Health Organization . Fourth Edition. Cambridge University Press; Cambridge, UK: 1999. WHO Laboratory Manual for the Examination of Human Semen and Sperm–Cervical Mucus Interaction. [Google Scholar]
- 14.Price A.L., Patterson N.J., Plenge R.M., Weinblatt M.E., Shadick N.A., Reich D. Principal components analysis corrects for stratification in genome-wide association studies. Nat. Genet. 2006;38:904–909. doi: 10.1038/ng1847. [DOI] [PubMed] [Google Scholar]
- 15.Marchini J., Howie B., Myers S., McVean G., Donnelly P. A new multipoint method for genome-wide association studies by imputation of genotypes. Nat. Genet. 2007;39:906–913. doi: 10.1038/ng2088. [DOI] [PubMed] [Google Scholar]
- 16.Purcell S., Neale B., Todd-Brown K., Thomas L., Ferreira M.A., Bender D., Maller J., Sklar P., de Bakker P.I., Daly M.J., Sham P.C. PLINK: a tool set for whole-genome association and population-based linkage analyses. Am. J. Hum. Genet. 2007;81:559–575. doi: 10.1086/519795. [DOI] [PMC free article] [PubMed] [Google Scholar]
- 17.Pruim R.J., Welch R.P., Sanna S., Teslovich T.M., Chines P.S., Gliedt T.P., Boehnke M., Abecasis G.R., Willer C.J. LocusZoom: regional visualization of genome-wide association scan results. Bioinformatics. 2010;26:2336–2337. doi: 10.1093/bioinformatics/btq419. [DOI] [PMC free article] [PubMed] [Google Scholar]
- 18.Barrett J.C., Fry B., Maller J., Daly M.J. Haploview: analysis and visualization of LD and haplotype maps. Bioinformatics. 2005;21:263–265. doi: 10.1093/bioinformatics/bth457. [DOI] [PubMed] [Google Scholar]
- 19.de Bakker P.I., McVean G., Sabeti P.C., Miretti M.M., Green T., Marchini J., Ke X., Monsuur A.J., Whittaker P., Delgado M. A high-resolution HLA and SNP haplotype map for disease association studies in the extended human MHC. Nat. Genet. 2006;38:1166–1172. doi: 10.1038/ng1885. [DOI] [PMC free article] [PubMed] [Google Scholar]
- 20.Chun-Lai T., Padyukov L., Dhaliwal J.S., Lundström E., Yahya A., Muhamad N.A., Klareskog L., Alfredsson L., Larsson P.T., Murad S., Malaysian Epidemiological Investigation of Rheumatoid Arthritis (MyEIRA) Study Group Shared epitope alleles remain a risk factor for anti-citrullinated proteins antibody (ACPA)—positive rheumatoid arthritis in three Asian ethnic groups. PLoS ONE. 2011;6:e21069. doi: 10.1371/journal.pone.0021069. [DOI] [PMC free article] [PubMed] [Google Scholar]
- 21.Noble J.A., Valdes A.M. Genetics of the HLA region in the prediction of type 1 diabetes. Curr. Diab. Rep. 2011;11:533–542. doi: 10.1007/s11892-011-0223-x. [DOI] [PMC free article] [PubMed] [Google Scholar]
- 22.Anderson C.A., Boucher G., Lees C.W., Franke A., D'Amato M., Taylor K.D., Lee J.C., Goyette P., Imielinski M., Latiano A. Meta-analysis identifies 29 additional ulcerative colitis risk loci, increasing the number of confirmed associations to 47. Nat. Genet. 2011;43:246–252. doi: 10.1038/ng.764. [DOI] [PMC free article] [PubMed] [Google Scholar]
- 23.Chung S.A., Taylor K.E., Graham R.R., Nititham J., Lee A.T., Ortmann W.A., Jacob C.O., Alarcón-Riquelme M.E., Tsao B.P., Harley J.B., SLEGEN Differential genetic associations for systemic lupus erythematosus based on anti-dsDNA autoantibody production. PLoS Genet. 2011;7:e1001323. doi: 10.1371/journal.pgen.1001323. [DOI] [PMC free article] [PubMed] [Google Scholar]
- 24.Jin Y., Birlea S.A., Fain P.R., Gowan K., Riccardi S.L., Holland P.J., Bennett D.C., Herbstman D.M., Wallace M.R., McCormack W.T. Genome-wide analysis identifies a quantitative trait locus in the MHC class II region associated with generalized vitiligo age of onset. J. Invest. Dermatol. 2011;131:1308–1312. doi: 10.1038/jid.2011.12. [DOI] [PMC free article] [PubMed] [Google Scholar]
- 25.Valentonyte R., Hampe J., Huse K., Rosenstiel P., Albrecht M., Stenzel A., Nagy M., Gaede K.I., Franke A., Haesler R. Sarcoidosis is associated with a truncating splice site mutation in BTNL2. Nat. Genet. 2005;37:357–364. doi: 10.1038/ng1519. [DOI] [PubMed] [Google Scholar]
- 26.Hafler D.A., Compston A., Sawcer S., Lander E.S., Daly M.J., De Jager P.L., de Bakker P.I., Gabriel S.B., Mirel D.B., Ivinson A.J., International Multiple Sclerosis Genetics Consortium Risk alleles for multiple sclerosis identified by a genomewide study. N. Engl. J. Med. 2007;357:851–862. doi: 10.1056/NEJMoa073493. [DOI] [PubMed] [Google Scholar]
- 27.Hamza T.H., Zabetian C.P., Tenesa A., Laederach A., Montimurro J., Yearout D., Kay D.M., Doheny K.F., Paschall J., Pugh E. Common genetic variation in the HLA region is associated with late-onset sporadic Parkinson's disease. Nat. Genet. 2010;42:781–785. doi: 10.1038/ng.642. [DOI] [PMC free article] [PubMed] [Google Scholar]
- 28.Spiess A.N., Feig C., Schulze W., Chalmel F., Cappallo-Obermann H., Primig M., Kirchhoff C. Cross-platform gene expression signature of human spermatogenic failure reveals inflammatory-like response. Hum. Reprod. 2007;22:2936–2946. doi: 10.1093/humrep/dem292. [DOI] [PubMed] [Google Scholar]
Associated Data
This section collects any data citations, data availability statements, or supplementary materials included in this article.