

Abstract
Human populations, along with those of many other species, are thought to have contracted into a number of refuge areas at the height of the last Ice Age. European populations are believed to be, to a large extent, the descendants of the inhabitants of these refugia, and some extant mtDNA lineages can be traced to refugia in Franco-Cantabria (haplogroups H1, H3, V, and U5b1), the Italian Peninsula (U5b3), and the East European Plain (U4 and U5a). Parts of the Near East, such as the Levant, were also continuously inhabited throughout the Last Glacial Maximum, but unlike western and eastern Europe, no archaeological or genetic evidence for Late Glacial expansions into Europe from the Near East has hitherto been discovered. Here we report, on the basis of an enlarged whole-genome mitochondrial database, that a substantial, perhaps predominant, signal from mitochondrial haplogroups J and T, previously thought to have spread primarily from the Near East into Europe with the Neolithic population, may in fact reflect dispersals during the Late Glacial period, ∼19–12 thousand years (ka) ago.
Main Text
The last Ice Age, which ended 11.5 thousand years (ka) ago, was an era of great climatic uncertainty, with dispersed populations in some regions driven into safe havens at times of greatest stress such as the Last Glacial Maximum (LGM), ∼26–19 ka ago. Investigating these glacial refugia has long been a favorite pursuit of phylogeographers. The genetic diversities of many species across a huge taxonomic range have been mapped to various putative refugia, often but not always at low latitudes.1,2 Perhaps the clearest example is the Beringian refugium, from which modern humans spread into the Americas.3–5
For humans, the issue is further complicated by the possibility of other dispersals, stimulated, for example, by technological change or social factors rather than climatic oscillation, and models were first provided by archaeologists; in particular, in the case of Europe, by Dolukhanov.6–8 He proposed two major European refugia: one centered on the southwest and one on the northeast. The Franco-Cantabrian “Mediterranean province” provided refuge for the “biotidal” zone of Atlantic Europe,9 connected to less-well-defined regions along the Mediterranean. The “Periglacial province” was on the East European Plain and may have provided a favorable refugium for Upper Palaeolithic communities of central and eastern Europe. These two major zones were dominated by radically different settlement patterns: cave sites in the south and west, and open-air sites in the east.7,8
Substantial archaeological evidence has accumulated for Dolukhanov's basic model. The recolonization of western, central, and northern Europe from the Franco-Cantabrian refugium appears to be documented by the expansion of the Magdalenian industry, coinciding with or slightly preceding global warming beginning ∼15 ka ago.10,11 By the time of the Younger Dryas cold spell that preceded the start of the stable, warm Holocene, 11.5 ka ago, these groups eventually came into contact with Swiderian groups dispersing westwards from the East European Plain, which, unlike Franco-Cantabria, subsequently became depopulated after the re-expansions.8
From the genetic point of view, it has been suggested that the second principal component of classical marker variation in Europe may have been formed by the Late Glacial expansion,12 and there has been evidence from mtDNA for human expansions from the Franco-Cantabrian refugium; namely, signatures in haplogroups V,12,13 H1, H3,14,15 H5,16 and U5b1b17,18 as well as in haplogroup U5b3, indicating dispersal from the Italian Peninsula,19 and in U4 and U5a, indicating expansion from the East European Plain.20,21 As for the male-specific region of the Y chromosome (MSY), previous studies suggested that the European frequency clines associated with R1a-M17 and R1b-M173 (xM17) (now called R1b-M269) might have been due to population expansions from Ukrainian and Franco-Cantabrian refugia, respectively.22–24 Although a more complex scenario is emerging from the progressive improvement of the Y chromosome phylogeny,25–29 signs of post-LGM re-expansions from eastern European, Iberian, and southern Balkan refugia are suggested by the distribution of some R (R1a-M458, R1b-M412)25,27 and I (I-M423)30 subclades, respectively. By contrast, the majority of mtDNA haplogroups J and T131,32 and Y chromosome haplogroup J,22 along with G2a and E1b1b1a1b (on the basis of ancient-DNA studies),33–35 have been proposed as candidates for markers of the Neolithic expansion into Europe from its origin in the Fertile Crescent of the Near East.16
There is, however, another potential refugium for European genetic variation, which is not present in Dolukhanov's model and does not appear to have been considered seriously by either archaeologists or geneticists. Studies have established that populations persisted throughout the last glaciation in parts of the Near East, such as the Levant36 and coastal southern Turkey, and that genetic variation in the Near East encompasses much of the diversity now found in Europe. It is possible that the Near East has been overlooked as a refugium for Europeans because of the emphasis throughout much of the twentieth century on its role as a reservoir for subsequent Neolithic dispersals, which first reached southeastern Europe ∼9 ka ago. For example, the first principal component of variation in classical markers in western Eurasia has often been regarded as evidence for a demic diffusion of people into Europe during the Neolithic period,37 and various mtDNA and MSY lineages thought to originate in the Near East have been proposed as markers of the Neolithic dispersal. Therefore, to investigate the possibility of Late Glacial dispersals into Europe from the Near East ∼19–12 ka ago, we decided to reevaluate the roles of mtDNA haplogroups J and T.
Previous studies comparing haplogroup J and T mtDNAs across the Near East and Europe relied primarily upon variation in the first hypervariable segment of the control region (HVS-I).31,32,38,39 Although they suggest a combination of Neolithic and earlier dispersals, these studies suffer from limited phylogenetic and chronological, and hence also phylogeographic, resolution, which we can now address by assaying the variation in complete mtDNA genomes. Very few whole mtDNA genomes from the Near East have been published, however. (The Near East is broadly the scholarly equivalent of the modern political “Middle East.”40 A broad definition would include the territories between Anatolian Turkey and northeastern Egypt to the west through the territories between the Levant [Israel-Palestine, Lebanon, Jordan, and Syria] and Iraq and Iran to the east, the South Caucasus [Georgia, Armenia, and Azerbaijan] to the north, and Arabia to the south. We generally follow this definition here, but we treat the South Caucasus as a distinct region and include Egypt with the rest of North Africa.) We targeted 215 new J and 165 new T complete mtDNA sequences, focusing particularly on Mediterranean Europe, the Caucasus, and the Near East, selected on the basis of their control-region variation and subhaplogroup status, as identified by restriction analysis, combining them with 522 previously available sequences in a comprehensive phylogenetic analysis.
To significantly increase the size and range of the database available to us and thereby enhance the robustness of our conclusions, we then used these data to infer haplogroup status for sequences in the large control-region database now available, and analyzed these data phylogeographically. The more precise results we have been able to obtain by this approach strongly suggest that though there may indeed be signatures of Neolithic dispersals into Europe, there are also clear indications of Late Glacial movements from the Near East refugium dating back at least ∼16 ka.
For all new subjects involved, we obtained appropriate informed consent and approval from institutional review boards at the Universities of Pavia, Tartu, and Leeds and at the Sorenson Molecular Genealogy Foundation. We amplified and sequenced the mtDNAs as previously described.41 We scored mutations using Sequencher (Gene Codes) relative to the revised Cambridge Reference Sequence (rCRS).42
We generated a maximum-parsimony phylogeny of 902 complete JT sequences (Figures S1 and S2 available online, summarized in Figure 1; sequences listed in Tables S1 and S2). We named clades and subclades according to the nomenclature established by PhyloTree43 and Behar et al.,44 with some exceptions: we considered variants at nucleotide positions (nps) 152, 195, 16261, and 16519 as diagnostic, given that these typically unstable mutations become sufficiently stable in the specific JT genetic environment as to be diagnostically reliable. We estimated coalescence times, using both maximum likelihood (ML) and the ρ statistic45 (Table 1), with the Phylogenic Analysis by ML (PAML) and Network 4 packages and several molecular clocks developed previously.3,46 We then used the substantial volume of control-region data now available (37,239 samples) in order to correct for any biases arising from the use of targeted whole genomes when drawing phylogeographic inferences and to provide much larger sample sizes. We examined the geographic distribution of haplogroups J and T and their subclades using the HVS-I database, taking into account HVS-II information where available, and using the whole-genome tree to classify as many as possible into subclades (Tables S3 and S4). We presented the data visually as both phylogenetic networks (using Network 4 with heavy weighting to enforce the whole-genome tree topology as much as possible) and Surfer spatial distribution maps (Figure S3). We also used Network 4 and DnaSP to calculate diversity indices in western Eurasia for haplogroups that we inferred from the HVS-I database (Table S5). We assigned the most likely source region for major clades in the whole-sequence tree with reference to the HVS-I networks and diversity statistics, although the latter required interpretation in light of the former; in complex demographic scenarios, exemplified by human prehistory, the region with the highest diversity is not necessarily always the most likely source. We identified likely founder lineages by using basic phylogeographic principles, as used before for the founder analysis of HVS-I data.32 For example, a situation in which a clade whose members are found primarily in one region, but which nests within a deeper clade whose members are found in a second region, suggests that the second region is most likely the source and that there has been a dispersal to the first (sink) region at some time during the evolution of the branch defining the nested subclade. Such geographic specificity is rarely 100% precise; we pinpointed potential back-migrants from sink to source as isolated derived subtypes within clusters of sink lineages.
Figure 1.
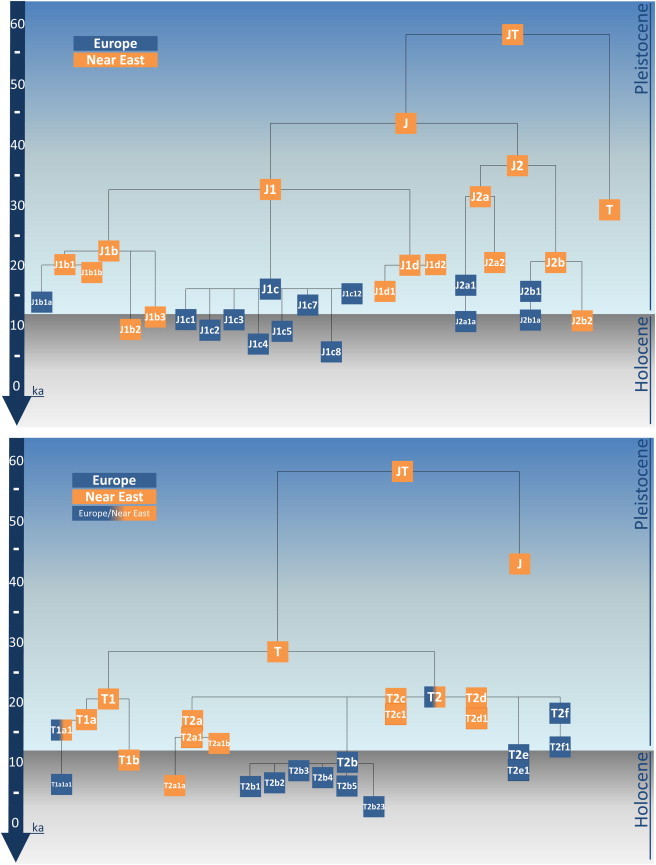
Schematic Representation of J and T Phylogenies
The trees are based on the maximum-parsimony phylogenetic tree of 902 complete mtDNA sequences shown in detail in Figures S1 and S2. Clades and subclades have been colored according to their inferred geographic origin.
Table 1.
Ages Calculated for the Entire JT Phylogeny with the Use of ML and ρ Estimates
| Clade | n |
ML Estimates (ka) |
ρ Estimates (ka) |
|
|---|---|---|---|---|
| Complete Sequencea | Complete Sequencea | Coding Regionb | ||
| JT | 902 | 58.0 ± 7.5 | 56.2 ± 7.4 | 55.8 ± 8.8 |
| J | 451 | 43.3 ± 6.1 | 34.5 ± 4.9 | 30.3 ± 5.0 |
| >J1 | 337 | 33.3 ± 6.2 | 25.0 ± 4.0 | 21.5 ± 3.7 |
| > > J1b | 74 | 23.1 ± 3.1 | 21.9 ± 3.3 | 24.2 ± 4.7 |
| > > > J1b1 | 39 | 20.5 ± 2.9 | 22.9 ± 4.5 | 22.6 ± 5.5 |
| > > > > J1b1a | 25 | 14.2 ± 2.8 | 12.9 ± 2.7 | 11.8 ± 2.1 |
| > > > > J1b1b | 14 | 18.2 ± 3.2 | 17.6 ± 3.9 | 17.1 ± 4.6 |
| > > > J1b2 | 13 | 9.3 ± 4.2 | 6.0 ± 2.1 | 7.1 ± 3.2 |
| > > > J1b3 | 5 | 11.8 ± 5.6 | 7.4 ± 2.5 | 5.5 ± 2.6 |
| > > J1c | 234 | 16.4 ± 2.0 | 13.5 ± 1.4 | 14.1 ± 1.5 |
| > > > J1c1 | 30 | 11.1 ± 1.9 | 11.1 ± 1.9 | 13.2 ± 2.8 |
| > > > J1c2 | 63 | 9.5 ± 1.4 | 9.4 ± 1.3 | 10.9 ± 1.7 |
| > > > J1c3 | 41 | 11.1 ± 2.5 | 10.5 ± 1.6 | 11.1 ± 1.8 |
| > > > J1c4 | 14 | 7.9 ± 2.4 | 5.2 ± 1.3 | 5.3 ± 1.7 |
| > > > J1c5 | 14 | 9.0 ± 2.2 | 8.1 ± 1.6 | 10.2 ± 2.4 |
| > > > J1c7 | 36 | 13.6 ± 3.7 | 12.3 ± 3.0 | 11.9 ± 3.9 |
| > > > J1c8 | 9 | 5.8 ± 2.3 | 4.6 ± 1.2 | 3.1 ± 1.3 |
| > > > J1c12 | 7 | 15.3 ± 2.1 | 18.6 ± 3.5 | 21.1 ± 4.7 |
| > > J1d | 28 | 19.9 ± 5.9 | 16.5 ± 2.4 | 16.6 ± 2.8 |
| > > > J1d1 | 11 | 15.6 ± 4.8 | 12.6 ± 3.4 | 13.8 ± 4.2 |
| > > > J1d2 | 17 | 19.9 ± 5.9 | 17.2 ± 2.5 | 18.4 ± 3.4 |
| >J2 | 114 | 36.8 ± 5.5 | 32.9 ± 5.0 | 33.4 ± 6.0 |
| > > J2a | 54 | 31.9 ± 5.1 | 33.9 ± 6.0 | 30.6 ± 6.4 |
| > > > J2a1 | 29 | 16.4 ± 5.1 | 13.9 ± 4.1 | 14.6 ± 5.1 |
| > > > > J2a1a | 27 | 10.9 ± 2.4 | 8.4 ± 1.9 | 9.6 ± 3.0 |
| > > > J2a2 | 25 | 20.3 ± 3.5 | 18.7 ± 3.0 | 19.9 ± 3.6 |
| > > J2b | 60 | 20.2 ± 4.3 | 15.3 ± 3.1 | 18.5 ± 4.5 |
| > > > J2b1 | 55 | 15.6 ± 2.4 | 12.4 ± 1.7 | 13.5 ± 1.6 |
| > > > > J2b1a | 27 | 11.3 ± 1.8 | 9.3 ± 1.3 | 10.1 ± 1.9 |
| > > > J2b2 | 5 | 11.2 ± 3.8 | 9.0 ± 2.5 | 9.2 ± 3.9 |
| T | 451 | 28.8 ± 6.4 | 27.8 ± 4.5 | 26.1 ± 5.3 |
| >T1 | 144 | 21.0 ± 6.6 | 20.3 ± 4.9 | 13.8 ± 2.6 |
| > > T1a | 126 | 17.2 ± 2.9 | 15.6 ± 3.4 | 14.3 ± 3.0 |
| > > > T1a1 | 102 | 15.5 ± 2.8 | 13.1 ± 3.1 | 14.0 ± 3.6 |
| > > > > T1a1a | 78 | 11.0 ± 3.9 | 9.0 ± 2.7 | 13.1 ± 4.6 |
| > > > > > T1a1a1 | 75 | 6.8 ± 0.9 | 6.4 ± 0.7 | 8.5 ± 1.2 |
| > > > T1a2 | 7 | 6.5 ± 4.1 | 6.0 ± 2.9 | 5.3 ± 3.5 |
| > > > T1a3 | 5 | 15.1 ± 2.9 | 14.5 ± 2.9 | 18.4 ± 4.1 |
| > > T1b | 16 | 10.8 ± 2.6 | 7.7 ± 1.5 | 10.1 ± 2.4 |
| >T2 | 307 | 21.3 ± 2.3 | 19.8 ± 2.6 | 20.5 ± 3.4 |
| > > T2a | 38 | 17.1 ± 3.9 | 16.0 ± 3.8 | 21.5 ± 6.1 |
| > > > T2a1 | 35 | 14.5 ± 3.0 | 13.6 ± 3.0 | 18.2 ± 4.7 |
| > > > > T2a1a | 23 | 6.3 ± 1.5 | 6.5 ± 1.4 | 8.2 ± 2.1 |
| > > > > T2a1b | 9 | 13.5 ± 1.8 | 17.4 ± 3.6 | 23.6 ± 5.6 |
| > > T2b | 146 | 9.7 ± 1.1 | 10.3 ± 1.0 | 9.8 ± 1.2 |
| > > > T2b1 | 5 | 6.2 ± 2.0 | 5.2 ± 1.7 | 6.5 ± 2.4 |
| > > > T2b2 | 12 | 7.6 ± 1.9 | 9.0 ± 2.9 | 6.1 ± 1.7 |
| > > > T2b3 | 18 | 8.8 ± 2.6 | 13.1 ± 3.5 | 4.4 ± 1.6 |
| > > > T2b4 | 21 | 8.2 ± 1.8 | 8.7 ± 1.6 | 8.6 ± 1.7 |
| > > > T2b5 | 7 | 6.4 ± 2.5 | 6.4 ± 2.4 | 5.3 ± 2.3 |
| > > > T2b23 | 5 | 3.3 ± 1.8 | 15.8 ± 3.6 | 17.5 ± 4.8 |
| > > T2c | 28 | 20.3 ± 2.4 | 26.6 ± 5.7 | 24.5 ± 5.9 |
| > > > T2c1 | 27 | 18.5 ± 2.7 | 21.2 ± 4.0 | 20.7 ± 3.8 |
| > > T2d | 10 | 20.4 ± 2.4 | 30.4 ± 5.7 | 32.3 ± 6.4 |
| > > > T2d1 | 7 | 17.1 ± 3.4 | 24.0 ± 5.2 | 27.0 ± 6.1 |
| > > T2e | 32 | 11.1 ± 2.3 | 10.4 ± 1.8 | 8.9 ± 1.3 |
| > > > T2e1 | 10 | 9.1 ± 2.4 | 9.0 ± 1.8 | 10.1 ± 2.3 |
| > > T2f | 18 | 17.1 ± 4.0 | 18.7 ± 4.9 | 21.0 ± 6.5 |
| > > > T2f1 | 12 | 12.1 ± 3.7 | 16.2 ± 5.8 | 20.0 ± 8.4 |
| > > > T2f2 | 3 | 7.0 ± 3.3 | 6.1 ± 2.3 | 7.7 ± 3.4 |
| > > T2g | 8 | 11.3 ± 4.5 | 8.2 ± 2.2 | 6.9 ± 4.2 |
| > > T2h | 5 | 15.5 ± 3.4 | 12.3 ± 2.8 | 15.7 ± 4.0 |
Ages are shown for all J and T subclades until the fourth hierarchical level and, in general, only when encompassing at least five individuals.
According to the time-dependent clock of Soares et al.;46 ML and ρ used for calculations.
The JT tree (outlined in Figure 1; see Figures S1 and S2 for details) confirms the presence of two main phylogenetic clusters, J and T, with no intermediates. The ML age estimates suggest that JT arose ∼58 ka ago, probably before the settlement of the Fertile Crescent according to current evidence, and that J and T diverged within the timeframe of settlement in the Fertile Crescent, ∼40 ka (with ML; ∼35 ka with ρ) and ∼30 ka ago, respectively (Table 1). Fragments of both J and T now extend well beyond their core Near Eastern and European range into North Africa, the Indian subcontinent, and central Asia (Figure 2, Table S3). Several age estimates for deeper coalescences within J (J itself and J1) are substantially older when calculated with ML than when calculated with ρ, but most estimates are comparable across methods.
Figure 2.
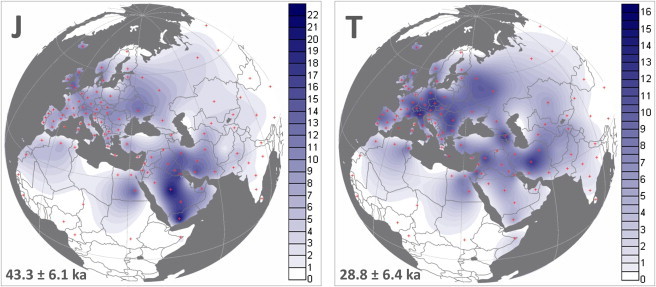
Spatial Frequency Distribution Maps of Haplogroups J and T and Geographical Locations of Populations Surveyed
Coalescence ages are reported according to ML estimates. Populations and corresponding percentage frequency values are listed in Table S3.
Haplogroup J makes up almost 9% of mtDNAs in Europe and ∼13% in the Near East. The geographic distribution of its subclades supports the view that haplogroup J initially diversified in the Near East. A single lineage from the North Caucasus, defined only by the recurrent HVS-I transition at np 16193, branches immediately before J1d in our tree, and may represent a paraphyletic lineage within J1. If so, it would be the only lineage found not to fall within one of the five major subclades of haplogroup J; possible related lineages in the control-region database are found in Turkey, close to the likely source area for J1.
Haplogroup J1 (Figure S1), dating to ∼33 ka ago (with ML; ∼25 ka ago with ρ), encompasses ∼80% of total J lineages and includes three subclades that originated in rapid succession around the time of the LGM. Both J1b (∼23 ka ago) and J1d (∼20 ka ago) are predominantly Near Eastern. J1b is found especially in Iran and Arabia, with a European subclade, J1b1a, dating to ∼14 ka ago. J1d extends from the Near East and Arabia into eastern Africa, Iran, the North Caucasus, and central Asia.
J1c, on the other hand, which dates to ∼16 ka ago, is found primarily in Europe, especially central Europe, the Balkans, and the Ukraine, where it encompasses almost 80% of total J1 lineages. Although it is found in parts of the Near East at low frequencies, the HVS-I network indicates that these are either very common or tip lineages, suggesting that they are the result of more recent back-migration from Europe. The whole-genome tree shows a clear star-like pattern with at least 12 basal subclades, most dating to 10–15 ka ago. Haplogroup J, often identified as J1 and in a few cases as J1c, has been found in Neolithic remains from northern Spain, France, Germany, and Sweden and in a Mesolithic specimen from Germany dated to 4.5–5.5 ka ago.34,35,47–50
The much rarer haplogroup J2 (Figure S1) is also older, dating to ∼37 ka ago overall and comprising J2a and J2b, which date to ∼32 and ∼20 ka ago. It is predominantly Near Eastern but has European subclades J2a1 and J2b1, both of which date to 15–16 ka ago. Within Europe, J2a1 is focused mainly in central Europe and is largely comprised of J2a1a, which dates to ∼11 ka ago, whereas its minor sister subclade J2a1b has been seen only in Greece and Italy. J2b1 is focused more on Mediterranean-central and Atlantic Europe, with the Near Eastern part of the clade also found on the East European Plain. Its almost-entirely-European subclade, J2b1a, dates to ∼11 ka ago.
The Near Eastern and Arabian parts of both J2a and J2b also spill into northeastern Africa and, in the case of the former, northwestern Africa as well; J2a2b is found across northwestern Africa and even as far afield as Siberia, and J2a2d is also found in Algeria and the Canary Islands.
Like haplogroup J, haplogroup T falls into two distinct subclades, T1 and T2. However, the structure of these subclades is more complex than that of the five nested subclades found in J. Both T1 and T2 include several paraphyletic lineages, and whereas T1 falls into just two nested subclades, T2 displays at least nine, although a single one, T2b, encompasses about half of T2 among Europeans.
Haplogroup T makes up almost 10% of mtDNAs in Europe and ∼8% in the Near East. Like J1 and J2, T1 and T2 most likely originated in the Near East, and both date to ∼21 ka ago, although the origin of T2 is the least clear and an ancient presence in Europe is possible. T1 represents ∼2% of overall genetic variability in western Europe and ∼3% in eastern Europe and the Near East, whereas T2 reaches ∼8% in western Europe and ∼5% in the Near East.
T1 (Figure S2) divides into the major T1a and the minor T1b subclades, dating to ∼17 ka and ∼11 ka ago, respectively. There is also a single paraphyletic T1∗ lineage, sampled in Iran, and a possible additional one from Iraq (although the latter in particular could be a revertant). Possible HVS-I matches to the former occur in Iran, Greece, Macedonia, Armenia, and a number of locations across central Asia, as far northeast as Siberia.
T1a represents ∼90% of total T1, and our new data have prompted substantial revision of its tree structure and nomenclature. Alongside minor subclades T1a2, T1a3, and T1a4, as well as several (mainly European) paraphyletic T1a∗ lineages, 80% of samples in the T1 tree fall within the subclade T1a1 (dating to ∼15.5 ka ago), and 70% of the samples in T1a1 fall within T1a1a1 (Table S2). The geographic distribution of T1 is extraordinary—lineages are distributed, albeit at varying frequencies, across its range throughout the tree, from northwestern Africa throughout Europe, the Caucasus, and the Near East, into western India, and across central Asia into Siberia. The South Asian lineages tend to cluster with or match Near Eastern ones in the HVS-I network, but common HVS-I types frequently match across an extremely wide range. Indeed, the root type of T1a1a1, dating to ∼7 ka ago, is very unusual among whole-genome mtDNA types in that it is shared between multiple geographically distant individuals from Scandinavia, the Baltic, the North Caucasus, Anatolia, and Morocco. The distribution of T1a is both widespread and patchy, although at low frequencies overall, the values rise to ∼5% in the South Caucasus, ∼6% in northeastern Iran, ∼8% in Tunisia, and almost 9% in Romania (Table S3). Curiously, despite the age of T1a1a1, it has not been seen in any Neolithic remains to date.33–35,47–49 T1b, by contrast, is much less common and is largely restricted to the Near East, where it reaches ∼2% in eastern Anatolia and southern Iraq but is vanishingly infrequent elsewhere.
Haplogroup T2 (Figure S2), which dates to ∼21 ka ago, forms the major part of haplogroup T in terms of both frequency (predominating in western Europe, where it reaches ∼80% of total T lineages) and number of basal clades (at least nine, T2a–T2i). T2 is most frequent in Mediterranean and central and western Europe (∼8%, reaching almost 13% in northern Italy) but is also common (up to ∼10%) in some parts of the Levant and Iran. The whole-genome data show that about three-quarters of T2 variation in Europe can be classified into subclades through the use of HVS-I data, but less than half of the variation in the Near East and the Caucasus can be so classified.
By far the most common subclade within T2 is T2b, which is predominantly European, dates to ∼10 ka ago, and is quite star-like, with 13 named basal subclades (T2b1–T2b24), along with at least seven more unnamed subclades represented by only two complete sequences each, as well as a large number of (mostly European) paraphyletic T2b∗ lineages; no doubt many more subclades remain to be discovered. The larger of the T2b subclades date to ∼6–9 ka ago and are predominantly European, albeit with evidence of substantial gene flow into the Near East. A clear example is T2b4, which includes a small derived subclade, identifiable in the HVS-I network, which appears to have spread into the Gulf region and further into Nepal, but the existence of several other lineages (either matching common and diverse European lineages or those derived from predominantly European clusters) throughout the HVS-I network points to multiple migrations into the Near East from Europe. Near Eastern matches usually include eastern Europeans, suggesting a probable route back into the Near East. The early presence of T2 in Europe (even with the assumption that it arose in the Near East) suggests that ancestors of T2b might have been present in Europe well before the age of T2b itself, at any time back to the LGM, although T2b seems to have been dispersed within Europe during the early Neolithic period. T2b has been identified in Neolithic remains from Italy, Spain, France, Germany, and Sweden.33–35,47–49 It has also been identified in a Mesolithic Pitted Ware sample from Scandinavia, dating to 4.0–4.8 ka ago, during the period of coexistence with Funnel Beaker farming communities, suggesting the possibility of assimilation of lineages from the Neolithic period into the hunter-gatherer population.46
Several of the minor subclades also appear to have a European origin. The two subclades of T2f, which dates to ∼17 ka ago, are both recognizable in HVS-I and appear to be almost entirely European, with very minor dispersal back into the Near East, mainly the Levant. T2f1, dating to ∼12 ka ago, is more frequent in north-central Europe but extends across eastern Europe and into central Asia, whereas the younger T2f2, dated to ∼7 ka ago, has a more restricted distribution in Italy, the Balkans, and north of the Black Sea. Moreover, there is a T2f∗ sequence from France. T2a dates to ∼17 ka ago and appears to have originated in the Near East and spread to Europe in several waves of dispersal. Its major subclade, T2a1, dates to ∼14.5 ka ago and divides into two further subclades, T2a1a (∼6 ka ago) and T2a1b (∼13.5 ka ago), which appear likely to have entered Europe during the Neolithic and the Late Glacial periods, respectively. Only T2a1b is detectable in HVS-I data; it has a patchy distribution, being mainly distributed around the Mediterranean but also in parts of northern and eastern Europe (Figure S3). Its HVS-I network suggests a possible dispersal from Europe back into the Near East ∼7–8 ka ago. T2e also has a clearly identifiable HVS-I motif and, dating to ∼11 ka ago, also appears to be predominantly southern European and Mediterranean. It is also present as far as Scandinavia (with a founder effect in Iceland), with a patchy distribution and some spread into Egypt and the Near East, especially Arabia. It has been identified in two Mesolithic remains from Germany dating to ∼4.5–5.4 ka ago.48
T2c and T2d, on the other hand, appear to have a Near Eastern origin around the time of the LGM and more recent dispersals into Europe. Most of T2c comprises haplogroup T2c1, which is identifiable from HVS-I and appears likely to have a Near Eastern origin ∼18.5 ka ago and dispersals into Europe within the past ∼10 ka. Apart from a peak in Cyprus, it is most common in the Gulf region but is also found in the Levant and in Mediterranean Europe, with a more far-flung distribution at very low levels. The antiquity of T2c, at ∼20 ka ago, makes it the first subclade to diverge from T2, and if we assume a Near Eastern origin for T2, then a Near Eastern ancestry for T2c would also make sense. The earliest diverging sequence in the whole-genome tree, prior to the emergence of T2c1, is from India, also hinting at a Near Eastern rather than a European origin for T2c (although the affiliation of this sequence is supported by only a single coding-region position and could be spurious). T2d is the same age as T2c and also has a curious distribution that might suggest a possible Near Eastern origin. All of the six whole genomes of known ancestry within T2d1 (dating to ∼17 ka ago) are from India, Siberia, or Mongolia, and of the HVS-I sequences identified within T2d1a, three are from India and two are from Iran. The three whole T2d2 genomes, unidentifiable with HVS-I, are from Iran, Georgia, and Italy.
Several minor T2 subclades, such as T2g, T2h, and T2i, are found in both Europe and the Near East and remain enigmatic. Additional subclades, represented by only two complete mtDNAs each, along with many more paraphyletic members of T2, have so far been seen almost exclusively in Europe and date collectively (as a paragroup) to the Late Glacial period.
Before drawing conclusions from these data, several methodological points should be made. First, well-sourced control-region data are far from becoming redundant in the age of whole mtDNA genomes, at least until the latter are numbered in their tens or hundreds of thousands, because the level of phylogeographic information increases directly with the sample size. Second, however, the various population-diversity statistics calculated from HVS-I data (and probably other genetic systems as well) are often contradictory (Table S5), and, even when this is not the case, they cannot reliably be used, for example, to pinpoint source populations in any algorithmic fashion. Rather, this can be attempted only with reference to a phylogeny, if any effort is to be made to account for the complexity of real human dispersal patterns. Of course, this caveat concerning diversity statistics applies even more to haplogroup frequencies.
Third, there are cases where control-region sequences, although valuable, are difficult to analyze in the absence of knowledge of the phylogenetic tree topology that comes from whole genomes. Incorrect network reconstructions resulting from excessive homoplasy may lead to the misidentification of founder lineages and, in rare cases, such as position 16296 in haplogroup T2,51 may result in overestimation of coalescence or founder times. Although an HVS-I network of haplogroup T, for example (position 16296 aside), maps reasonably cleanly onto the structure of the whole-genome tree, this is much less true for haplogroup J, where the deepest split is invisible and a number of sites that are not normally hypervariable evolved several times in different parts of the tree, such that different branches are conflated in the HVS-I phylogeny. In both cases, at any rate, there are hidden branches, and therefore hidden phylogeographic structure, in the HVS-I analyses that appear only in the whole-genome tree; it is some of these, for example, that now suggest a European presence of a number of lineages long before the arrival of the Neolithic period.
Our analysis confirms that haplogroups J and T and their major subclades (J1 and J2, T1 and T2) most likely arose in the Near East between the time of first settlement by modern humans and the LGM. The overall age estimate for JT is very similar to that for the second basal haplogroup R clade in western Eurasia, haplogroup U, at ∼58 ka ago. Both date to the beginning of the pluvial marine isotope stage (MIS) 3, at which point haplogroup R lineages emerging in the vicinity of the Gulf Oasis on the southern route out of Africa are likely to have begun their dispersal north into the Fertile Crescent.52,53 It seems plausible to regard JT and U as belonging to members of the same early human group, ancestral to both Near Easterners and Europeans.
Haplogroups J and T evidently started to spread from the Near East into Europe immediately after the peak of the last glaciation, ∼19 ka ago, with major expansions in Europe in the Late Glacial period, ∼16–12 ka ago, signaled in particular by J1c, J1b1a, J2a1, T1a1, T2a1b, and T2f1, and in the immediate postglacial period, ∼10–11 ka ago, signaled by T2b and T2e. The clearest evident signal that dates to the Neolithic period is T1a1a1, which is extremely widespread and dates to ∼7 ka ago, but the distribution of diversity in the whole-sequence tree suggests that this may have been an expansion that began in Europe and spread to the Near East, central Asia, and North Africa. Indeed, several lineages previously thought to have spread to Europe during the Neolithic period can now be seen to have arrived during the Late Glacial period and subsequently dispersed: a clear example is J2a1, which appears likely to have arisen in Europe at least 16 ka ago but to have dispersed across central Europe ∼11 ka ago, in the form of the subclade J2a1a. Similarly, J1b1a appears to have arrived in Europe by at least 14 ka ago but to have spread beyond Mediterranean Europe only ∼8 ka ago. Indeed, the major T2 lineage, T2b, although displaying a star-like pattern dating to ∼10 ka ago, suggesting an expansion across Europe at the time of the early Neolithic period, may well have arisen indigenously within Europe from a T2 ancestor.
Our results show, therefore, that both J and T lineages first entered Europe from the Near East prior to the Neolithic period, in the Late Glacial period beginning ∼19 ka—and that, by implication, many of the Neolithic expansions from southeastern Europe into central Europe and the Mediterranean might have been indigenous dispersals of these lineages. Therefore, they support Dolukhanov's model of Late Glacial re-expansions but suggest a modification to the model proposing the expansions to have taken place primarily from refugia in Franco-Iberia and the Ukraine.8 We therefore need to ask whether there is any archaeological signature that might indicate dispersal from the Near East into southeastern Europe in this timeframe.
Western Anatolia is clearly a possible bridge for such dispersals. There is significant evidence for human settlement on the southern flanks of the Taurus mountains from the LGM through the Late Glacial period, notably in the Antalya area,54 suggesting that the archaeologically well-represented populations of the Levant continued along the more extensive Late Glacial coastal plain of southern Turkey and neighboring Taurus flanks. Dispersal along such coastal areas is thus quite plausible, although currently there is no convincing substantive evidence for an Epipalaeolithic population in the coastal areas of Aegean Anatolia. This might be due to sea-level rise and alluviation and colluviation of valleys in western Turkey.
The mass of the Anatolian plateau, over 1,000 m above sea level, might be considered challenging for Late Glacial populations. Until recently the Epipalaeolithic community of the Anatolian plateau was unknown, but we now have evidence for such a community in the Bølling-Allerød Late Glacial climatic amelioration that commenced ∼14.7 ka ago, via Baird's excavations at the site of Pınarbaşı.55 This Epipalaeolithic plateau community showed significant links with Mediterranean coasts and the Levant and suggests that highly mobile groups were ranging widely over parts of the Anatolian plateau.55 This opens up the possibility that Late Glacial western Anatolian plateau populations may also have ranged into Europe, perhaps via land bridges across the Dardanelles and the Bosphorus, which arose during glacial periods.
We should also consider the appearance of the rather weakly defined and poorly understood Epi-Gravettian industry in Mediterranean and eastern Europe from ∼18 ka ago onward.56 This is often thought to have arisen from the European Gravettian and/or the Late Aurignacian industries,56 but a case might be made for a hybrid industry emerging as a result of cross-fertilization from new arrivals, perhaps present only in a minority, from the Near East. Renewed archaeological attention might help to illuminate this issue further. In particular, in addition to southeastern Europe, further work in Anatolia would seem to be key to testing the model suggested by mtDNA.
Acknowledgments
We thank Dimitar Dimitrov, Mukaddes Gölge, Oksana Naumova, Ariella Oppenheim, Mark Thomas, and the donors themselves, for generously providing DNA samples. M.P. was supported by Marie Curie Early Stage Training “Advanced Genetic Analysis in the Postgenomic Era” (European Union MEST-CT-2004-504318) and by a Newton International Fellowship. This research was also supported by the Italian Ministry of Education, University, and Research: Progetti FIRB-Futuro in Ricerca 2008 (to A.A. and A.O.), and Progetti Ricerca Interesse Nazionale 2009 (to A.A., O.S. and A.T.); Fondazione Alma Mater Ticinensis (to A.T. and O.S.); the European Commission, Directorate-General for Research (FP7 Ecogene grant number 205419, to R.V.); the European Union Regional Development Fund (through the Centre of Excellence in Genomics, to R.V.); the Estonian Ministry of Education and Research (Basic Research grant numbers SF 0270177As08, to R.V., and SF 0270177Bs08, to E.M.); the Estonian Science Foundation (grant number 7858, to E.M.); and the FCT (Portuguese Foundation for Science and Technology), through research project PTDC/CS-ANT/113832/2009 and personal grants to J.B.P. (SFRH/BD/45657/2008) and P.S. (SFRH/BPD/64233/2009). P.S. also received support from the DeLaszlo Foundation. N.A.-Z. was supported by the Institute of International Education fellowship. IPATIMUP is an Associate Laboratory of the Portuguese Ministry of Science, Technology, and Higher Education (FCT) and is partially supported by FCT.
Supplemental Data
Web Resources
The URLs for data presented herein are as follows:
mtDNA rate calculator, http://www.fbs.leeds.ac.uk/staff/Richards/Soares_mtDNA_rate_calculator.xls
Network 4 phylogenetic software package, http://www.fluxus-engineering.com/sharenet.htm
DnaSP, http://www.ub.edu/dnasp/
Accession Numbers
The GenBank accession numbers for the 380 sequences reported in this paper are JQ797760–JQ798139.
References
- 1.Hewitt G. The genetic legacy of the Quaternary ice ages. Nature. 2000;405:907–913. doi: 10.1038/35016000. [DOI] [PubMed] [Google Scholar]
- 2.Feliner G.N. Southern European glacial refugia: A tale of tales. Taxon. 2011;60:365–372. [Google Scholar]
- 3.Perego U.A., Achilli A., Angerhofer N., Accetturo M., Pala M., Olivieri A., Hooshiar Kashani B., Ritchie K.H., Scozzari R., Kong Q.-P. Distinctive Paleo-Indian migration routes from Beringia marked by two rare mtDNA haplogroups. Curr. Biol. 2009;19:1–8. doi: 10.1016/j.cub.2008.11.058. [DOI] [PubMed] [Google Scholar]
- 4.Perego U.A., Angerhofer N., Pala M., Olivieri A., Lancioni H., Hooshiar Kashani B., Carossa V., Ekins J.E., Gómez-Carballa A., Huber G. The initial peopling of the Americas: a growing number of founding mitochondrial genomes from Beringia. Genome Res. 2010;20:1174–1179. doi: 10.1101/gr.109231.110. [DOI] [PMC free article] [PubMed] [Google Scholar]
- 5.Tamm E., Kivisild T., Reidla M., Metspalu M., Smith D.G., Mulligan C.J., Bravi C.M., Rickards O., Martinez-Labarga C., Khusnutdinova E.K. Beringian standstill and spread of Native American founders. PLoS ONE. 2007;2:e829. doi: 10.1371/journal.pone.0000829. [DOI] [PMC free article] [PubMed] [Google Scholar]
- 6.Gamble C. People on the move: Interpretations of regional variation in Palaeolithic Europe. In: Chapman J., Dolukhanov P., editors. Cultural transformations and interactions in Eastern Europe. Avebury; Aldershot: 1993. pp. 37–55. [Google Scholar]
- 7.Dolukhanov P. Foraging and farming groups in north-eastern and north-western Europe: identity and interaction. In: Chapman J., Dolukhanov P., editors. Cultural Transformations and Interactions in Eastern Europe. Avebury; Aldershot: 1993. pp. 122–145. [Google Scholar]
- 8.Dolukhanov P. Longman; London: 1996. The early Slavs. [Google Scholar]
- 9.Gamble C. Human display and dispersal: A case study from biotidal Britain in the Middle and Upper Pleistocene. Evol. Anthropol. 2009;18:144–156. [Google Scholar]
- 10.Housley R.A., Gamble C.S., Street M., Pettitt P. Radiocarbon evidence for the Lateglacial human recolonisaton of northern Europe. Proceedings of the Prehistoric Society. 1997;63:25–54. [Google Scholar]
- 11.Gamble C., Davies W., Pettitt P., Hazelwood L., Richards M. The archaeological and genetic foundations of the European population during the Late Glacial: implications for ‘agricultural thinking’. Camb. Archaeol. J. 2005;15:193–223. [Google Scholar]
- 12.Torroni A., Bandelt H.-J., Macaulay V., Richards M., Cruciani F., Rengo C., Martinez-Cabrera V., Villems R., Kivisild T., Metspalu E. A signal, from human mtDNA, of postglacial recolonization in Europe. Am. J. Hum. Genet. 2001;69:844–852. doi: 10.1086/323485. [DOI] [PMC free article] [PubMed] [Google Scholar]
- 13.Torroni A., Bandelt H.-J., D'Urbano L., Lahermo P., Moral P., Sellitto D., Rengo C., Forster P., Savontaus M.L., Bonné-Tamir B., Scozzari R. mtDNA analysis reveals a major late Paleolithic population expansion from southwestern to northeastern Europe. Am. J. Hum. Genet. 1998;62:1137–1152. doi: 10.1086/301822. [DOI] [PMC free article] [PubMed] [Google Scholar]
- 14.Achilli A., Rengo C., Magri C., Battaglia V., Olivieri A., Scozzari R., Cruciani F., Zeviani M., Briem E., Carelli V. The molecular dissection of mtDNA haplogroup H confirms that the Franco-Cantabrian glacial refuge was a major source for the European gene pool. Am. J. Hum. Genet. 2004;75:910–918. doi: 10.1086/425590. [DOI] [PMC free article] [PubMed] [Google Scholar]
- 15.Pereira L., Richards M., Goios A., Alonso A., Albarrán C., Garcia O., Behar D.M., Gölge M., Hatina J., Al-Gazali L. High-resolution mtDNA evidence for the late-glacial resettlement of Europe from an Iberian refugium. Genome Res. 2005;15:19–24. doi: 10.1101/gr.3182305. [DOI] [PMC free article] [PubMed] [Google Scholar]
- 16.Soares P., Achilli A., Semino O., Davies W., Macaulay V., Bandelt H.-J., Torroni A., Richards M.B. The archaeogenetics of Europe. Curr. Biol. 2010;20:R174–R183. doi: 10.1016/j.cub.2009.11.054. [DOI] [PubMed] [Google Scholar]
- 17.Tambets K., Rootsi S., Kivisild T., Help H., Serk P., Loogväli E.L., Tolk H.V., Reidla M., Metspalu E., Pliss L. The western and eastern roots of the Saami—the story of genetic “outliers” told by mitochondrial DNA and Y chromosomes. Am. J. Hum. Genet. 2004;74:661–682. doi: 10.1086/383203. [DOI] [PMC free article] [PubMed] [Google Scholar]
- 18.Achilli A., Rengo C., Battaglia V., Pala M., Olivieri A., Fornarino S., Magri C., Scozzari R., Babudri N., Santachiara-Benerecetti A.S. Saami and Berbers—an unexpected mitochondrial DNA link. Am. J. Hum. Genet. 2005;76:883–886. doi: 10.1086/430073. [DOI] [PMC free article] [PubMed] [Google Scholar]
- 19.Pala M., Achilli A., Olivieri A., Hooshiar Kashani B., Perego U.A., Sanna D., Metspalu E., Tambets K., Tamm E., Accetturo M. Mitochondrial haplogroup U5b3: a distant echo of the epipaleolithic in Italy and the legacy of the early Sardinians. Am. J. Hum. Genet. 2009;84:814–821. doi: 10.1016/j.ajhg.2009.05.004. [DOI] [PMC free article] [PubMed] [Google Scholar]
- 20.Malyarchuk B., Grzybowski T., Derenko M., Perkova M., Vanecek T., Lazur J., Gomolcak P., Tsybovsky I. Mitochondrial DNA phylogeny in Eastern and Western Slavs. Mol. Biol. Evol. 2008;25:1651–1658. doi: 10.1093/molbev/msn114. [DOI] [PubMed] [Google Scholar]
- 21.Malyarchuk B., Derenko M., Grzybowski T., Perkova M., Rogalla U., Vanecek T., Tsybovsky I. The peopling of Europe from the mitochondrial haplogroup U5 perspective. PLoS ONE. 2010;5:e10285. doi: 10.1371/journal.pone.0010285. [DOI] [PMC free article] [PubMed] [Google Scholar]
- 22.Semino O., Passarino G., Oefner P.J., Lin A.A., Arbuzova S., Beckman L.E., De Benedictis G., Francalacci P., Kouvatsi A., Limborska S. The genetic legacy of Paleolithic Homo sapiens sapiens in extant Europeans: a Y chromosome perspective. Science. 2000;290:1155–1159. doi: 10.1126/science.290.5494.1155. [DOI] [PubMed] [Google Scholar]
- 23.Wilson J.F., Weiss D.A., Richards M., Thomas M.G., Bradman N., Goldstein D.B. Genetic evidence for different male and female roles during cultural transitions in the British Isles. Proc. Natl. Acad. Sci. USA. 2001;98:5078–5083. doi: 10.1073/pnas.071036898. [DOI] [PMC free article] [PubMed] [Google Scholar]
- 24.Hill E.W., Jobling M.A., Bradley D.G. Y-chromosome variation and Irish origins. Nature. 2000;404:351–352. doi: 10.1038/35006158. [DOI] [PubMed] [Google Scholar]
- 25.Underhill P.A., Myres N.M., Rootsi S., Metspalu M., Zhivotovsky L.A., King R.J., Lin A.A., Chow C.E., Semino O., Battaglia V. Separating the post-Glacial coancestry of European and Asian Y chromosomes within haplogroup R1a. Eur. J. Hum. Genet. 2010;18:479–484. doi: 10.1038/ejhg.2009.194. [DOI] [PMC free article] [PubMed] [Google Scholar]
- 26.Underhill P.A., Kivisild T. Use of Y chromosome and mitochondrial DNA population structure in tracing human migrations. Annu. Rev. Genet. 2007;41:539–564. doi: 10.1146/annurev.genet.41.110306.130407. [DOI] [PubMed] [Google Scholar]
- 27.Myres N.M., Rootsi S., Lin A.A., Järve M., King R.J., Kutuev I., Cabrera V.M., Khusnutdinova E.K., Pshenichnov A., Yunusbayev B. A major Y-chromosome haplogroup R1b Holocene era founder effect in Central and Western Europe. Eur. J. Hum. Genet. 2011;19:95–101. doi: 10.1038/ejhg.2010.146. [DOI] [PMC free article] [PubMed] [Google Scholar]
- 28.Cruciani F., Trombetta B., Antonelli C., Pascone R., Valesini G., Scalzi V., Vona G., Melegh B., Zagradisnik B., Assum G. Strong intra- and inter-continental differentiation revealed by Y chromosome SNPs M269, U106 and U152. Forensic Sci. Int. Genet. 2011;5:e49–e52. doi: 10.1016/j.fsigen.2010.07.006. [DOI] [PubMed] [Google Scholar]
- 29.Busby G.B., Brisighelli F., Sánchez-Diz P., Ramos-Luis E., Martinez-Cadenas C., Thomas M.G., Bradley D.G., Gusmão L., Winney B., Bodmer W. The peopling of Europe and the cautionary tale of Y chromosome lineage R-M269. Proc. Biol. Sci. 2012;279:844–892. doi: 10.1098/rspb.2011.1044. [DOI] [PMC free article] [PubMed] [Google Scholar]
- 30.Battaglia V., Fornarino S., Al-Zahery N., Olivieri A., Pala M., Myres N.M., King R.J., Rootsi S., Marjanovic D., Primorac D. Y-chromosomal evidence of the cultural diffusion of agriculture in Southeast Europe. Eur. J. Hum. Genet. 2009;17:820–830. doi: 10.1038/ejhg.2008.249. [DOI] [PMC free article] [PubMed] [Google Scholar]
- 31.Richards M., Côrte-Real H., Forster P., Macaulay V., Wilkinson-Herbots H., Demaine A., Papiha S., Hedges R., Bandelt H.-J., Sykes B. Paleolithic and neolithic lineages in the European mitochondrial gene pool. Am. J. Hum. Genet. 1996;59:185–203. [PMC free article] [PubMed] [Google Scholar]
- 32.Richards M., Macaulay V., Hickey E., Vega E., Sykes B., Guida V., Rengo C., Sellitto D., Cruciani F., Kivisild T. Tracing European founder lineages in the Near Eastern mtDNA pool. Am. J. Hum. Genet. 2000;67:1251–1276. [PMC free article] [PubMed] [Google Scholar]
- 33.Lacan M., Keyser C., Ricaut F.X., Brucato N., Tarrús J., Bosch A., Guilaine J., Crubézy E., Ludes B. Ancient DNA suggests the leading role played by men in the Neolithic dissemination. Proc. Natl. Acad. Sci. USA. 2011;108:18255–18259. doi: 10.1073/pnas.1113061108. [DOI] [PMC free article] [PubMed] [Google Scholar]
- 34.Lacan M., Keyser C., Ricaut F.X., Brucato N., Duranthon F., Guilaine J., Crubézy E., Ludes B. Ancient DNA reveals male diffusion through the Neolithic Mediterranean route. Proc. Natl. Acad. Sci. USA. 2011;108:9788–9791. doi: 10.1073/pnas.1100723108. [DOI] [PMC free article] [PubMed] [Google Scholar]
- 35.Haak W., Balanovsky O., Sanchez J.J., Koshel S., Zaporozhchenko V., Adler C.J., Der Sarkissian C.S.I., Brandt G., Schwarz C., Nicklisch N., Members of the Genographic Consortium Ancient DNA from European early neolithic farmers reveals their near eastern affinities. PLoS Biol. 2010;8:e1000536. doi: 10.1371/journal.pbio.1000536. [DOI] [PMC free article] [PubMed] [Google Scholar]
- 36.Bar-Yosef O. The Last Glacial Maximum in the Mediterranean Levant. In: Gamble C., Sofer O., editors. Vol. 2. Unwin Hyman; London: 1990. pp. 58–77. (The world at 18 000 BP). [Google Scholar]
- 37.Cavalli-Sforza L.L., Menozzi P., Piazza A. Princeton University Press; Princeton: 1994. The history and geography of human genes. [Google Scholar]
- 38.Richards M.B., Macaulay V.A., Bandelt H.-J., Sykes B.C. Phylogeography of mitochondrial DNA in western Europe. Ann. Hum. Genet. 1998;62:241–260. doi: 10.1046/j.1469-1809.1998.6230241.x. [DOI] [PubMed] [Google Scholar]
- 39.Richards M.B., Macaulay V.A., Torroni A., Bandelt H.-J. In search of geographical patterns in European mitochondrial DNA. Am. J. Hum. Genet. 2002;71:1168–1174. doi: 10.1086/342930. [DOI] [PMC free article] [PubMed] [Google Scholar]
- 40.Kuhrt A. Volume I. Routledge; London: 1995. (The Ancient Near East). [Google Scholar]
- 41.Torroni A., Rengo C., Guida V., Cruciani F., Sellitto D., Coppa A., Calderon F.L., Simionati B., Valle G., Richards M. Do the four clades of the mtDNA haplogroup L2 evolve at different rates? Am. J. Hum. Genet. 2001;69:1348–1356. doi: 10.1086/324511. [DOI] [PMC free article] [PubMed] [Google Scholar]
- 42.Andrews R.M., Kubacka I., Chinnery P.F., Lightowlers R.N., Turnbull D.M., Howell N. Reanalysis and revision of the Cambridge reference sequence for human mitochondrial DNA. Nat. Genet. 1999;23:147. doi: 10.1038/13779. [DOI] [PubMed] [Google Scholar]
- 43.van Oven M., Kayser M. Updated comprehensive phylogenetic tree of global human mitochondrial DNA variation. Hum. Mutat. 2009;30:E386–E394. doi: 10.1002/humu.20921. [DOI] [PubMed] [Google Scholar]
- 44.Behar D.M., van Oven M., Rosset S., Metspalu M., Loogväli E.-L., Silva N.M., Kivisild T., Torroni A., Villems R. A “copernican” reassessment of the human mitochondrial DNA tree from its root. Am. J. Hum. Genet. 2012;90:675–684. doi: 10.1016/j.ajhg.2012.03.002. [DOI] [PMC free article] [PubMed] [Google Scholar]
- 45.Saillard J., Forster P., Lynnerup N., Bandelt H.-J., Nørby S.S. mtDNA variation among Greenland Eskimos: the edge of the Beringian expansion. Am. J. Hum. Genet. 2000;67:718–726. doi: 10.1086/303038. [DOI] [PMC free article] [PubMed] [Google Scholar]
- 46.Soares P., Ermini L., Thomson N., Mormina M., Rito T., Röhl A., Salas A., Oppenheimer S., Macaulay V., Richards M.B. Correcting for purifying selection: an improved human mitochondrial molecular clock. Am. J. Hum. Genet. 2009;84:740–759. doi: 10.1016/j.ajhg.2009.05.001. [DOI] [PMC free article] [PubMed] [Google Scholar]
- 47.Haak W., Forster P., Bramanti B., Matsumura S., Brandt G., Tänzer M., Villems R., Renfrew C., Gronenborn D., Alt K.W., Burger J. Ancient DNA from the first European farmers in 7500-year-old Neolithic sites. Science. 2005;310:1016–1018. doi: 10.1126/science.1118725. [DOI] [PubMed] [Google Scholar]
- 48.Bramanti B., Thomas M.G., Haak W., Unterlaender M., Jores P., Tambets K., Antanaitis-Jacobs I., Haidle M.N., Jankauskas R., Kind C.-J. Genetic discontinuity between local hunter-gatherers and central Europe's first farmers. Science. 2009;326:137–140. doi: 10.1126/science.1176869. [DOI] [PubMed] [Google Scholar]
- 49.Malmström H., Gilbert M.T.P., Thomas M.G., Brandström M., Storå J., Molnar P., Andersen P.K., Bendixen C., Holmlund G., Götherström A., Willerslev E. Ancient DNA reveals lack of continuity between neolithic hunter-gatherers and contemporary Scandinavians. Curr. Biol. 2009;19:1758–1762. doi: 10.1016/j.cub.2009.09.017. [DOI] [PubMed] [Google Scholar]
- 50.Sampietro M.L., Lao O., Caramelli D., Lari M., Pou R., Martí M., Bertranpetit J., Lalueza-Fox C. Palaeogenetic evidence supports a dual model of Neolithic spreading into Europe. Proc. Biol. Sci. 2007;274:2161–2167. doi: 10.1098/rspb.2007.0465. [DOI] [PMC free article] [PubMed] [Google Scholar]
- 51.Malyarchuk B.A., Derenko M.V. Molecular instability of the mitochondrial haplogroup T sequences at nucleotide positions 16292 and 16296. Ann. Hum. Genet. 1999;63:489–497. doi: 10.1017/S0003480099007794. [DOI] [PubMed] [Google Scholar]
- 52.Olivieri A., Achilli A., Pala M., Battaglia V., Fornarino S., Al-Zahery N., Scozzari R., Cruciani F., Behar D.M., Dugoujon J.-M. The mtDNA legacy of the Levantine early Upper Palaeolithic in Africa. Science. 2006;314:1767–1770. doi: 10.1126/science.1135566. [DOI] [PubMed] [Google Scholar]
- 53.Fernandes V., Alshamali F., Alves M., Costa M.D., Pereira J.B., Silva N.M., Cherni L., Harich N., Cerny V., Soares P. The Arabian cradle: mitochondrial relicts of the first steps along the southern route out of Africa. Am. J. Hum. Genet. 2012;90:347–355. doi: 10.1016/j.ajhg.2011.12.010. [DOI] [PMC free article] [PubMed] [Google Scholar]
- 54.Otte M., Yalcınkaya I., Leotard J.-M., Kartal M., Bar-Yosef O., Kozlowski J., Lopez-Bayon I., Marshack A. The Epi-Palaeolithic of Öküzini cave (SW Anatolia) and its mobiliary art. Antiquity. 1995;69:931–944. [Google Scholar]
- 55.Baird D. Pınarbaşı; from Epipalaeolithic campsite to sedentarising village in central Anatolia. In: Ozdogan M., Başgelen N., editors. The Neolithic in Turkey: New excavations and new research. 2nd edition. Arkeoloji v Sanat Yayinlari; Istanbul: 2011. pp. 285–311. [Google Scholar]
- 56.Svoboda J., Ložek V., Vlček E. Plenum Press; New York: 1996. Hunters between east and west. [Google Scholar]
- 57.Mishmar D., Ruiz-Pesini E., Golik P., Macaulay V., Clark A.G., Hosseini S., Brandon M., Easley K., Chen E., Brown M.D. Natural selection shaped regional mtDNA variation in humans. Proc. Natl. Acad. Sci. USA. 2003;100:171–176. doi: 10.1073/pnas.0136972100. [DOI] [PMC free article] [PubMed] [Google Scholar]
Associated Data
This section collects any data citations, data availability statements, or supplementary materials included in this article.