

Abstract
In this paper, the use of magnetic nanowires for the study of cellular response to force is demonstrated. High-aspect ratio Ni rods with diameter 300 nm and lengths up to 20 μm were bound to or internalized by pulmonary artery smooth muscle cells (SMCs) cultured on arrays of flexible micropost force sensors. Forces and torques were applied to the cells by driving the nanowires with AC magnetic fields in the frequency range 0.1 – 10 Hz, and the changes in cellular contractile forces were recorded with the microposts. These local stimulations yield global force reinforcement of the cells’ traction forces, but this contractile reinforcement can be effectively suppressed upon addition of a calcium channel blocker, ruthenium red, suggesting the role of calcium channels in the mechanical response. The responsiveness of the SMCs to actuation depends on the frequency of the applied stimulation. These results show that the combination of magnetic nanoparticles and micropatterned, flexible substrates can provide new approaches to the study of cellular mechanotransduction.
1. Introduction
Nanoparticles of a variety of sizes, shapes, materials, and surface functionalizations have been explored for their utility in studying living cells. The nanoscale nature of such particles can offer unique optical properties for imaging cells and particle trafficking, chemical properties for cellular entry or drug delivery, and physical properties for a variety of other applications [1, 2]. Magnetic particles in particular have had a long history in biomedical applications, such as for the separation of specific cells or proteins from a complex mixture [3–5], as well as for providing a handle for obtaining rheological properties of cells and tissues [6–8]. Recently, such magnetic particles are being used to explore how mechanical forces might impact cellular functions. Pulling on micrometer-scale paramagnetic beads bound to cell surface integrin receptors or cadherin receptors leads to clustering and strengthening of these adhesions, and in some cases alterations in the direction of cell migration [9–11]. Using nanoscale paramagnetic beads bound to individual growth factor receptors, Ingber and colleagues recently showed that magnetization causes receptor clustering and activation of intracellular signaling [12]. We have previously explored the fabrication and chemical functionalization of high-aspect ratio, high magnetic moment magnetic nanoparticles for biological applications [13–16], and have demonstrated the efficacy of these “magnetic nanowires” for separating and positioning cells in suspension under the control of external magnetic fields [17–19]. Here we demonstrate that such nanowires can be used to examine how magnetically applied forces impact cell contractility.
Mechanical forces have long been appreciated to regulate the physiology of mammalian cells [20]. Cells respond to forces, whether applied exogenously or cell generated, and such forces regulate cell shape, migration, apoptosis, and gene expression [21–25]. Interestingly, it has been shown that applied forces can impact cell-generated forces, although the effects appear to be different depending on the nature of the stimulus. In some cases, applying large stretches to the whole cell depolymerizes the cellular cytoskeleton causing a transient decrease in cell tractions [26, 27]. We have also observed this effect when applying force to a single adhesion [28]. It remains unknown whether the cellular response would be different if the force is applied not via an adhesion.
In this paper, we demonstrate the use of magnetic nanowires for the study of cellular response to force. Forces and torques were applied to nanowires bound to bovine pulmonary artery smooth muscle cells (SMCs), and the cellular contractile response was measured with arrays of flexible micropost force sensors [29, 30]. These arrays allow measurements with sub-cellular resolution of the local force fields generated by a cell, and the changes in those forces in response to the magnetic stimulation. We measured the traction forces of SMCs that were actuated by both externally and internally bound nanowires in an applied magnetic field. We observed a global force reinforcement of the cells’ traction forces on the timescale of minutes upon applying a localized torque via the nanowires, but find that this contractile reinforcement can be effectively suppressed upon addition of the calcium channel blocker ruthenium red, suggesting the role of calcium channels in the mechanical response. We also find that the responsiveness of SMCs to an actuation depends on the frequency of the applied stimulation. Taken together, our results show that the combination of magnetic nanoparticles and micropatterned, flexible substrates can provide new approaches to the study of cellular mechanotransduction.
2. Materials and Methods
2.1. Magnetic Nanowires
The magnetic Ni nanowires were formed by electrochemical deposition in the pore of 50-μm-thick alumina filter templates with nominal pore diameter of 350 nm. Procedures for fabricating these nanowires and removing them from the templates into liquid suspension have been described previously [13]. They are readily magnetized along their long axis, and their remanent magnetization is 70% of the saturation magnetization of bulk Ni. The resulting large magnetic dipole moment (μ= 6 × 10⁻¹³ A•m2 for the 20 μm long wires used here) enables the application of strong forces and torques to cells and other soft matter systems via external magnetic fields and field gradients [18, 31–34]. Further discussion of the properties of these nanowires relevant to biological applications and comparisons to other biomagnetic nanoparticles may be found in Refs. [14, 16, 19].
2.2. Micropost arrays
The micropost array devices were made of polydimethylsiloxane (PDMS) via replica molding from PDMS negative molds [29] produced from a Si master made by photolithography and deep reactive ion etching [35]. The micropost devices used in this study consisted of 1.8 μm diameter posts, 6.4 μm in height, arranged in close-packed hexagonal arrays, with lattice constant 4 μm. For small deflections, these microposts have an effective spring constant k = 15.7 nN/μm [35].
To promote cell adhesion, the tops of the micropost arrays were chemically functionalized with fibronectin (50 μg/ml) by microcontact printing [29]. The arrays were fluorescently stained with DiI (1,10-dileyl-3,3,30,30- tetramethylindocarbocyanine methanesulfonate, Invitrogen, Carlsbad, CA) for imaging and the remaining surfaces of the arrays other than the post tops were blocked from protein adsorption or cell adhesion with 0.2% Pluronics F127 NF.
2.3. Cell Culture
Bovine pulmonary artery smooth muscle cells (SMCs) (gift from Donald Ingber) were cultured in low glucose DMEM supplemented with 10% bovine serum, 1 unit/mL penicillin, and 100 μg/mL at 37°C and in 10% CO2. Cells were seeded onto the post arrays and cultured for at least four hours prior to the experiments to allow the cells to adhere and spread. At the time of experiments, the arrays were transferred to CO2 independent growth media (Gibco) to avoid the need for external CO2 regulation during the duration of the magnetic actuation measurements.
For experiments with externally bound Ni nanowires, nanowires were introduced at concentration 3x10⁶/mL, drawn down onto the cells on the post arrays via an external magnet, and allowed to adhere to the cells for 30 minutes prior to magnetic stimulation. For experiments with internalized nanowires, the nanowires were introduced into the cell cultures and incubated for 24h. The cells were then detached from the culture dishes by exposure to Tripsin-EDTA, re-suspended in media, subjected to a single-pass magnetic separation to remove cells without nanowires [18, 19], and plated onto the micropost arrays. We have shown in previous studies that these approaches yield externally bound or internalized nanowires, as desired [18].
2.4 Magnetic Tweezers
As it was important to be able to observe each cell prior to magnetic actuation, localized magnetic fields were applied to individual cells on the micropost arrays using a dual “magnetic tweezers” consisting of two solenoids with steel cores with finely sharpened tips of effective diameter ~20 μm. The solenoids were mounted on separate 3-axis micro-manipulators, and the pole tips projected into the culture media at an angle of 35° relative to the plane of the micropost array. They were positioned with the tips separated by 240 μm at a height of 100 μm above the surface of the arrays. When currents were run through the solenoids so as to produce a North pole at one tip and a South pole at the other, the tweezers produced an in-plane magnetic field that varied by less than 4% across a typical spread cell diameter (50 μm). This field fell to less than 5% of its maximum value at a distance of 500 μm from the center of the tweezers, and thus by sequentially observing cells separated by at least this distance, multiple cells per array could be recorded while ensuring that each cell had not been exposed to the magnetic field prior to observation. For the experiments described herein we used AC magnetic fields B = B0 cos(2πft), with B0 = 0.23 T and f in the range 0.1 to 10 Hz. This field produced a time-dependent torque τ = μ × B on the nanowires with maximum possible amplitude τMax = μB0 = 0.14 pN m.
2.5. Measurement Protocols and Quantification of Traction Forces
The cellular traction forces were measured by recording fluorescent images of the microposts at 15 sec. intervals. We recorded each cell’s intrinsic behavior for 5 minutes and then recorded its response over a 15 minute interval while the AC magnetic field was applied. The microposts’ deflections caused by the traction forces were determined from the images using tracking code written in IgorPro (Wavemetrics, Inc.) [28, 36]. Intensity profiles of the posts’ images were modeled as two-dimensional Gaussians. The undeflected positions of posts under the cells were determined by interpolation of the positions of posts not in contact with a cell on the periphery of the field of view. The deflections of each post under the cells were converted to a force map using the post spring constant κ = 15.7 nN/μm. To obtain quantitative estimates of the torques applied via the nanowires, the initial orientations of the nanowires bound to the cells was determined by white light imaging prior to the application of the field, and for lower frequency measurements (f ≤ 1 Hz) the range of nanowire motion in response to the field was measured immediately after the experimental time course via white light imaging at a 10 Hz frame rate.
3. Results
To study the effects of stimulation with externally-bound nanowires, SMCs were allowed to spread and attach to the top of the microposts, and then nanowires of length 20 μm were adhered to the top of the cells as shown in Fig. 1(A). The traction force exerted on each post under a cell was determined by observing the deflection of the posts caused by the cell. In general, we observed a larger contractile force in the cellular periphery than in the cell center, as shown in Fig. 1(B). We recorded each cell’s intrinsic behavior for 5 minutes and then stimulated the cells with the application of an AC magnetic field B at a frequency of 1 Hz with amplitude 0.23 T for 15 minutes. A convenient scalar measure of a cell’s contractility is the strain energy imparted to the microposts by the cell’s traction forces [28, 36]. Here, we recorded the average strain energy per post, , where N is the total number of posts in contact with the cell, k is the spring constant of the posts, and δi is the magnitude of the deflection of each post.
Figure 1.

(A) Phase contrast image of a smooth muscle cell (SMC) cultured on a PDMS micro-post array, prior to magnetic actuation. Magnetic nanowires with an average length of 20 μm are adhered on top of the cell. Scale bar = 8 μm. (B) Fluoresence image corresponding to (A), with a vector map of the forces exerted by the cell on each post superimposed. (C) Average strain energy per post for several cells over the time course of the experiment. Some cells show a sudden increase in energy upon magnetic actuation (solid symbols), while other cells show no responsiveness to this actuation (open squares, circles, and triangles). The apparent energy of the posts not in contact with the cell is nearly zero (open stars in upper panel). (D) Vector force map of the cell shown in Panels (A) and (B) after 15 min. of magnetic stimulation, showing a increase in cellular contractility.
To eliminate the variability in the initial contractile state of the cells as well as to characterize quantitatively the cells’ response to the actuation, we least squares fitted the baseline energy before the stimulation and extrapolated the projected final energy at the final experimental time. Subtraction of the measured final energy from the projected final energy provided a means of determining the cells’ response to the actuation. We defined a cell as reactive to the stimulation when this energy difference is larger than the average of the error bars in the energy vs. time trace for that cell, as in Fig. 1(C).
The magnetically stimulated cells fell into two groups. 9 of the 21 cells we observed showed a steady increase in E for approximately 2 minutes after the magnetic field was applied (Fig. 1(C), solid symbols), after which E leveled off. The 12 remaining cells showed no response to the actuation, and E remained unchanged upon the applied field, (Fig. 1(C), open symbols). The contractile forces exerted by the responsive cells showed a general increase at the end of the 15 minute magnetic stimulation compared to those before stimulation, as shown in Fig. 1(D). We observed no measurable change in E upon actuation for two types of unstimulated controls: cells without nanowires subjected to the same AC magnetic field and cells with adherent nanowires that were not exposed to the field. As has been previously reported [28], the baseline cellular contractility before the magnetic stimulation ranged considerably (average energy per post from 0.5 fJ to 5 fJ) over the group of observed cells, and that baseline variability did not appear to affect the response to stimulation. We also observed no correlation between the degree of response or lack of response and the strength of stimulation inferred from the nanowires’ orientation and motion.
To investigate the magnitude and spatial distribution of the changes in cells’ contractile forces induced by the magnetic actuation, we measured the change in energy of individual cell posts δEi at different observing times. To characterize the baseline fluctuations in contractile forces due to the cells’ intrinsic dynamics, we measured the energy difference as a function of time before turning on the magnetic field, , where Ebase,a and Ebase,b are the average energy of each post over one minute’s duration between 2.5 minutes to 1.5 minutes and 3.5 minutes to 2.5 minutes before applying the field, respectively; t=0 indicates the application of magnetic field. Cells were observed to be dynamic in the periphery, as shown in Fig. 2(A), and showed both small increases and decreases in the contractile forces applied to individual posts. To capture the short-time response to the external magnetic field, the energy difference of each post was measured, , where Ebase and Eon are the average energy of each post over a one minute duration immediately before and after the application of the magnetic field, respectively. We observed large increases in post energies (Fig. 2(B)) compared to those changes occurring during the natural cellular motion (Fig. 2(A)). Interestingly, posts showing an increase in energy upon stimulation were not necessarily localized near the nanowires, as shown in Fig. 2(B).
Figure 2.
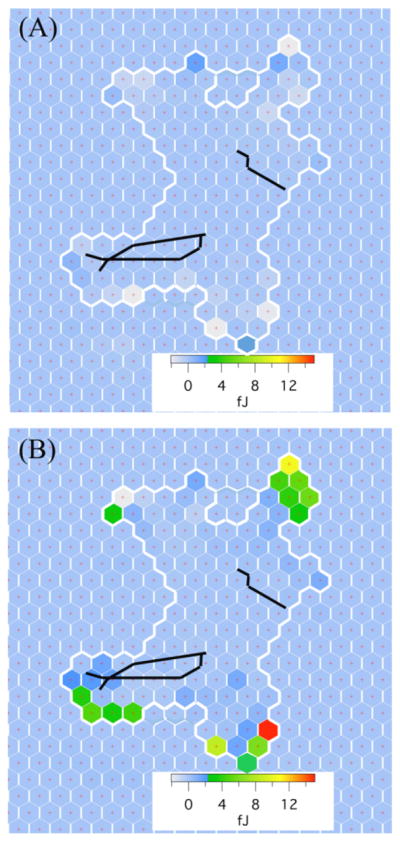
Spatial maps of the change in strain energy δE for each post under a cell. Each hexagon represents a post, and the boundary of the cell is shown by the thick white line. (A) The energy shows little change prior to stimulation. (B) By contrast, some posts show a sudden energy increase 1 min. after application of magnetic stimulation; these posts are not localized near the nanowires.
To characterize this mechanical response, we investigated correlations between the energy change of individual posts δEi upon actuation and their baseline energy, Ebase before the stimulation. δEi and Ebase were positively correlated, as shown by the red symbols of Fig. 3. This indicated that posts which were pulled harder by the cell before an external stimulation tended to respond more to the stimulation. Again, the contractile reinforced behavior was observed both for posts that were near the nanowires (solid red symbols) as well as for posts which had no nanowires on the top (open red symbols). The energy fluctuations due to intrinsic cellular dynamics δEi,base before the external stimulation were small (Fig. 3, black symbols) compared to that of responsive posts upon stimulation.
Figure 3.

The increase in strain energy δEi at individual posts upon magnetic stimulation positively correlates to the baseline strain energy before the actuation (red symbols); this applies to both posts near the nanowires (solid symbols) and posts not near the nanowires (open symbols). The strain energy fluctuations δEi,base before the actuation are small (black symbols).
It has been reported that mammalian cells show two distinct mechanical responses corresponding to stimulation of the cortical and intracellular networks [8]. To investigate the non-local response of SMCs to an intracellular stimulation, we applied an actuation to SMCs which had magnetic nanowires internalized. We found SMCs prepared this way also show two types of response: 9 of 21 actuated cells showed increases in traction forces and hence in their average strain energy (Fig. 4(A), solid symbols). However, the contractile response occurred over a longer time duration compared to that of cells actuated in the cortex by adherent nanowires (Fig. 4(B), open symbols). We found 12 of the 21 cells showed no responsiveness to the internal actuation (Fig. 4(A), open symbols). To capture the spatial distribution within the cells for this longer time scale response, we measured . An example of these longer time changes in strain energies for a particular cell is shown in Fig. 4C. Similar to the external actuation case, posts which showed a substantial energy increase were not localized to the position of nanowires, and again the response occurred at posts which contained larger baseline energy before the actuation, as shown in Fig. 4(D). Also, again no correlation was observed between the degree of response or lack of response of the cells and the magnitude of the applied torques. To provide a quantitative measure of the duration of the response subsequent to stimulation, we computed the change in average energy per cell . For the data shown in Fig. 4(B) the averages of this quantity over the groups of cells with internalized and externally bound wires are 2.0(5) fJ and 0.2(3) fJ, respectively (p < 0.001).
Figure 4.

(A) Some cells show the average energy per post increase in a gradual manner over the time course of experiment upon actuation with internalized magnetic nanowires (solid symbols), and other cells show no responsiveness to this actuation (open squares, circles, and triangles). The apparent energy of the posts having no cells on the top is nearly zero (open stars in upper panel). (B) Comparison of cellular response to externally bound nanowire stimulation (open symbols) and internally bound nanowire stimulation (solid symbols) by scaling the baseline average energy to zero. For the external stimulation, contractile energy increases in the first 2 minutes then reaches a static state, while the energy of internally stimulated cells gradually increases during the whole experimental time course. (C) The change in energy over the 15 min. time course of the internal stimulation is not localized near the magnetic nanowire. As in Fig. 2, each hexagon represents a post, and the cell boundary is a thick, white line. (D) As for external stimulation, the increase in strain energy at individual posts upon internal magnetic stimulation correlates to the baseline strain energy before the actuation (red symbols). The energy fluctuations δEi,base before the actuation are small (black symbols).
Contraction in muscle cells has been shown to be triggered by an increase in cytosolic Ca2+ levels [37]. To determine whether the reinforced contraction of SMCs upon stimulation was affected by influx of intracellular Ca2+ cations, we treated SMCs with a calcium channel blocker, ruthenium red (RuR) [38]. RuR interferes with the ryanodine Ca2+ channel receptors responsible for signaling-dependent release of stored Ca2+ into the cytosol [39–42]. We treated SMCs with 10 μM of RuR for 30 minutes before the experiments. While, as described above, ~40% of cells with either externally bound or internalized nanowires exhibited a response to actuation, RuR treated cells actuated by externally bound nanowires failed to exhibit a response to the applied stimulation (Fig. 5A). In contrast, the RuR-induced suppression of response was not complete for cells with internalized nanowires. 10% of these cells exhibited increases in strain energy, although with reduced amplitude compared to untreated cells (Fig. 5A). These response rates are summarized in Fig. 5B.
Figure 5.

SMC response to magnetic stimulation after treatment with the calcium inhibiter ruthenium red (RuR). (A) Cells treated with RuR did not respond to the externally bound nanowire actuation (e.g. red open symbols). The response of an untreated cell to external stimulation is shown (gray open symbols) for comparison. In contrast, some RuR-treated cells still show modest response to stimulation by internalized nanowires (red solid symbols), but this response is smaller than for untreated cells (grey solid symbols). (B) Summary of response rates for internal and external stimulation, with and without RuR treatment.
Finally, to characterize the dependence of the response to the stimulation frequency, we varied the frequencies of the applied magnetic field, f, from 0.1 to 10 Hz. We found cells were activated the most at f = 0.5 Hz: 60% of the cells showed contractile energy reinforcement during the stimulation. By contrast, only 20% and 14% of the cells were responsive to the actuation with the applied frequencies at 0.1 Hz and 10 Hz, respectively, as shown in Fig. 6.
Figure 6.

The cellular contractile responsiveness depends on the frequency of the internally applied stimulation: a greater percentage of the cells show enhanced reinforcement at frequencies of 0.5 Hz and 1 Hz.
4. Discussion
Our results indicate two similar, but distinct, mechanical responses, corresponding to nanowires externally adherent to cells and those embedded in the cells. Cells showed contractile force reinforcement in both conditions upon an applied stimulation. We also observed that posts showing significant increase in strain energy are not necessarily localized near the nanowires; this phenomenon suggests that the SMCs’ cellular reinforcement upon a local stimulation is a global, cell-wide response. For both external and internalized nanowire stimulation, the critical parameter determining the responsive parts in a cell upon actuation is the local baseline contractility before the applied field: the energy increase of individual posts upon stimulation positively correlates to the baseline energy of those posts. One significant difference of the cellular response between the two kinds of stimulations is the time duration over which the cells respond to the actuation. For external nanowire actuation, the cells’ contractility increased dramatically within 2 minutes following the magnetic field application and then it increased in a much slower manner or leveled off, whereas cells responded to the internalized nanowire actuation with a steady increase over our whole experimental time course. Nanowires adherent to the top of the cultured SMCs are more likely to couple to the cortical actin network, while nanowires embedded in the cells should interact with intracellular cytoskeleton. We hypothesize that this phenomenon is caused by the stimulation of different cytoskeletal networks corresponding to the cortical and deep intracellular space. Our findings are consistent with a previous report wherein the viscoelastic cellular response shows a distinction between the two spatially separate compartments [8]. While, as we have noted, the magnitude of the applied torque does not appear to be a critical parameter in determining whether and how much a cell responds to a stimulation of each type, it is possible that there are different degrees of mechanical coupling between the nanowires and the cells for internalized and externally-bound wires, and that this could lead to the qualitative difference in the two types of responses observed.
We demonstrated that the reinforced contractility of SMCs upon actuation can be effectively suppressed through RuR treatment. RuR completely blocks cells’ response to the externally bound nanowires actuation, and diminishes but does not completely eliminate the response to internalized nanowires. These differences would suggest the intriguing possibility that cortical stimulation via adhesion receptors drive contractility changes solely via these calcium channels, whereas internal stimulation might circumvent this regulation via an alternative pathway. For example, it is possible that direct deformation of the internal cytoskeleton can mechanically stretch the endoplasmic reticulum, the large membrane-bound compartment that acts as a calcium depot. Such deformations could induce calcium leak currents, whether by stretch-activated channels or direct membrane disruption. Interestingly, cells treated with RuR show no significant contractile relaxation on our experimental timescale. These data suggest that intracellular calcium signaling via these channels is not likely a major regulator of steady state contractility of the cell, but rather the key control point for rapid changes in cellular mechanics.
Our data show the contractile responsiveness of cells to the actuation also depends on the actuating frequency. A greater percentage of the cells show enhanced reinforcement at frequencies range from 0.5 Hz to 1 Hz, while fewer cells respond to an applied stimulation at the higher frequency, 10 Hz, and the lower frequency, 0.1 Hz. Although the mechanism for such frequency dependence is not clear, it is interesting that the responsiveness is tuned to the heart rate frequencies experienced by these cells in vivo.
5. Summary
In summary, this work shows that magnetic nanowires used in conjunction with micropatterned substrates that can resolve cellular traction forces on the sub-cellular scale hold promise for elucidating mechanisms of non-local cellular force response and dynamics. For the SMCs studied here, further work on direct imaging of the coupling between nanowires and cytoskeletal networks as well as probing how stimulation changes the morphology of the cytoskeleton of the SMCs are important to clarify the nature of the nanowire-based stimulation. More broadly, this work may point the way to a variety of related approaches wherein distributed cellular force sensing devices, whether the microposts described here or other techniques, such as traction force microscopy [43–45], could be combined with nanoparticle-based stimulation techniques ranging from magnetic forces applied via bound particles in inhomogenous fields to actuation via laser tweezers using non-magnetic particles to explore a range of phenomena in mechanobiology and cellular mechanotransduction.
Acknowledgments
This work was supported by NIH grant R01-HL090747.
Footnotes
PACS: 87.85.Qr, 87.85.Rs, 87.17.Rt, 62.23.Hj
References
- 1.Weihs D, Mason TG, Teitell MA. Biophys J. 2006;91:4296–4305. doi: 10.1529/biophysj.106.081109. [DOI] [PMC free article] [PubMed] [Google Scholar]
- 2.Cicuta P, Donald AM. Soft Matter. 2007;3:1449–1455. doi: 10.1039/b706004c. [DOI] [PubMed] [Google Scholar]
- 3.Kemshead JT, Ugelstad J. Mol Cell Biochem. 1985;67:11–18. doi: 10.1007/BF00220980. [DOI] [PubMed] [Google Scholar]
- 4.Olsvik O, Popovic T, Skjerve E, Cudjoe KS, Hornes E, Ugelstad J, Uhlen M. Clin Microbiol Rev. 1994;7:43–54. doi: 10.1128/cmr.7.1.43. [DOI] [PMC free article] [PubMed] [Google Scholar]
- 5.Gu HW, Xu KM, Xu CJ, Xu B. Chem Commun. 2006:941–949. doi: 10.1039/b514130c. [DOI] [PubMed] [Google Scholar]
- 6.Wang N, Butler JP, Ingber DE. Science. 1993;260:1124–1127. doi: 10.1126/science.7684161. [DOI] [PubMed] [Google Scholar]
- 7.Fabry B, Maksym GN, Butler JP, Glogauer M, Navajas D, Fredberg JJ. Phys Rev Lett. 2001;87:148102. doi: 10.1103/PhysRevLett.87.148102. [DOI] [PubMed] [Google Scholar]
- 8.Hoffman BD, Massiera G, Van Citters KM, Crocker JC. Proc Natl Acad Sci U S A. 2006;103:10259–10264. doi: 10.1073/pnas.0510348103. [DOI] [PMC free article] [PubMed] [Google Scholar]
- 9.Matthews BD, Overby DR, Alenghat FJ, Karavitis J, Numaguchi Y, Allen PG, Ingber DE. Biochem Biophys Res Commun. 2004;313:758–764. doi: 10.1016/j.bbrc.2003.12.005. [DOI] [PubMed] [Google Scholar]
- 10.le Duc Q, Shi QM, Blonk I, Sonnenberg A, Wang N, Leckband D, de Rooij J. J Cell Biol. 2010;189:1107–1115. doi: 10.1083/jcb.201001149. [DOI] [PMC free article] [PubMed] [Google Scholar]
- 11.Chan MWC, El Sayegh TY, Arora PD, Laschinger CA, Overall CM, Morrison C, McCulloch CAG. Journal of Biological Chemistry. 2004;279:41047–41057. doi: 10.1074/jbc.M406631200. [DOI] [PubMed] [Google Scholar]
- 12.Mannix RJ, Kumar S, Cassiola F, Montoya-Zavala M, Feinstein E, Prentiss M, Ingber DE. Nature Nanotech. 2008;3:36–40. doi: 10.1038/nnano.2007.418. [DOI] [PubMed] [Google Scholar]
- 13.Tanase M, Bauer LA, Hultgren A, Silevitch DM, Sun L, Reich DH, Searson PC, Meyer GJ. Nano Lett. 2001;1:155–158. [Google Scholar]
- 14.Bauer LA, Reich DH, Meyer GJ. Langmuir. 2003;19:7043–7048. [Google Scholar]
- 15.Birenbaum NS, Lai BT, Chen CS, Reich DH, Meyer GJ. Langmuir. 2003;19:9580–9582. [Google Scholar]
- 16.Reich DH, Tanase M, Hultgren A, Bauer LA, Chen CS, Meyer GJ. J Appl Phys. 2003;93:7275–7280. [Google Scholar]
- 17.Hultgren A, Tanase M, Chen CS, Meyer GJ, Reich DH. J Appl Phys. 2003;93:7554–7556. [Google Scholar]
- 18.Hultgren A, Tanase M, Felton EJ, Bhadriraju K, Salem AK, Chen CS, Reich DH. Biotechnol Prog. 2005;21:509–515. doi: 10.1021/bp049734w. [DOI] [PubMed] [Google Scholar]
- 19.Tanase M, Felton EJ, Gray DS, Hultgren A, Chen CS, Reich DH. Lab Chip. 2005;5:598–605. doi: 10.1039/b500243e. [DOI] [PubMed] [Google Scholar]
- 20.Discher D, Dong C, Fredberg JJ, Guilak F, Ingber D, Janmey P, Kamm RD, Schmid-Schonbein GW, Weinbaum S. Ann Biomed Eng. 2009;37:847–859. doi: 10.1007/s10439-009-9661-x. [DOI] [PMC free article] [PubMed] [Google Scholar]
- 21.Chen CS. J Cell Sci. 2008;121:3285–3292. doi: 10.1242/jcs.023507. [DOI] [PubMed] [Google Scholar]
- 22.Davies PF, et al. Annu Rev Physiol. 1997;59:527–549. doi: 10.1146/annurev.physiol.59.1.527. [DOI] [PubMed] [Google Scholar]
- 23.Sawada Y, Sheetz MP. J Cell Biol. 2002;156:609–615. doi: 10.1083/jcb.200110068. [DOI] [PMC free article] [PubMed] [Google Scholar]
- 24.Geiger B, Bershadsky A, Pankov R, Yamada KM. Nat Rev Mol Cell Biol. 2001;2:793–805. doi: 10.1038/35099066. [DOI] [PubMed] [Google Scholar]
- 25.Vogel V, Sheetz M. Nat Rev Mol Cell Biol. 2006;7:265–275. doi: 10.1038/nrm1890. [DOI] [PubMed] [Google Scholar]
- 26.Krishnan R, et al. PLo SO ne. 2009;4:e5486. doi: 10.1371/journal.pone.0005486. [DOI] [PMC free article] [PubMed] [Google Scholar]
- 27.Trepat X, Deng LH, An SS, Navajas D, Tschumperlin DJ, Gerthoffer WT, Butler JP, Fredberg JJ. Nature. 2007;447:592–595. doi: 10.1038/nature05824. [DOI] [PMC free article] [PubMed] [Google Scholar]
- 28.Sniadecki NJ, Anguelouch A, Yang MT, Lamb CM, Liu Z, Kirschner SB, Liu Y, Reich DH, Chen CS. Proc Nat Acad Sci. 2007;104:14553–14558. doi: 10.1073/pnas.0611613104. [DOI] [PMC free article] [PubMed] [Google Scholar]
- 29.Tan JL, Tien J, Pirone DM, Gray DS, Bhadriraju K, Chen CS. Proc Nat Acad Sci. 2003;100:1484–1489. doi: 10.1073/pnas.0235407100. [DOI] [PMC free article] [PubMed] [Google Scholar]
- 30.du Roure O, Saez A, Buguin A, Austin RH, Chavrier P, Siberzan P, Ladoux B. Proc Nat Acad Sci. 2005;102:2390–2395. doi: 10.1073/pnas.0408482102. [DOI] [PMC free article] [PubMed] [Google Scholar]
- 31.Lapointe C, Hultgren A, Silevitch DM, Felton EJ, Reich DH, Leheny RL. Science. 2004;303:652–655. doi: 10.1126/science.1092608. [DOI] [PubMed] [Google Scholar]
- 32.Lee MH, Lapointe CP, Reich DH, Stebe KJ, Leheny RL. Langmuir. 2009;25:7976–7982. doi: 10.1021/la900408y. [DOI] [PubMed] [Google Scholar]
- 33.Lee MH, Lapointe CP, Reich DH, Stebe KJ, Leheny RL. Langmuir. 2010;26:2650–2658. doi: 10.1021/la902881f. [DOI] [PubMed] [Google Scholar]
- 34.Cappallo N, Lapointe C, Reich DH, Leheny RL. Phys Rev E. 2007;76:031505. doi: 10.1103/PhysRevE.76.031505. [DOI] [PubMed] [Google Scholar]
- 35.Fu JP, Wang YK, Yang MT, Desai RA, Yu XA, Liu ZJ, Chen CS. Nat Methods. 2010;7:733–U795. doi: 10.1038/nmeth.1487. [DOI] [PMC free article] [PubMed] [Google Scholar]
- 36.Sniadecki NJ, Lamb CM, Liu Y, Chen CS, Reich DH. Rev Sci Instrum. 2008;79:044302. doi: 10.1063/1.2906228. [DOI] [PMC free article] [PubMed] [Google Scholar]
- 37.Mochizuki T, et al. J Biol Chem. 2009;284:21257–21264. doi: 10.1074/jbc.M109.020206. [DOI] [PMC free article] [PubMed] [Google Scholar]
- 38.Chen SRW, Maclennan DH. J Biol Chem. 1994;269:22698–22704. [PubMed] [Google Scholar]
- 39.Smith JS, Imagawa T, Ma JJ, Fill M, Campbell KP, Coronado R. J Gen Physiol. 1988;92:1–26. doi: 10.1085/jgp.92.1.1. [DOI] [PMC free article] [PubMed] [Google Scholar]
- 40.Webb RC. Adv Physiol Educ. 2003;27:201–206. doi: 10.1152/advan.00025.2003. [DOI] [PubMed] [Google Scholar]
- 41.Ma JJ. J Gen Physiol. 1993;102:1031–1056. doi: 10.1085/jgp.102.6.1031. [DOI] [PMC free article] [PubMed] [Google Scholar]
- 42.Munevar S, Wang YL, Dembo M. J Cell Sci. 2004;117:85–92. doi: 10.1242/jcs.00795. [DOI] [PubMed] [Google Scholar]
- 43.Munevar S, Wang YL, Dembo M. Biophys J. 2001;80:1744–1757. doi: 10.1016/s0006-3495(01)76145-0. [DOI] [PMC free article] [PubMed] [Google Scholar]
- 44.Beningo KA, Wang YL. Trends Cell Biol. 2002;12:79–84. doi: 10.1016/s0962-8924(01)02205-x. [DOI] [PubMed] [Google Scholar]
- 45.Trepat X, Wasserman MR, Angelini TE, Millet E, Weitz DA, Butler JP, Fredberg JJ. Nat Phys. 2009;5:426–430. [Google Scholar]