
Fig. 3.
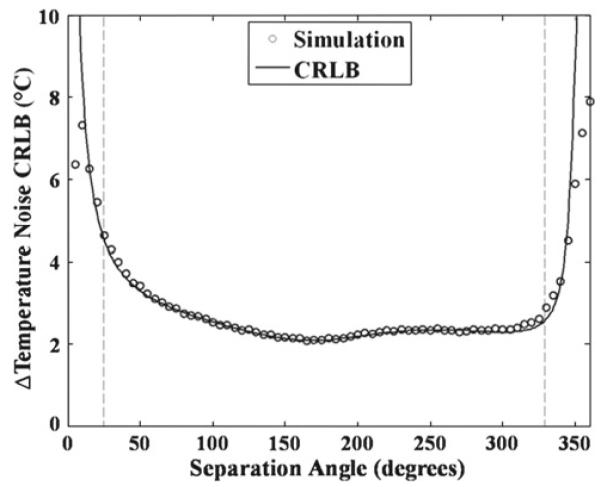
Simulation temperature noise values from NLM-Temp plotted along with the CRLB temperature noise calculations, both using the same input values. These are shown from separation angle to 1° − 360° and a starting angle of 180°. The regions between the dashed lines and the edges are regions of estimation bias where the mean of the simulation deviated from the true value (by >1%)