

Abstract
Slow wave oscillations in the brain are essential for coordinated network activity but have not been shown to self-organize in vitro. Here, the development of dissociated hippocampal neurons into an active network with oscillations on multi-electrode arrays was evaluated in the absence and presence of chronic external stimulation. Significant changes in signal power were observed in the range of 1-400 Hz with an increase in amplitude during bursts. Stimulation increased oscillatory activity primarily in the theta (4-11 Hz) and slow gamma (30-55 Hz) bands. Spikes were most prominently phase-locked to the slow gamma waves. Notably, the dissociated network self-organized to exhibit sustained delta, theta, beta and gamma oscillations without input from cortex, thalamus or organized pyramidal cell layers.
1. Introduction
The hippocampus has long been considered the center of memory storage and recall. It contains a recurrent neural network in the CA3 region that has been shown by experimentation and modeling studies to store episodic memory - consecutive memory states or “items” that together comprise a complete memory (Rolls 2010). The healthy mammalian hippocampal network develops from its embryonic state to maturity with intermittent inputs from the cortex, brainstem, thalamus and other areas. Dynamic memory occurs as these inputs modify synaptic connections through long term potentiation, depression (LTP and LTD) (Rolls 2010) and spike-time dependent plasticity (Colgin and Moser 2010), both Hebbian and non-Hebbian mechanisms.
Although episodic memory formation cannot be directly observed, there are methods that gauge the time varying signatures of electrical activity in the brain including electro-encephalograms (EEG) that offer an estimate of the global rhythms (in the 1-140 Hz range) from post-synaptic potentials over the entire brain or a large portion thereof (Brown et al 2010). Also, micro-electrode arrays (MEA) can simultaneously probe local field potentials (LFP) and single units from multiple locations in the brain at once. Moreover, the LFP is defined over a similar frequency band to the EEG allowing precise associations to be drawn between spike times and the phase of particular EEG bands. In this context, although MEAs have been used extensively to record from slice preparations as early as the 1980’s (Jobling et al 1981, Wheeler and Novak 1986), early studies of dissociated neurons on MEAs (Gross 1979, Pine 1980, Thomas et al 1972) have focused attention on action potentials or spikes, largely ignoring physiologic frequencies in the range of 1-140 Hz and their association to spike-timing.
Recent studies of the hippocampus in the intact rat brain have revealed that memory storage and retrieval are closely associated with oscillations in the hippocampal LFP (Colgin and Moser 2010). These oscillations tend to appear in four significant forms: delta or sharp waves (1-4 Hz), theta (4-11 Hz), beta (11-30 Hz) and gamma (30-140 Hz). Determining the origins of these oscillations is an important step toward understanding the brain’s capacity for signal processing, routing of information, attention and control. Studies of hippocampal slices in isolation from the brain reveal an emergence of theta oscillations through both excitatory and inhibitory localized feedback loops within the CA1 region (Goutagny et al 2009). Cholinergic activation as well as GABAA–mediated inhibitory post-synaptic potentials (IPSP) have been associated with oscillations of the local field potential in the gamma range (Fisahn et al 1998). In the hippocampus, slow gamma (20-60 Hz) has been observed to originate in the CA3 region, while fast gamma (60-140 Hz) comes from the dentate gyrus (Colgin et al 2009a, Fisahn et al 1998). Here we inquired whether these low frequency oscillations could self-organize in a network of isolated hippocampal neurons and whether chronic stimulation affects the activity.
Cultured neural networks are grown in vitro after the individual neurons have been extracted from their natural environment in the fetal brain. They are predominantly pyramidal neurons with less numerous inhibitory neurons and astroglia (Banker and Cowen 1977, Brewer et al 1993). They develop synaptic connections amongst themselves followed by the appearance of spontaneous action potentials. However, the isolation of these networks deprives them of the external stimulation they would receive from other brain regions such as the entorhinal cortex. Indeed, in the ocular cortex of rats in vivo, synaptic development is impeded by sensory deprivation, which indicates that external inputs are needed for full network development (Maffei et al 2006). In contrast, studies of hippocampal networks in vitro show training effects or synaptic modification in neural networks that have been probe-stimulated for 40 minutes prior to recording (Eytan et al 2003, Stegenga et al 2009). Also, gamma oscillations and synchronous spiking have been observed in hippocampal slices immediately following brief (150-250 ms) tetanic stimulation (Whittington et al 2001, Whittington et al 1997). In addition, long term (chronic) stimulation over a period of days resulted in higher synapse density (Brewer et al 2009) together with increased spontaneous spike rates and evoked responses observed during development of cultured hippocampal networks (Ide et al 2010).
To our knowledge, no previous study has detected theta or slow gamma waves in cultured hippocampal neuronal networks, much less the correlation of action potential events to these waves (spike phase synchrony) in culture. Here, we find low frequency oscillations develop spontaneously in these networks along with phase-locked spiking, and that chronic stimulation induces a sustained increase in oscillatory activity observed primarily in the delta (1-4Hz), theta (4-11Hz) and slow gamma (30-55 Hz) bands.
2. Methods
2.1. Neuron culture and stimulation
Networks were formed from cultures of embryonic day 18 Sprague-Dawley rat hippocampal neurons (E18HIPP) at a density of 50,000 cells per cm2 in the serum-free NbActiv4 medium (Brewer et al 2008) on Multichannel System micro-electrode arrays (MEA60 with 30μm diameter electrodes spaced at 200 μm; Reutlingen, Germany). Cultures were separated into three groups (5 arrays per group). Two experimental groups received daily paired-pulse stimulation lasting one hour and three hours respectively (Brewer et al 2009, Ide et al 2010), while the control group received no external stimulation. Chronic stimulation was applied during culture development over a period of 12 days starting on day 8 in vitro. The stimulation consisted of 5 pairs of pulses (50 ms inter-pulse interval, biphasic, 100 μs/phase duration positive first with a wait of 5 s between pairs) performed on each array electrode chosen in a pseudorandom sequence and repeated 5 times. The mode and level of this paradigm are consistent with reports in the literature (e.g. Eytan and Marom 2006). The paired pulses with a delay of 50 ms were used to maximize presynaptic activation and constituted a minimum number of stimuli that could avoid short-term plasticity while enhancing the probability of post-synaptic potentials (Soleng et al 2004). The wait time of 5s between pulse pairs was empirically chosen as a minimum that avoided desensitization.
2.2. Recording and signal processing
The data samples were obtained at day 20 (± 2 days) as 3 min recordings (1 recording/array, 5 arrays/condition) sampled at 40 kHz and amplified 1100x using a Multichannel System amplifier with a bandwidth of 8 Hz – 3 kHz. The signal from a reference electrode was subtracted from each recording, and data samples were digitally processed using a modification of SpyCodeV2.0 software (Bologna et al 2010) including custom MATLAB scripts. Customizations and scripts were programmed using MATLAB version 7.10.0.499 (R2010a) with MathWorks Signal Processing and Statistics Toolboxes.
2.3. Spike and Burst Detection criteria
In preparation for spike detection, recordings were digitally filtered through a 400-tap Hamming windowed high pass FIR filter with a 300 Hz cutoff. Background noise levels were computed as the minimum standard deviation of 1-second windows over the entire recording. To minimize false positives with maximum sensitivity, spikes were detected as peak-to-peak deviations of 11x the standard deviation of the noise (Ide et al 2010) in 2 ms sliding windows with a post-spike dead time of 1ms. To automatically reject shorted or open electrodes, active channels were selected with a minimum background noise level of 1 μV and a maximum of 10 μV, respectively. To eliminate false spike detections, real spikes were identified as having a peak-to-peak height in the range of 24-400 μV and “half-height” widths in the range of 150-900 μs, where the height is considered the distance of the spike peak from 0. Active electrodes were selected as having spike rates between 0.01 Hz and 100 Hz, while bursts were defined as a series of at least 5 spikes separated by no more than a 100 ms inter-spike interval.
2.4. Spectrogram processing
In preparation for spectrogram processing, recordings were subjected to successive decimation stages followed by Fourier transforms of 1 second windows from each 180 sec recording. Windows were chosen small enough to preserve resolution in time, but large enough to detect delta oscillations as low as 1 Hz. The decimation stages consist of a 200-tap, low-pass Hamming windowed FIR filter with a 4900 Hz cutoff and a down-sampling to 10 kHz followed by a 200-tap, low-pass Hamming windowed FIR filter with a 950 Hz cut-off and down-sampling to 2 kHz (Geckinli and Yavuz 1978). A Fourier transform was then obtained for every 1-second window for each channel-electrode, resulting in a spectrogram of 1 Hz resolution. Next, to equalize the signal distortions caused by the analog amplifier characteristic, a point-by-point correction weight was applied to the spectrum using the inverse of the amplifier response (Fig. S1).
To ensure that single unit spikes were not causing impulse response artifacts (or ringing) of the digital filter, the unit impulse response of the gamma band FIR filter was inspected and visually compared to gamma oscillations. The frequency characteristics and impulse response of the filter are shown in Figs. S2A and S2B respectively. Further, the magnitude of the ringing in the time domain (Fig.S2B) is 3000-fold lower than the unit impulse, while the peak-to-peak amplitude of gamma oscillations observed in Figs. 2A and 2B display only a 2-fold decrease compared to the raw signal in the same figure. Also, in Fig. S3, we applied the band-pass filter for the gamma band to both a low-pass filtered and high-pass filtered version of the raw signal separately. We thus determined that the ringing artifact (Fig. S3F) accounted for less than 0.05% of the network gamma waveform (Fig. S3B).
Figure 2.
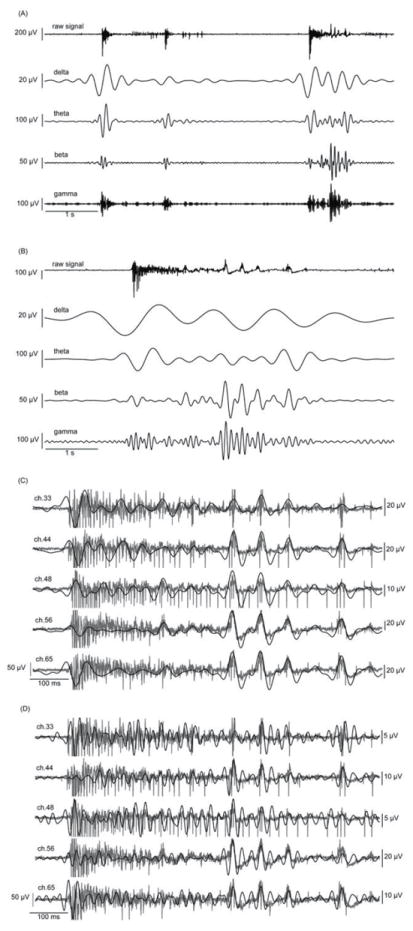
(A) Signals filtered to specific frequency bands show increases in wave amplitude during burst events. (B) Details of specific frequency bands show slow wave progression within a single burst event. (C) The five most active channels in one recording are superimposed with corresponding beta oscillation during a burst event. Some portions of the beta wave display synchronicity between electrodes (latter half of the segment) while other portions do not (earlier half) in this 550 ms sample. (D) Gamma oscillations follow the baseline of the raw signal. Gamma also increases in amplitude during a burst event and is occasionally synchronous between electrodes in this 550 ms sample.
2.5. Frequency bands and spike phase processing
To obtain the phase at which each spike occurred within the slow wave, first the slow wave was enhanced using FIR filters. In particular, the down-sampled signal (at 10 kHz sampling rate) was further processed using a Hamming windowed FIR band-pass filter of length 20,000 (for delta), 10,000 (for beta and theta) and 5,000 (for gamma) to enhance the component in the frequency band of interest, that is delta (1-4 Hz), theta (4-11 Hz), beta (11-30 Hz) or gamma (30-55 Hz). All filtering operations were time-compensated to account for the inherent linear-phase lag of the Hamming window and the phase-frequency characteristics of the analog amplifier (Fig. S1B). The time stamps of detected spikes were then compared with the band-filtered wave to determine the phase of the spike. For example, given spike time Ts is between wave peaks at T1 and T2, then spike phase (φ) is computed as in equation (2.1).
| (2.1) |
Thus, φ=0° (or φ=360°) corresponds to the peak of the wave, and φ=180° the trough.
The tendency of spikes to occur in phase with a particular rhythm (modulation) was measured as a deviation from a uniform distribution of spike phases. Thus, a modulation index (MI) was adopted based on the Kullback-Leibler distance between the observed phase distribution (P) of N bins and an equivalent uniform distribution Q (Tort et al 2010).
| (2.2) |
2.6. Glutamate and GAD immunostaining
MEA cultures were immunostained to detect excitatory and inhibitory puncta and somata. Cultures were fixed with a 4% paraformaldehyde, 4% sucrose solution in phosphate buffered saline (PBS) for 20 min. Non-specific sites were blocked and cells were permeabilized for 5 min in 5% normal goat serum (NGS) and 0.5% Triton X-100 (TX-100) in PBS. Primary and secondary antibodies were diluted in 5% NGS, and 0.05% TX-100 in PBS. To label excitatory connections we used primary rabbit anti-glutamate (1:200; Chemicon AB133) with secondary AlexaFluor-488 (1:1000; Molecular Probes A11034) anti-rabbit antibody. To label inhibitory connections, we used mouse anti-GAD 65 (1:250; Sigma G1166) with secondary AlexaFluor-568 (1:2000; Molecular Probes A11031) labeled anti-mouse antibody. Cells were incubated overnight with primary antibodies at 4°C and for 1 hr at room temperature in secondary antibodies. Bisbenzamide was used to label somata (final concentration 1 ug/ml in PBS, 2 min room temperature). Immunostaining densities were collected at constant exposure through a 20x objective and analyzed with Image-pro+ (Media Cybernetics) at constant threshold.
2.7. Statistics
ANOVA was used to compare effects of 0,1 and 3 hr. chronic stimulation with significance set to p<0.001. The reported n is degrees of freedom for the combinations of all measures. Means and standard errors are reported unless otherwise specified. Long-tailed distributions of the spectra were treated as log-normal models (a natural logarithmic transformation defined in Table S1). Choosing a log-normal statistical model over a straight normal and root-normal model was based on a number of criteria including visual inspection (Fig. S4), proximity of the mean to the median (Fig. S5) and kurtosis/skewness measures (Fig. S6) computed using the formulae in Table S2. Total (or integrated) power within each band also had a long tailed distribution modeled here as log-normal (Fig. S7) as were the reported burst measures (Fig. S8).
3. Results
Chronically stimulated and non-stimulated networks were compared in terms of burst measures, spectrograms and spike phase distributions for each slow wave frequency band.
3.1. Burst Analysis
We confirmed and extended our previous findings that, compared to non-stimulated networks (Fig. 1A), chronic stimulation increases the tendency of spikes to group together into shorter, more intense and more frequent bursts of activity (Fig. 1B). Averages over 5 arrays per condition show that stimulated networks display roughly a 20% increase in mean intra-burst spike rate (C) and a 25% reduction in burst duration (D) complemented by a 30% decrease of inter-burst interval (E).
Figure 1.
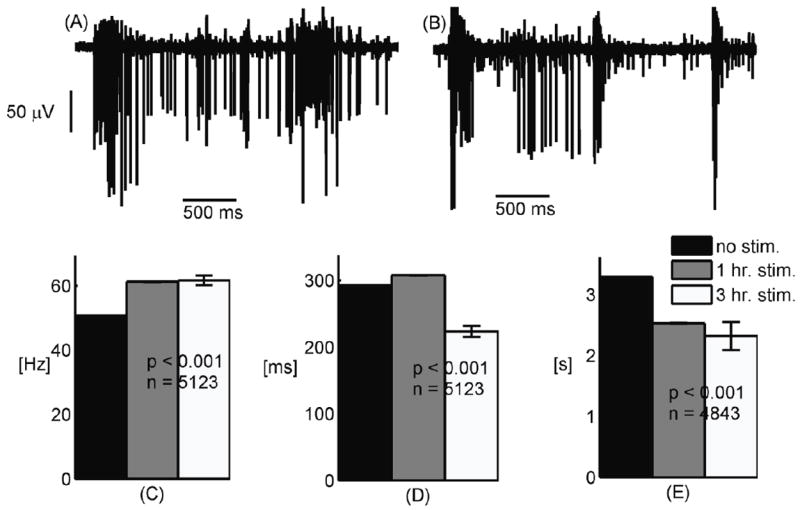
(A) Bursts in non-stimulated networks have a longer duration and are less frequent than in (B) 3 hr. chronically stimulated networks displaying short bursts with higher spike frequency. (C) Spike rate within bursts increases with chronic stimulation, (D) Burst duration decreases with chronic stimulation, (E) Bursts are separated by shorter intervals in chronically stimulated networks.
3.2. Band waves in dissociated neuron networks
We hypothesized that the network would self-organize to produce slow wave oscillations in the resting membrane potential and drive the spiking activity as observed in vivo (Bragin et al 1995a, Lisman et al 2005, Montgomery et al 2008) and in slices (Traub et al 2004, Whittington et al 1997). Low frequency band filtering of the raw signals from 3 week old networks revealed oscillations in the delta band (1-4 Hz), theta band (4-11 Hz), beta band (11-30 Hz) and gamma band (30-55 Hz) occurring primarily during bursts (Figs. 2A and 2B). Figs. 2C and 2D show the 5 most active channels superimposed over the beta and gamma waves. In many instances, the beta and gamma oscillations were visibly mirrored in the raw signal, but their phases were sometimes different on adjacent recording sites.
3.3. Spectrograms and duration of stimulation
Spectrograms of MEA recordings were computed separately for 1-second segments containing bursts and 1-second segments containing no spikes. Bursty segments constituted 5 %, 9 % and 8 % of the total number of segments for 0, 1 and 3 hr. chronically stimulated networks respectively, while non-spiking segments constituted 80 %, 72 % and 77 % of the total number of segments (Figs. 3A-D). Spectrograms of segments containing spikes but not bursts (12 %, 14 % and 12 % of total segments) were very similar to spectrograms of segments with no spikes, except for a decrease in delta band energy (Figs. S9 and S10 in the supplementary documentation). The prominence of gamma activity (30-55 Hz) in bursts is seen for both 1 and 3 hr./day stimulated networks (Figs. 3B and C), but is absent from the non-stimulated networks (Fig.3A). Moreover, the 1 hr./day (Figs. 3B) stimulated networks display a preference for the delta band (1-4 Hz), while the 3 hr./day stimulated networks (Figs. 3C) show more theta band (4-11 Hz) activity. Not surprisingly, the non-spiking windows have a spectrogram that is very similar to a control spectrogram without neurons obtained from an array containing only saline solution (Fig.3D).
Figure 3.
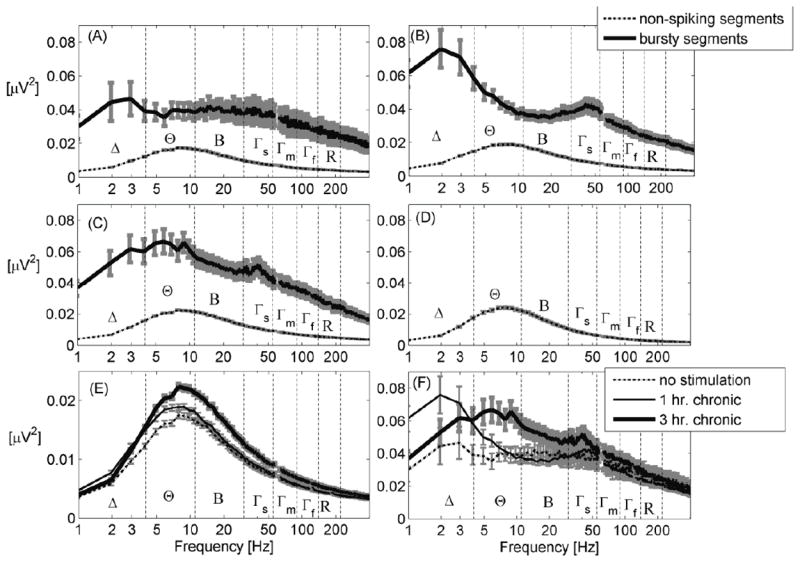
(A)For non-stimulated networks, the spectrogram of bursty signal segments has significantly greater power than the spectrogram of non-spiking segments. (B) Power in the delta (Δ) and slow gamma (Γs) bands is particularly prominent for 1 hr. chronically stimulated networks. (C) Power in the theta (Θ) and slow gamma (Γs) bands is particularly prominent for 3 hr. chronically stimulated networks compared to beta (B), mid gamma (Γm), fast gamma (Γf) and ripple (R) bands. (D) Spectrogram of a recording from an MEA containing saline solution (control without neurons) shows similarity to spectrograms of non-spiking segments. (E) Comparison of spectrograms of non-spiking segments shows an increase in low-frequency (1-200 Hz) power for networks that have undergone 3 hr. daily stimulation. (F) Comparison of spectrograms of segments containing bursts shows prominence of delta (Δ) in the 1 hr. chronically stimulated networks and a shift into the theta (Θ) range for the 3 hr. chronically stimulated networks. A monotonic increase in gamma with chronic stimulation duration is evident. 60 Hz harmonics ± 3 Hz have been removed from all the plots.
With respect to the duration of chronic stimulation, spectrograms of non-spiking segments show a monotonic increase in band power in all slow-wave bands except delta (1-4 Hz) (Fig. 3E). In contrast, spectrograms of bursty segments (Fig. 3F) show a monotonic increase only in the theta and slow gamma bands. For non-spiking segments, integrated power increased by 15 % (from non-stimulated to 3 hr. stimulated networks) in the delta band and 22-24 % in theta, beta and slow gamma bands (Fig. 4A). For bursty segments (Fig. 4B), integrated power increased by 23 % in the delta band, 38 % in theta and 20-21 % in beta and slow gamma bands. Overall, the power in bursty segments was 3-5-fold higher than in non-spiking segments.
Figure 4.
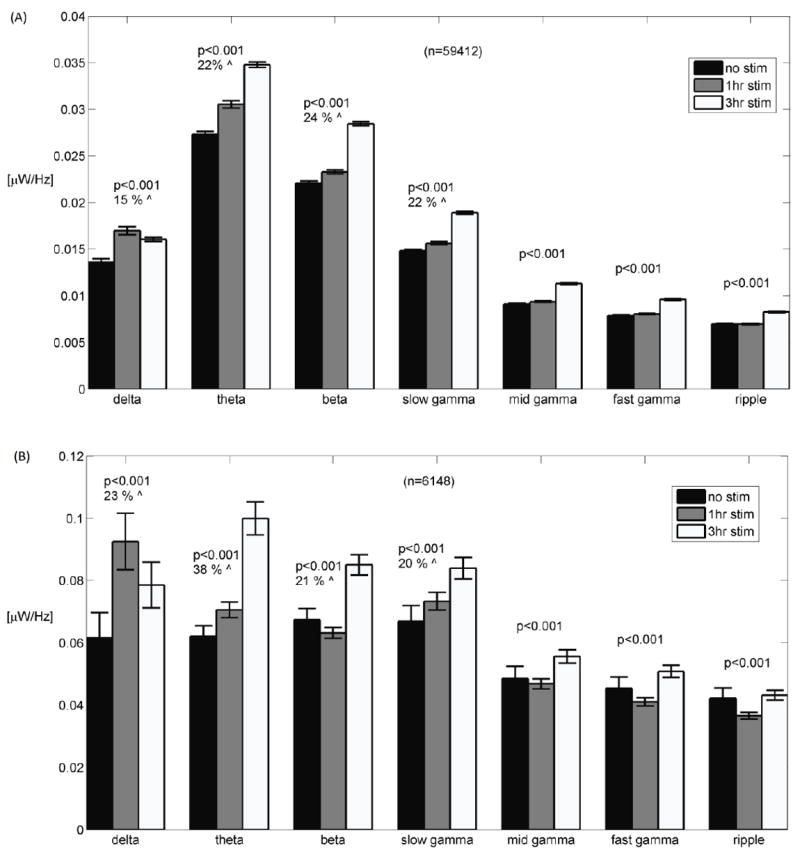
(A) For non-spiking segments, total power per frequency band displays a monotonic increase with stimulation for all bands except for the delta band. (B) For segments containing bursts, total power per frequency band is higher with stimulation for all bands but the ripple band, displaying a monotonic increase with stimulation duration for the theta (4-11 Hz) and slow gamma (30-55 Hz) bands. Error bars are ± standard error. N is the number of 1 sec segments analyzed for each band. Percent increase from minimum to maximum is indicated. p values indicate overall effect of duration of chronic stimulation at each band.
3.4. Relationship of spike time to wave oscillation phase
In observing network organization, we tested the hypothesis that networks develop coordination of spike activation at certain phases of slow wave oscillations (a) in a self organized manner or (b) in response to chronic stimulation. We examined the timing relationship or phase locking of single unit activity (each spike) to each band of slow wave oscillations up to slow gamma. We found that phase locking was strongest in the slow gamma wave as shown in the example burst of Fig. 5A. However, isolated spikes (far from bursts) did not show strong correlations with gamma phase and amplitude (Fig. 5B). For gamma waves, the distribution of all spike phases in 5 non-stimulated arrays produced a peak at the upstroke of the cycle near 225° (Fig 6A). Chronic stimulation did not affect the phase of the synchrony as observed in the stimulated arrays (Fig. 6B). In the case of beta waves, spikes were phase-locked near 270° (Figs. 6C and 6D), though less prominently than in gamma, and with little effect of chronic stimulation. In theta, the distribution of all spike phases of each experimental condition showed little preference or focus (Figs. 6E and 6F). Delta phase modulation of spikes was broadly distributed near the peak of the wave (0°) for all experimental conditions (Figs. 6G and 6H). Overall, spike phase becomes more focused in the delta, beta, and particularly the slow gamma bands, but is not significantly influenced by chronic stimulation.
Figure 5.
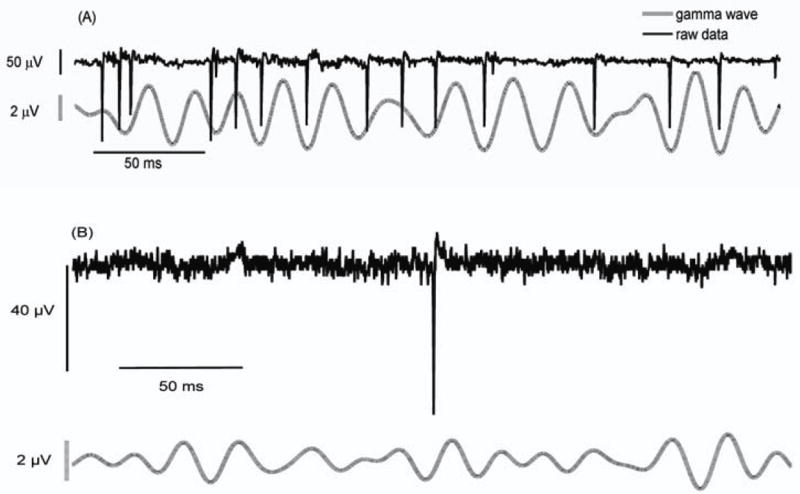
(A) Spikes in the gamma wave (30-55 Hz) tend to occur near 225° (-135°) from the peak in the wave. (B) Isolated spikes do not induce significant filter ringing.
Figure 6.
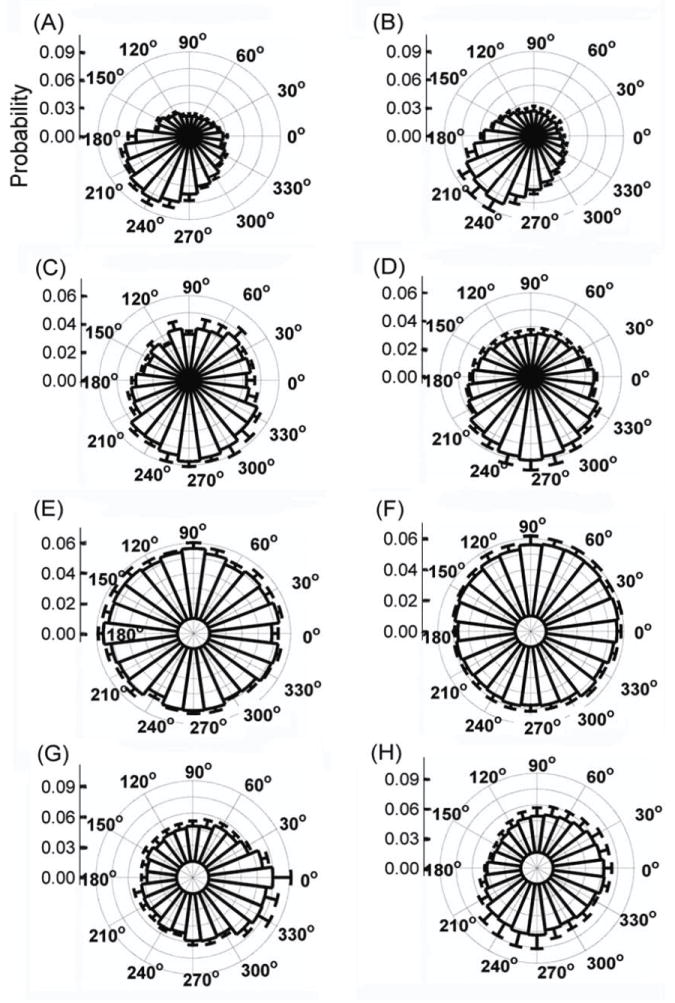
Polarization (in phase) of all spike times for (A) gamma wave - no stimulation, (B) gamma wave – 3 hr. chronic stimulation, (C) beta wave - no stimulation, (D) beta wave – 3 hr. chronic stimulation, (E) theta wave - no stimulation, (F) theta wave – 3 hr. chronic stimulation, (G) delta wave - no stimulation, (H) delta wave – 3 hr. chronic stimulation.
Looking at spike timing and phase on an electrode-by-electrode basis revealed a strong preference of spikes to occur at particular phases in each of the slow-wave bands, hence a high modulation index (Fig. 7, upper trace). However, inasmuch as this phase varied among electrodes, the mean distribution of the corresponding array acquired a weaker modulation index (Fig. 7, lower trace). Chronic stimulation had little effect on the modulation index of spike phases, hence all experimental groups were combined in the results of Fig. 7. Overall, for both local (by electrode) and aggregate (by array) phase distributions, the theta band displayed the smallest deviations from uniformity, while gamma displayed the strongest modulation index.
Figure 7.
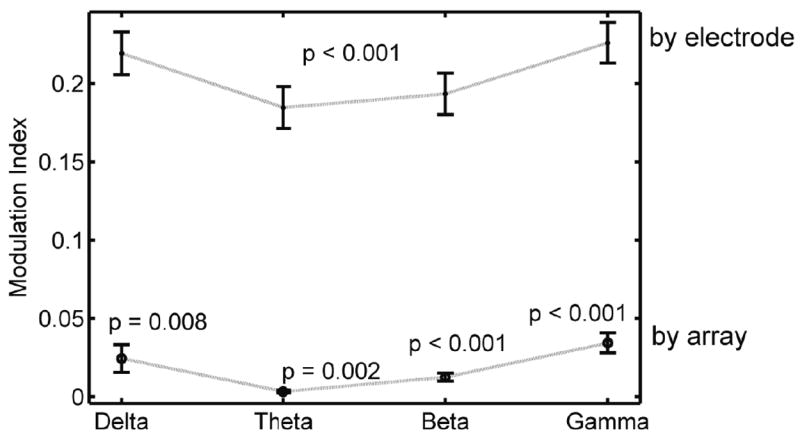
Modulation index (MI) is a normalized form of the Kullback-Leibler distance between the distribution of phases and a uniform probability distribution (Tort et al 2010). MI reflects deviation from uniformity (0 is purely uniform). MI is greater in each slow-wave band for individual electrode distributions (all experimental and control conditions included) than for the corresponding array-wide distributions. In array-wide distributions, spikes are strongly modulated with the beta and slow gamma bands, but not significantly with other bands. P-values indicate significance of deviation from zero (single-tailed t-test).
3.5. Chronic stimulation alters the ratio of excitatory to inhibitory neurons
We evaluated the effect of chronic stimulation on the composition of the network as excitatory neurons immunostained for glutamate and inhibitory neurons stained for glutamic acid decarboxylase (GAD). Fig. 8A shows nearly a 50% reduction in inhibitory neuron (GAD) density associated with chronic stimulation. The density of excitatory neurons (Fig. 8B) was unaffected by chronic stimulation and exceeded the inhibitory staining by 4 to 8-fold. Thus, chronic stimulation evoked a marked decrease in the relative number of inhibitory to excitatory connections that could explain the higher intra-burst spike rates in Fig. 1C.
Figure 8.
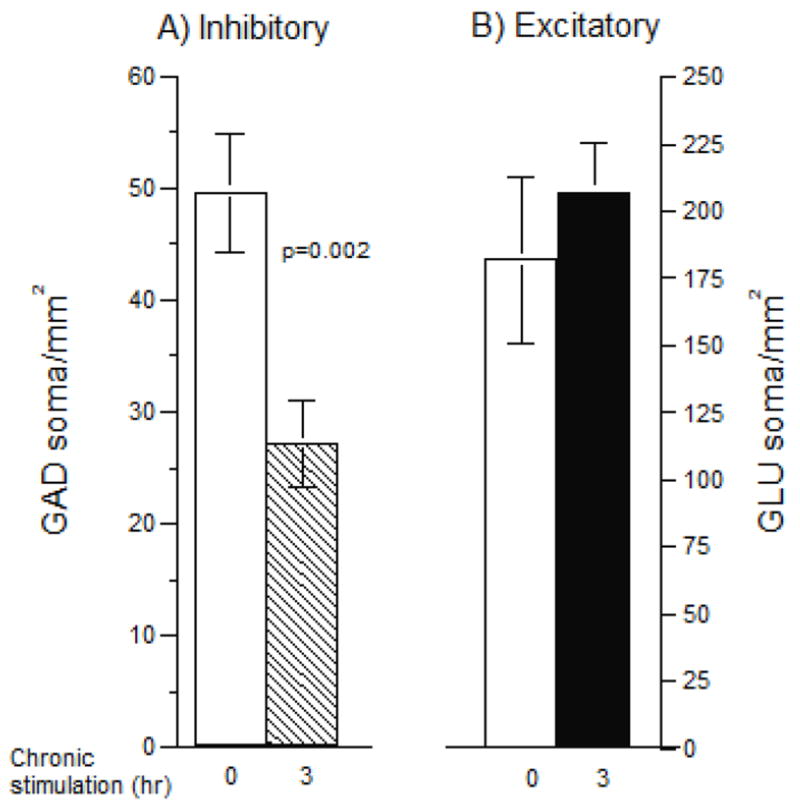
(A) Networks without chronic stimulation have nearly twice as many inhibitory GAD+ immune-fluorescent soma (open bar) compared to networks with 3h/day chronic stimulation (hatched bar). (B) Excitatory glutamate (GLU) positive soma immuno-fluorescence is similar for unstimulated (open bar) or stimulated (closed bar) networks (n=2 MEAs per condition, 8 fields per MEA).
4. Discussion
Networks in this study that were chronically stimulated produced spikes in shorter bursts, higher spike rates and higher burst rates (lower inter-burst interval) associated with a decrease in the inhibitory neuron composition of the network. Spectral analysis revealed that most of the oscillatory activity in our networks occurred during bursts with peaks in the delta (1-4 Hz), theta (4-11 Hz) and slow gamma (30-55 Hz) bands. Furthermore, paired pulse chronic stimulation caused a monotonic increase in power at theta and gamma frequency bands. Other stimulation frequencies and trains were not explored. Notably, these effects occurred without the complex inputs of extra-hippocampal brain regions and without the ordered tri-synaptic network in layers of pyramidal neurons. Phase locking of spikes was strongest in the gamma wave 225° (-135°) or upstroke of the cycle (the peak being at 0°) for all arrays, and was also strong in the remaining bands albeit with varied phase relationships across electrodes. Since extracellular recordings are associated with the time-differential of the trans-membrane voltage (Claverol-Tinture and Pine 2002), this suggests spike timing at a particular phase of the intracellular IPSP. Although spike timing was significantly correlated with all slow wave bands, chronic stimulation did not cause a significant shift in phase or increase in modulation strength. These results have implications for the coding of information in bursts, time and frequency.
The tendency of spikes to occur in bursts is a phenomenon associated with network maturation (Wagenaar et al 2006) while the overall increase in spike and burst rates is consistent with the presence of more excitatory connections over inhibitory connections. Although theta waves have been associated with both inhibitory and excitatory connections (Kendrick et al 2011), our observed increased ratio of excitatory to inhibitory composition with chronic stimulation suggests that less inhibitory drive contributes to the increased theta power.
Spikes consistently follow the beta and gamma waves (at ~225°) even after chronic stimulation, suggesting a close relation of the observed oscillation to the corresponding single unit activity. If these oscillations correspond to sub-threshold current events such as the EPSP or IPSP mediated by specific receptors, then associations may be captured between slow waves observed on any one electrode and single unit activity of other electrodes in the array. This is partially confirmed by the tendency of burst events to be a network-wide phenomenon, observed to occur simultaneously on multiple array channels. Thus, as slow waves increase in amplitude during these events, they also coincide with increased single unit activities on other channels. Further analysis using cross-correlations will elucidate this relationship more clearly.
Theta and gamma oscillations are proposed to serve a number of purposes related to the encoding of episodic memory, higher order associations and learning (Buzsaki 2005, Colgin and Moser 2010, Lisman and Buzsaki 2008). The presence of these bands in cultured networks and their close association with single unit spikes suggests that networks of hippocampal neurons may form an inherent mechanism of spike phase synchrony that is only modulated through feedback connectivity with the cortex.
4.1. Slow gamma band power and phase-locking
The spectrograms in Fig.3F and bar charts of Fig. 4B indicate that chronic stimulation has a more prominent effect on the slow gamma band rather than the fast gamma band. In the intact brain, a large proportion of neurons in the CA3 are synchronized to CA1 at the slow gamma cycle, while the medial entorhinal cortex (MEC) region is largely in tune with the CA1 fast gamma (Colgin et al 2009b). In the context of our cultured networks, the prominence of slow gamma over the fast gamma range may be due to the absence of MEC neurons in our preparations.
Patch-clamp studies of whole cells within slices indicate synchronous firing within the gamma band associated with activation of metabotropic glutamate receptors after brief (15 to 20 pulses, 50 μs pulse width, 80-100 Hz) tetanic stimulation (Whittington et al 2001,Whittington et al 1997). In the present study, it may be that our stimulation protocol induces a similar metabotropic reaction in the short term. However, after repeated (chronic) application of the protocol over a period of 20 days, the network response may become sustained or learned through LTP.
Other mechanisms reported to facilitate gamma oscillations in slice preparations and in-vivo studies include external pacemakers, gap junctions and feedback loops within the hippocampus, or a combination of these (Mann and Paulsen 2005). In isolated networks of dissociated hippocampal cells, external pacemakers are ruled out. However, there is evidence suggesting that oscillations are enabled by both inhibitory and excitatory paths acting in concert (Mann and Paulsen 2007). Our finding that the ratio of excitatory-to-inhibitory connections increases with chronic stimulation is further evidence to this.
Slow gamma waves in the intact hippocampus appear to result from IPSP’s that connect CA3 neurons to CA1 for the purpose of memory recall (Colgin et al 2009b, Fisahn et al 1998). The results of our study show a strong correlation between spike times and the upstroke (225°) phase of the gamma wave. Further studies in which specific receptors are pharmacologically inhibited are needed to confirm that GABAA receptors (Vreugdenhil et al 2005) are responsible for this oscillation in culture.
Spike timing was also correlated with the beta cycle near 270°, more so on individual neurons than in the network as a whole, although the modulation strength was less than that of the slow gamma waves. It is interesting that the beta band encompasses our paired-pulse frequency of 20 Hz (50 ms pulse interval). This raises the question of whether shorter or longer pulse intervals would produce stronger effects in gamma or theta compared to beta. In intact hippocampal slices, power in the beta region increases following the decay of gamma activity induced by tetanic stimulation (Bracci et al 1999, Vreugdenhil et al 2005).
4.2. Theta band power increases with chronic stimulation in dissociated networks
Studies of the hippocampus in isolation reveal an emergence of theta oscillations through both excitatory and inhibitory localized feedback loops within the CA1 region (Goutagny et al 2009). Our studies suggest that dissociated neurons from the embryonic hippocampus have the capacity to self-organize these feedback loops, independent of external inputs. In the intact brain, the medial septum-diagonal band of Broca (MS-DBB), possibly in conjunction with feedback connections to and from the hippocampus, plays a central role as a pacemaker in theta rhythm generation (Buzsaki et al 2002). In awake and behaving rats, studies of the hippocampus reveal a role of theta in modulating the gamma wave (Bragin et al 1995b). In studies of the intact hippocampus, theta is implicated as a switch in the memory encoding and recall cycle. In particular, slow gamma and recall is associated with spikes appearing on the falling edge (90°) of theta (Colgin et al 2009b). Our finding of lower levels of GAD-positive inhibitory neuron staining with stimulation suggests that the increase in theta and gamma waves was driven by a shift toward more excitatory over inhibitory connections.
4.3. Sharp-waves, the delta band and bursts
We find delta or sharp waves (1-4 Hz) in association with synchronous bursts in our networks that increase with chronic stimulation. These findings suggest that sharp waves and theta oscillations are also inherent to dissociated neural networks and do not exclusively emerge in the dense connectivity patterns of the intact hippocampus. Short-term stimulation decreases bursts (Stegenga et al 2010, Wagenaar et al 2005). However, we find that chronic stimulation increases burst rates.
Sharp waves (0.3-4 Hz) are associated with synchronous population bursts from recurrent connections in the CA3 (Buzsaki 1986, Csicsvari et al 2000). Both in-vivo and in-vitro studies of oscillations in the sharp wave range reveal an intrinsic capability of the hippocampus to generate waveforms in this frequency range without external input (Csicsvari et al 1999, Kubota et al 2003). Sharp waves in the delta band are believed to be responsible for associating (or consolidating) large numbers of cell assemblies (or memory items) during slow-wave sleep, awake immobility, and idle tasks (Buzsaki 1986, Wagner et al 2004). Delta waves are also associated with drowsiness and sleep (Molle et al 2006). With a shift from wakeful to a drowsy state in rats, the hippocampal EEG spectrum shifts abruptly from theta to the delta (Tani and Ishihara 1988). Although this shift was not evident between our non-stimulated and 1 hr.-stimulated networks, there was a respective increase in theta band power (Figs. 4A and 4B) and a marked “theta-shift” between the spectrograms of our 1 hr. and 3 hr.-stimulated networks (see Fig. 3F). This raises the question of whether the absence of external stimulation imposes a “sleep”-state on the network. Conversely, some form of external stimulation may be required to activate an “awake” state, as in the intact hippocampus.
In summary, the presence of low frequency oscillations and their association with spikes and bursts in networks from dissociated hippocampal cells suggests that cultured networks of neurons tend to form connections that self-assemble these oscillations. Chronic stimulation enhances these waveforms, suggesting a possible emulation of in-vivo conditions. Spikes were most prominently phase-locked to the upstroke (225-270°) of the slow gamma and beta waves regardless of chronic stimulation, and also phase-locked to local delta and theta oscillations suggesting an inherent mechanism of spike phase synchrony in networks of hippocampal neurons. Thus, hippocampal neurons self-assemble to emulate in-vivo conditions even when they are dissociated from each-other in culture at the embryonic stage of development. This finding further complements the existing evidence of a highly adaptive and modular hippocampus. Also, this enables unprecedented pharmacologic access in the investigation of the origins and propagation of slow wave oscillations in cultured hippocampal networks.
Supplementary Material
Acknowledgments
This work was supported in part by NIH NS052233 (B.C. Wheeler, P.I.). The authors would like to thank Prof. S. Martinoia, Dr. Michela Chiappalone and all the authors of SpyCodeV2.0 MEA analysis software. G.J.B. invented the NbActiv4 culture medium used in these studies and obtained from his company, BrainBits LLC. Other authors have no competing financial interests to declare. S.S.L. analyzed nearly all the data and wrote the paper. G.J.B. and B.C.W. designed the research and edited the paper. M.D.B. isolated neurons, prepared and stimulated cultures, collected signals, analyzed data and wrote portions of the paper.
References
- Banker GA, Cowan WM. Rat hippocampal neurons in dispersed cell culture. Brain Res. 1977;126:397–425. doi: 10.1016/0006-8993(77)90594-7. [DOI] [PubMed] [Google Scholar]
- Bologna LL, Pasquale V, Garofalo M, Gandolfo M, Baljon PL, Maccione A, Martinoia S, Chiappalone M. Investigating neuronal activity by SPYCODE multi-channel data analyzer. Neural Netw. 2010;23:685–97. doi: 10.1016/j.neunet.2010.05.002. [DOI] [PubMed] [Google Scholar]
- Bracci E, Vreugdenhil M, Hack SP, Jefferys JG. On the synchronizing mechanisms of tetanically induced hippocampal oscillations. J Neurosci. 1999;19:8104–13. doi: 10.1523/JNEUROSCI.19-18-08104.1999. [DOI] [PMC free article] [PubMed] [Google Scholar]
- Bragin A, Jando G, Nadasdy Z, Hetke J, Wise K, Buzsaki G. Gamma (40-100 Hz) oscillation in the hippocampus of the behaving rat. J Neurosci. 1995b;15:47–60. doi: 10.1523/JNEUROSCI.15-01-00047.1995. [DOI] [PMC free article] [PubMed] [Google Scholar]
- Brewer GJ, Boehler MD, Ide AN, Wheeler BC. Chronic electrical stimulation of cultured hippocampal networks increases spontaneous spike rates. J Neurosci Methods. 2009;184:104–9. doi: 10.1016/j.jneumeth.2009.07.031. [DOI] [PMC free article] [PubMed] [Google Scholar]
- Brewer GJ, Boehler MD, Jones TT, Wheeler BC. NbActiv4 medium improvement to Neurobasal/B27 increases neuron synapse densities and network spike rates on multielectrode arrays. J Neurosci Methods. 2008;170:181–7. doi: 10.1016/j.jneumeth.2008.01.009. [DOI] [PMC free article] [PubMed] [Google Scholar]
- Brewer GJ, Torricelli JR, Evege EK, Price PJ. Optimized survival of hippocampal neurons in B27-supplemented Neurobasal, a new serum-free medium combination. J Neurosci Res. 1993;35:567–576. doi: 10.1002/jnr.490350513. [DOI] [PubMed] [Google Scholar]
- Brown EN, Lydic R, Schiff ND. General anesthesia, sleep, and coma. N Engl J Med. 2010;363:2638–50. doi: 10.1056/NEJMra0808281. [DOI] [PMC free article] [PubMed] [Google Scholar]
- Buzsaki G. Hippocampal sharp waves: their origin and significance. Brain Res. 1986;398:242–52. doi: 10.1016/0006-8993(86)91483-6. [DOI] [PubMed] [Google Scholar]
- Buzsaki G. Theta rhythm of navigation: link between path integration and landmark navigation, episodic and semantic memory. Hippocampus. 2005;15:827–40. doi: 10.1002/hipo.20113. [DOI] [PubMed] [Google Scholar]
- Buzsaki G, Csicsvari J, Dragoi G, Harris K, Henze D, Hirase H. Homeostatic maintenance of neuronal excitability by burst discharges in vivo. Cereb Cortex. 2002;12:893–9. doi: 10.1093/cercor/12.9.893. [DOI] [PubMed] [Google Scholar]
- Claverol-Tinture E, Pine J. Extracellular potentials in low-density dissociated neuronal cultures. J Neurosci Methods. 2002;117:13–21. doi: 10.1016/s0165-0270(02)00043-2. [DOI] [PubMed] [Google Scholar]
- Colgin LL, Denninger T, Fyhn M, Hafting T, Bonnevie T, Jensen O, Moser MB, Moser EI. Frequency of gamma oscillations routes flow of information in the hippocampus. Nature. 2009a;462:353–7. doi: 10.1038/nature08573. [DOI] [PubMed] [Google Scholar]
- Colgin LL, Moser EI. Gamma oscillations in the hippocampus. Physiology (Bethesda) 2010;25:319–29. doi: 10.1152/physiol.00021.2010. [DOI] [PubMed] [Google Scholar]
- Csicsvari J, Hirase H, Czurko A, Mamiya A, Buzsaki G. Fast network oscillations in the hippocampal CA1 region of the behaving rat. J Neurosci. 1999;19:RC20. doi: 10.1523/JNEUROSCI.19-16-j0001.1999. [DOI] [PMC free article] [PubMed] [Google Scholar]
- Csicsvari J, Hirase H, Mamiya A, Buzsaki G. Ensemble patterns of hippocampal CA3-CA1 neurons during sharp wave-associated population events. Neuron. 2000;28:585–94. doi: 10.1016/s0896-6273(00)00135-5. [DOI] [PubMed] [Google Scholar]
- Eytan D, Brenner N, Marom S. Selective adaptation in networks of cortical neurons. J Neurosci. 2003;23:9349–56. doi: 10.1523/JNEUROSCI.23-28-09349.2003. [DOI] [PMC free article] [PubMed] [Google Scholar]
- Eytan D, Marom S. Dynamics and effective topology underlying synchronization in networks of cortical neurons. J Neurosci. 2006;26:8465–8476. doi: 10.1523/JNEUROSCI.1627-06.2006. [DOI] [PMC free article] [PubMed] [Google Scholar]
- Fisahn A, Pike FG, Buhl EH, Paulsen O. Cholinergic induction of network oscillations at 40 Hz in the hippocampus in vitro. Nature. 1998;394:186–9. doi: 10.1038/28179. [DOI] [PubMed] [Google Scholar]
- Geckinli NC, Yavuz D. Some Novel Windows and A Concise Tutorial Comparison of Window Families. Ieee Transactions on Acoustics Speech and Signal Processing. 1978;26:501–7. [Google Scholar]
- Goutagny R, Jackson J, Williams S. Self-generated theta oscillations in the hippocampus. Nat Neurosci. 2009;12:1491–3. doi: 10.1038/nn.2440. [DOI] [PubMed] [Google Scholar]
- Gross GW. Simultaneous single unit recording in vitro with a photoetched laser deinsulated gold multimicroelectrode surface. IEEE Trans Biomed Eng. 1979;26:273–9. doi: 10.1109/tbme.1979.326402. [DOI] [PubMed] [Google Scholar]
- Ide AN, Andruska A, Boehler M, Wheeler BC, Brewer GJ. Chronic network stimulation enhances evoked action potentials. J Neural Eng. 2010;7:16008. doi: 10.1088/1741-2560/7/1/016008. [DOI] [PMC free article] [PubMed] [Google Scholar]
- Jobling DT, Smith JG, Wheal HV. Active microelectrode array to record from the mammalian central nervous system in vitro. Med Biol Eng Comput. 1981;19:553–60. doi: 10.1007/BF02442768. [DOI] [PubMed] [Google Scholar]
- Kendrick KM, Zhan Y, Fischer H, Nicol AU, Zhang X, Feng J. Learning alters theta amplitude, theta-gamma coupling and neuronal synchronization in inferotemporal cortex. BMC Neurosci. 2011;12:55. doi: 10.1186/1471-2202-12-55. [DOI] [PMC free article] [PubMed] [Google Scholar]
- Kubota D, Colgin LL, Casale M, Brucher FA, Lynch G. Endogenous waves in hippocampal slices. J Neurophysiol. 2003;89:81–9. doi: 10.1152/jn.00542.2002. [DOI] [PubMed] [Google Scholar]
- Lisman J. The theta/gamma discrete phase code occuring during the hippocampal phase precession may be a more general brain coding scheme. Hippocampus. 2005;15:913–22. doi: 10.1002/hipo.20121. [DOI] [PubMed] [Google Scholar]
- Lisman J, Buzsaki G. A neural coding scheme formed by the combined function of gamma and theta oscillations. Schizophr Bull. 2008;34:974–80. doi: 10.1093/schbul/sbn060. [DOI] [PMC free article] [PubMed] [Google Scholar]
- Lisman JE, Talamini LM, Raffone A. Recall of memory sequences by interaction of the dentate and CA3: a revised model of the phase precession. Neural Netw. 2005;18:1191–201. doi: 10.1016/j.neunet.2005.08.008. [DOI] [PubMed] [Google Scholar]
- Maffei A, Nataraj K, Nelson SB, Turrigiano GG. Potentiation of cortical inhibition by visual deprivation. Nature. 2006;443:81–4. doi: 10.1038/nature05079. [DOI] [PubMed] [Google Scholar]
- Mann EO, Paulsen O. Mechanisms underlying gamma (‘40 Hz’) network oscillations in the hippocampus--a mini-review. Prog Biophys Mol Biol. 2005;87:67–76. doi: 10.1016/j.pbiomolbio.2004.06.004. [DOI] [PubMed] [Google Scholar]
- Mann EO, Paulsen O. Role of GABAergic inhibition in hippocampal network oscillations. Trends Neurosci. 2007;30:343–9. doi: 10.1016/j.tins.2007.05.003. [DOI] [PubMed] [Google Scholar]
- Molle M, Yeshenko O, Marshall L, Sara SJ, Born J. Hippocampal sharp wave-ripples linked to slow oscillations in rat slow-wave sleep. J Neurophysiol. 2006;96:62–70. doi: 10.1152/jn.00014.2006. [DOI] [PubMed] [Google Scholar]
- Montgomery SM, Sirota A, Buzsaki G. Theta and gamma coordination of hippocampal networks during waking and rapid eye movement sleep. J Neurosci. 2008;28:6731–41. doi: 10.1523/JNEUROSCI.1227-08.2008. [DOI] [PMC free article] [PubMed] [Google Scholar]
- Onslow AC, Bogacz R, Jones MW. Quantifying phase-amplitude coupling in neuronal network oscillations. Prog Biophys Mol Biol. 2011;105:49–57. doi: 10.1016/j.pbiomolbio.2010.09.007. [DOI] [PubMed] [Google Scholar]
- Pine J. Recording action potentials from cultured neurons with extracellular microcircuit electrodes. J Neurosci Methods. 1980;2:19–31. doi: 10.1016/0165-0270(80)90042-4. [DOI] [PubMed] [Google Scholar]
- Rolls ET. A computational theory of episodic memory formation in the hippocampus. Behav Brain Res. 2010;215:180–96. doi: 10.1016/j.bbr.2010.03.027. [DOI] [PubMed] [Google Scholar]
- Simon C, Kezunovic N, Ye M, Hyde J, Hayar A, Williams DK, Garcia-Rill E. Gamma band unit activity and population responses in the pedunculopontine nucleus. J Neurophysiol. 2010;104:463–74. doi: 10.1152/jn.00242.2010. [DOI] [PMC free article] [PubMed] [Google Scholar]
- Soleng AF, Baginskas A, Andersen P, Raastad M. Activity-dependent excitability changes in hippocampal CA3 cell Schaffer axons. J Physiol. 2004;560:491–503. doi: 10.1113/jphysiol.2004.071225. [DOI] [PMC free article] [PubMed] [Google Scholar]
- Stegenga J, le Feber J, Marani E, Rutten W. The effect of learning on Bursting. IEEE Trans Biomed Eng. 2009;56:1220–7. doi: 10.1109/TBME.2008.2006856. [DOI] [PubMed] [Google Scholar]
- Stegenga J, le FJ, Marani E, Rutten WL. Phase-dependent effects of stimuli locked to oscillatory activity in cultured cortical networks. Biophys J. 2010;98:2452–8. doi: 10.1016/j.bpj.2010.02.026. [DOI] [PMC free article] [PubMed] [Google Scholar]
- Tani Y, Ishihara T. Changes in EEG associated with sleep-awake behavior in young adult versus aged adult Fischer-344 rats. Physiol Behav. 1988;44:389–92. doi: 10.1016/0031-9384(88)90042-x. [DOI] [PubMed] [Google Scholar]
- Thomas CA, Jr, Springer PA, Loeb GE, Berwald-Netter Y, Okun LM. A miniature microelectrode array to monitor the bioelectric activity of cultured cells. Exp Cell Res. 1972;74:61–6. doi: 10.1016/0014-4827(72)90481-8. [DOI] [PubMed] [Google Scholar]
- Tort AB, Komorowski R, Eichenbaum H, Kopell N. Measuring phase-amplitude coupling between neuronal oscillations of different frequencies. J Neurophysiol. 2010;104:1195–210. doi: 10.1152/jn.00106.2010. [DOI] [PMC free article] [PubMed] [Google Scholar]
- Traub RD, Bibbig A, LeBeau FE, Buhl EH, Whittington MA. Cellular mechanisms of neuronal population oscillations in the hippocampus in vitro. Annu Rev Neurosci. 2004;27:247–78. doi: 10.1146/annurev.neuro.27.070203.144303. [DOI] [PubMed] [Google Scholar]
- Vreugdenhil M, Bracci E, Jefferys JG. Layer-specific pyramidal cell oscillations evoked by tetanic stimulation in the rat hippocampal area CA1 in vitro and in vivo. J Physiol. 2005;562:149–64. doi: 10.1113/jphysiol.2004.075390. [DOI] [PMC free article] [PubMed] [Google Scholar]
- Wagenaar DA, Madhavan R, Pine J, Potter SM. Controlling bursting in cortical cultures with closed-loop multi-electrode stimulation. J Neurosci. 2005;25:680–8. doi: 10.1523/JNEUROSCI.4209-04.2005. [DOI] [PMC free article] [PubMed] [Google Scholar]
- Wagenaar DA, Pine J, Potter SM. An extremely rich repertoire of bursting patterns during the development of cortical cultures. BMC Neurosci. 2006;7:11–7. doi: 10.1186/1471-2202-7-11. [DOI] [PMC free article] [PubMed] [Google Scholar]
- Wagner U, Gais S, Haider H, Verleger R, Born J. Sleep inspires insight. Nature. 2004;427:352–5. doi: 10.1038/nature02223. [DOI] [PubMed] [Google Scholar]
- Wheeler BC, Novak JL. Current source density estimation using microelectrode array data from the hippocampal slice preparation. IEEE Trans Biomed Eng. 1986;33:1204–12. doi: 10.1109/TBME.1986.325701. [DOI] [PubMed] [Google Scholar]
- Whittington MA, Doheny HC, Traub RD, LeBeau FE, Buhl EH. Differential expression of synaptic and nonsynaptic mechanisms underlying stimulus-induced gamma oscillations in vitro. J Neurosci. 2001;21:1727–38. doi: 10.1523/JNEUROSCI.21-05-01727.2001. [DOI] [PMC free article] [PubMed] [Google Scholar]
- Whittington MA, Stanford IM, Colling SB, Jefferys JG, Traub RD. Spatiotemporal patterns of gamma frequency oscillations tetanically induced in the rat hippocampal slice. J Physiol. 1997;502(Pt 3):591–607. doi: 10.1111/j.1469-7793.1997.591bj.x. [DOI] [PMC free article] [PubMed] [Google Scholar]
Associated Data
This section collects any data citations, data availability statements, or supplementary materials included in this article.