

Abstract
Background
The intestine demonstrates profound circadian rhythmicity in glucose absorption in rodents, mediated entirely by rhythmicity in the transcription, translation and function of the sodium glucose co-transporter SGLT1 (Slc5a1). Clock genes are rhythmic in the intestine and have been implicated in the regulation of rhythmicity of other intestinal genes, however their role in the regulation of SGLT1 is unknown. We investigated the effects of one clock gene, PER1, on SGLT1 transcription in vitro.
Methods
Caco-2 cells were stably transfected with knockdown vectors for PER1 and mRNA expression of clock genes and SGLT1 determined using quantitative polymerase chain reaction (qPCR). Chinese hamster ovary (CHO) cells were transiently cotransfected with combinations of the PER1 expression vectors and the wild-type SGLT1-luciferase promoter construct or the promoter with mutated E-box sequences.
Results
Knockdown of PER1 increased native SGLT1 expression in Caco-2 enterocytes, while promoter studies confirmed that the inhibitory activity of PER1 on SGLT1 occurs via the proximal 1kb of the SGLT1 promoter. E-box sites exerted a suppressive effect on the SGLT1 promoter, however mutation of E-boxes had little effect on the inhibitory activity of PER1 on the SGLT1 promoter suggesting that the actions of PER1 on SGLT1 are independent of E-boxes.
Conclusions
Our findings suggest that PER1 exerts an indirect suppressive effect on SGLT1, possibly acting via other clock-controlled genes binding to non-E-box sites on the SGLT1 promoter. Understanding the regulation of rhythmicity of SGLT1 may lead to new treatments for the modulation of SGLT1 expression in conditions such as malabsorption, diabetes and obesity.
Keywords: Clock genes, SGLT1, circadian, PER1, intestine
Introduction
The intestine exhibits profound circadian rhythmicity in glucose absorption in rodents, mediated entirely by rhythmicity in the transcription, translation and function of the sodium glucose co-transporter SGLT1 (Slc5a1)[1]. SGLT1 resides on the apical border of enterocytes and is responsible for all active glucose uptake[2,3]. We have previously demonstrated that the circadian rhythmicity of SGLT1 expression in rats is cued at a transcriptional level and is anticipatory in nature, occurring before the arrival of nutrients in the gut lumen and likely to be entrained by the nocturnal pattern of nutrient consumption in rats[1,4]. The molecular pathways regulating the rhythmicity in Sglt1 expression, however, remain unclear.
Clock genes are known to control the rhythmicity behind many circadian functions[5,6] by regulating a large number of so-called “clock-controlled genes”[7–9]. The master clock in mammals resides in the suprachiasmatic nucleus (SCN) regulated via opposing positive and negative molecular feedback loops which interact to maintain a 24-h periodicity entrained by light[10]. Mammalian clock components include the genes Per1, Per2, Clock, Bmal1, ReverbA and B, Cry 1 and Cry2. Heterodimers of Clock and Bmal1 positively regulate Per and Cry genes via promoter E-boxes (consensus sequence CAnnTG). Nuclear accumulation of Per and Cry acts to inhibit Clock/Bmal1 activity, which in turn represses Per and Cry, thereby setting up an oscillation in their expression[11,12]. ReverbA and ReverbB are orphan nuclear receptors which have been identified as key regulators linking the positive and negative limbs of the circadian oscillator, with Reverb transcription driven by Bmal1/Clock but suppressed by Per and Cry[13,14]. Clock genes are also expressed in many peripheral tissues, including the heart, retina, lung, kidney, peripheral blood cells, liver and intestine[15–19]. In particular rhythmicity of clock gene expression has been implicated in the regulation of the circadian rhythmicity of other intestinal transporters such as the Pept1 gene[8] and the Mdr1 gene[9], making clock genes candidate regulatory factors for rhythmicity of Sglt1 expression.
We previously demonstrated substantial circadian rhythmicity in the expressions of both Sglt1 and circadian clock genes in the rat intestine[1,4]. These rhythms are cued by nutrients, and can be phase shifted on restricting nutrient availability to the lights-on period in the normally nocturnal rat[19]. The clock gene Per1 in particular demonstrated similar phase shifts to Sglt1 upon restricted-feeding, and a decrease in protein expression coincident with an increase in SGLT1 mRNA expression during the lights on (fasting) period. PER1 was therefore considered a potential candidate clock gene which might act to mediate rhythmicity in SGLT1 expression. Our previous in vivo observations led us to hypothesize that PER1 may exert a suppressive role on SGLT1 mRNA expression in enterocytes. To explore this further, we examined the effects of manipulating PER1 expression levels on SGLT1 transcription in vitro by using knockdown of PER1 and attempted to decipher the effect of specific effects of PER1 on binding elements on the SGLT1 promoter. We demonstrate here that PER1 is able to suppress SGLT1 expression in enterocytes via the SGLT1 promoter independent of E-box sites on the SGLT1 promoter, which are themselves able to suppress SGLT1 transcriptional activity.
Materials and methods
Cell culture and transfections for stable PER1 knockdown
Caco-2 cells, which differentiate into small bowel epithelium and express SGLT1 on confluence[20], were purchased from the American Type Culture Collection (ATCC, Manassas, VI) and maintained in an incubator at 37°C at 95% humidity and 5% CO2 in DMEM (Invitrogen, Carlsbad, CA) supplemented with 10% fetal bovine serum (FBS, Invitrogen) and 1% penicillin-streptomycin (Invitrogen). Knockdown vectors containing short-hairpin RNA sequences against PER1 (pLKO.1-puro) were purchased from Sigma (St Louis, MO), consisting of sequences designed against the PER1 RefSeq sequence NM_002616. BLAST searches were conducted for each shRNA sequence against human GenBank and RefSeq databases (http://www.ncbi.nlm.nih.gov.ezp-prod1.hul.harvard.edu/BLAST) to exclude homology of the PER1 shRNA to other genes. The pLKO.1-puro vector containing a scrambled oligonucleotide sequence (Sigma) was used as a negative control. Cells were transfected at passages 10–12 at 40% confluence with knockdown vectors for PER1 using Effectene (Qiagen, Valencia, CA) according to manufacturer’s instructions. At 48 hours, antibiotic selection was commenced using 4μg/ml puromycin (Invivogen, San Diego, CA) to allow stable selection of transfected cells.
RNA extraction and real-time PCR
Stably transfected Caco-2 cells were harvested at 7 days post-confluence and total RNA extracted using the mirVana kit (Ambion; Austin, TX). Samples were reverse transcribed simultaneously with Superscript III (Invitrogen) and oligo-dT. Real-time PCR was performed as previously described[1]. mRNA (messenger ribonucleic acid) levels were expressed as ratios to the stably-expressed B-actin. All primers were ordered as custom oligonucleotides from Invitrogen (Supplemental Table 1), except SGLT1 and PER1 for which mRNA expression was measured using the Taqman primer-probe and gene expression Master Mix (Applied Biosystems, Carlsbad, CA).
Protein extraction and Western blotting
Stably transfected Caco-2 cells were harvested at 7 days post-confluence and PER1 protein expression quantified in nuclear protein extracted from cells using the QProteome Nuclear Protein Kit (Qiagen). Western blotting was performed as previously described[1]. Nuclear protein extracts (75μg) were resolved on 4–12% Bis-Tris gels, transferred to PVDF (polyvinylidenefluoride) membranes, blocked, then incubated with rabbit anti-Per1 (1:200; Santa Cruz Biotechnology, Santa Cruz, CA) respectively. Protein expression was normalized to B-actin (mouse anti- B-actin, 1:1000, Labvision, Fremont, CA).
Construction of the PER1 overexpression vector
The human PER1 gene was amplified from human genomic DNA by PCR and inserted into the NheI/NotI sites of the pcDNA3.1(+) vector (Invitrogen) using restriction sites incorporated into the primers (Supplemental Table 2). The following thermal cycling conditions were used for the amplification: 1 cycle at 94°C for 1 minute then 35 cycles of 94°C for 30 sec, 55°C for 30 sec and 68°C for 4 min. The empty pcDNA3.1(+) vector was used as a control (Invitrogen). Vectors were sequenced to ensure fidelity of the amplified PER1 sequence and insertion.
Cloning and site-directed mutagenesis of the SGLT1 promoter
For promoter assays, the previously characterized human SGLT1 promoter (−1968/+14, designated WT SGLT1-Luc) [21] was amplified by PCR from human genomic DNA (Promega, Madison, WI) using primers encoding NotI and NheI restriction sites at the 5′ and 3′ ends respectively (Supplemental Table 3) and inserted into the pcDNA3.1(+) vector (Invitrogen). To test the function of E-box sites within the SGLT1 promoter, site-directed mutagenesis was performed on the pGL3-SGLT1 vector created above using the Phusion Site-directed Mutagenesis kit (NEB, Ipswich, MA). E-boxes were mutated by conversion to NheI restriction sites (GCTAGC) and designated SGLT1-Luc mutEB1 through mutEB4. Single E-box mutations were introduced using a forward primer that incorporated the NheI restriction site in place of the E-box sequence and 15–20 complementary bases on either side and a fully complementary reverse primer. Site-directed mutagenesis primers were acquired from Invitrogen (Supplemental Table 3). To assess synergistic interactions, combinations of E-box mutations (designated mutEB1+2, 1+3 and 1+2+3) were prepared by sequential site-directed mutagenesis of mutated promoters. All constructs were sequenced to confirm successful mutation.
Cell culture and transfections for reporter assays
For reporter assays, CHO cells were purchased from the American Type Culture Collection (ATCC) and maintained in an incubator at 37°C at 95% humidity and 5% CO2 in F12K media (Invitrogen) supplemented with 10% fetal bovine serum (FBS, Invitrogen) and 1% penicillin-streptomycin (Invitrogen). Cells were transfected at passages 10–12 at 80% confluence with combinations of reporter vector (pGL3-Basic, wild-type SGLT1 pGL3/WT-SGLT1luc, or mutated SGLT1 promoter constructs) and expression vector (pcDNA3.1(+) with or without PER1 cDNA) using the transfection agent Effectene (Qiagen). The effect of PER1 knockdown on SGLT1 promoter activity was assessed by co-transfection of the SGLT1 promoter with shRNA vectors in place of expression vectors. Renilla luciferase (pRL-TK; Promega) was included in all transfections to normalize for transfection efficiency. Luciferase expression was measured after 48 hours using the Promega Dual Luciferase Reporter Assay System (Promega).
Statistical analysis
All experiments were performed a total of three times. Data are presented as means ± SE. Student’s t-test, one-way ANOVA and two-way ANOVA were used to identify significant differences between groups. Graphical analysis was performed using Graphpad Prism (San Diego, CA).
For the promoter-reporter assays, the effect of mutating two or more E-box sites was compared to the effect of individual mutations by a previously published method termed “interaction response” [22]. This was determined by the mean logarithm of the ratio of the effect observed with two or more mutations to the sum of effects observed with two or more single mutations (e.g., log {(EB1+2+3)/[(EB1) + (EB2) + (EB3)]}). Interaction values from −0.1 to +0.1 were defined as additive, with values > +0.1 considered synergistic and values < −0.1 considered antagonistic. For all experiments the probability of p < 0.05 was taken as significant.
Results
Downregulation of PER1 increases SGLT1 expression in enterocytes
Caco-2 cells stably transfected with the two shRNA knockdown vectors shPER1 SeqA and SeqB, each bearing distinct shRNA sequences to PER1, exhibited reduced PER1 expression at 0.49 and 0.51 the level of controls (cells transfected with scrambled shRNA, p=0.027 on ANOVA, Figure 1A and Table 1). PER1 protein expression similarly decreased following knockdown with either shPER1 SeqA or shPER1 SeqB to 0.64 and 0.56 that of controls (p=0.0016 on ANOVA, Figure 1B, Table 1). Coincident with PER1 knockdown, SGLT1 expression in cells transfected with shPER1 SeqA or shPER1 SeqB was 2.6-fold and 3.0-fold that of controls (p=0.0076 on ANOVA, Figure 2A and Table 1). These results indicate that PER1 acts to suppress SGLT1 expression in enterocytes in vitro.
Figure 1.
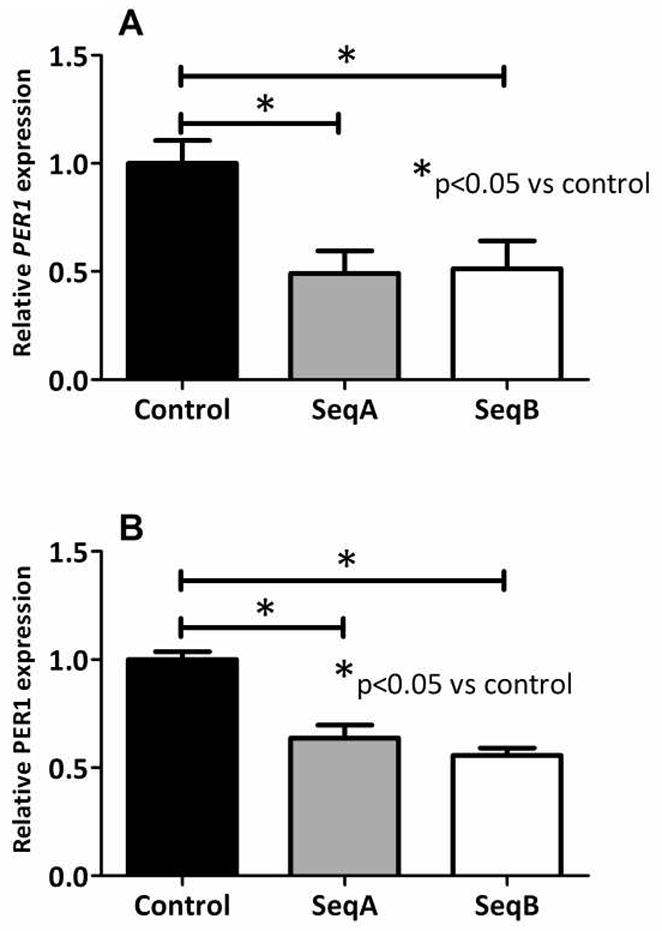
PER1 mRNA (A) and protein expression (B) in Caco-2 cells stably transfected with PER1 knockdown sequences vs the scrambled sequence negative control and harvested at 7 days post-confluence. mRNA expression was measured by qPCR and protein expression via Western blotting. Values are expressed as means ± SEM, normalized to actin and indexed to the negative control (n = 3 per group). Each experiment was performed a total of three times. Significance of variance between the three cell lines (SeqA, SeqB and control) was determined using ANOVA. Significant differences between each knockdown cell line and the control cell line were subsequently identified using post-hoc Tukey analysis.
Table 1.
Relative expression of PER1 mRNA and protein expression and SGLT1 mRNA expression following knockdown of PER1 in Caco-2 cells. Significant differences (p<0.05) between the three cell lines (SeqA, SeqB and control) were identified using one-way ANOVA with post-hoc Tukey.
| Gene/protein | Expression relative to control | p-value on ANOVA | p-value on post-hoc Tukey | |
|---|---|---|---|---|
| PER1 | shPER1 SeqA | 0.49 | 0.0273 | <0.05 |
| shPER1 SeqB | 0.51 | <0.05 | ||
| PER1 | shPER1 SeqA | 0.64 | 0.0016 | <0.01 |
| shPER1 SeqB | 0.55 | <0.01 | ||
| SGLT1 | shPER1 SeqA | 2.65 | 0.0076 | <0.05 |
| shPER1 SeqB | 3.62 | <0.01 | ||
Figure 2.
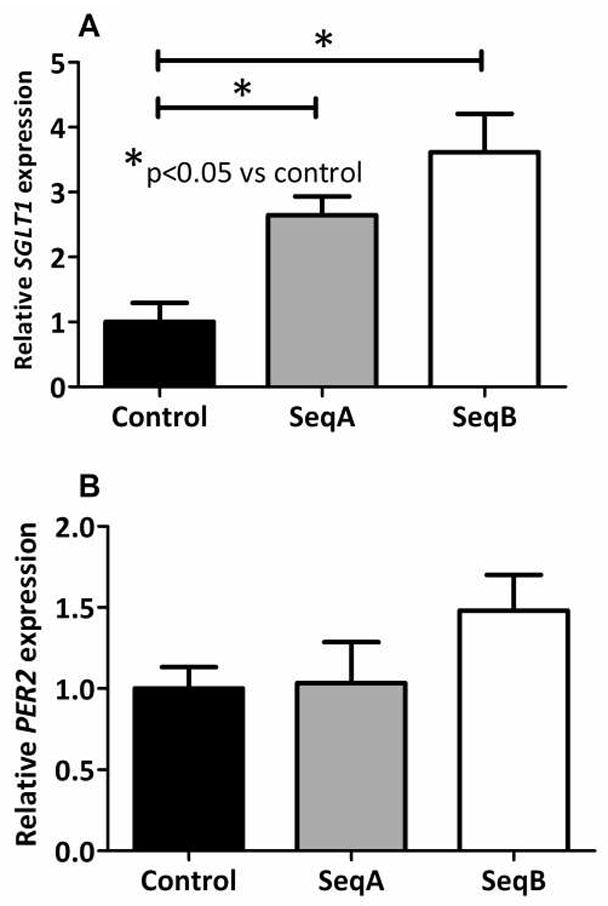
SGLT1 (A) and PER2 (B) mRNA expression following PER1 knockdown in Caco-2 cells stably transfected with knockdown vectors for PER1 or the scrambled sequence negative control, then harvested at 7 days post-confluence. mRNA expression was measured by qPCR. Values are expressed as means ± SEM, normalized to actin and indexed to the negative control (n = 3 per group). The experiment was performed a total of three times. Significance of variance between the three cell lines (SeqA, SeqB and control) was determined using ANOVA. Significant differences between each knockdown cell line and the control cell line were subsequently identified using post-hoc Tukey analysis.
Downregulation of PER1 does not significantly alter expression of other clock genes
There was no significant difference in the expression of PER2 in either of the sequences vs the control vector (p=0.29 on ANOVA, Figure 2B and Table 2). Similarly, none of the remaining clock genes showed a significant alteration in expression following PER1 knockdown. CRY2 showed the greatest change in expression, with levels increased to 1.5-fold and 1.3-fold in shPER1 SeqA and B respectively, however this did not meet statistical significance (p=0.54 on ANOVA, Figure 3F and Table 2). REVERBA showed inconsistent changes with the two knockdown vectors, showing no change in expression with shPER1 SeqA but a decrease in expression with shPER1 SeqB (1.1 fold vs 0.6-fold difference, p=0.054 on ANOVA, Figure 3C and Table 2). Other clock genes were only mildly altered following PER1 knockdown (0.86–1.20-fold vs. control cells, p>0.1, Figures 3A, B, D and E, Table 2).
Table 2.
Relative expression of PER2, BMAL1, CLOCK, REVERBA, REVERBB, CRY1 and CRY2 mRNA expression following knockdown of PER1 in Caco-2 cells. Significant differences (p<0.05) between the three cell lines (SeqA, SeqB and control) were identified using one-way ANOVA with post-hoc Tukey.
| Gene | Expression relative to control | p-value on ANOVA | p-value on post-hoc Tukey | |
|---|---|---|---|---|
| PER2 | shPER1 SeqA | 1.035 | 0.2949 | >0.05 |
| shPER1 SeqB | 1.481 | >0.05 | ||
| BMAL1 | shPER1 SeqA | 0.865 | 0.4811 | >0.05 |
| shPER1 SeqB | 1.067 | >0.05 | ||
| CLOCK | shPER1 SeqA | 0.973 | 0.7474 | >0.05 |
| shPER1 SeqB | 1.200 | >0.05 | ||
| REVERBA | shPER1 SeqA | 0.613 | 0.0535 | >0.05 |
| shPER1 SeqB | 1.117 | >0.05 | ||
| REVERBB | shPER1 SeqA | 0.923 | 0.7009 | >0.05 |
| shPER1 SeqB | 1.109 | >0.05 | ||
| CRY1 | shPER1 SeqA | 1.137 | 0.9443 | >0.05 |
| shPER1 SeqB | 1.108 | >0.05 | ||
| CRY2 | shPER1 SeqA | 1.288 | 0.5386 | >0.05 |
| shPER1 SeqB | 1.462 | >0.05 | ||
Figure 3.
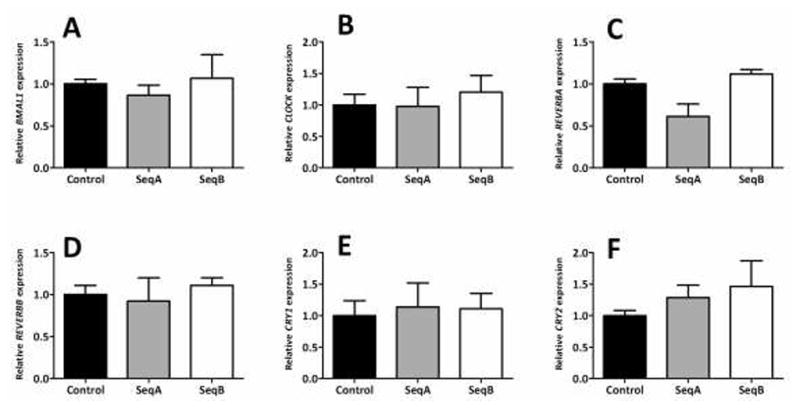
mRNA expression of BMAL1, CLOCK, REVERBA, REVERBB, CRY1 and CRY2 following PER1 knockdown in Caco-2 cells. PER2 expression was measured using qPCR in Caco-2 cells stably transfected with knockdown vectors for PER1 or the scrambled sequence negative control 7 days after reaching confluence. Values are expressed as means ± SEM, normalized to actin and indexed to the negative control (n = 3 per group). Each experiment was performed a total of three times. Significance of variance between the three cell lines (SeqA, SeqB and control) was determined using ANOVA. Significant differences between each knockdown cell line and the control cell line were subsequently identified using post-hoc Tukey analysis.
Analysis of the SGLT1 promoter
The sequence of the human SGLT1 promoter, which has been previously characterized[21], was obtained from the University of California Santa Cruz (UCSC) Genome Browser, freely available at http://genome.ucsc.edu (Figure 4). Analysis of the SGLT1 promoter sequence revealed the presence of 4 non-canonical E-box consensus sequences (CANNTG), two within the proximal minimal promoter at −306 and −352 relative to the transcription start site and two more distal sequences at −827 and −837 (Figure 4).
Figure 4.
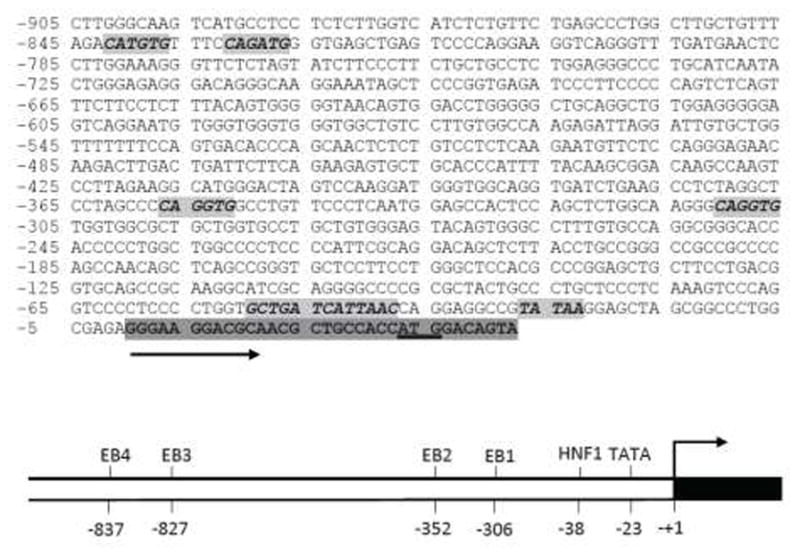
The SGLT1 promoter sequence. The four E-box non-canonical consensus sequences (CANNTG) at −306, −352, −827 and −837 are shown in highlighted in grey. Also shown are the non-canonical HNF sequence (GCTGATCATTAAC) at −50 to −38 and the TATAA site at −28 to −23. The dark grey highlighting and black arrow indicate the SGLT1 transcription start site, with the translation start site (ATG) underlined.
PER1 represses SGLT1 promoter activity in vitro
PER1 overexpression did not alter SGLT1 promoter activity from baseline (0.89-fold vs pcDNA control, p=0.24, Figure 5A, Table 3). In contrast the reduction in PER1 levels concomitant with transfection of PER1 knockdown vectors resulted in increased SGLT1 promoter activity (1.46 and 1.47-fold that of controls with transfection of shPERSeqA and B respectively, p<0.05, Figure 5B and Table 3), suggesting that PER1 suppresses the SGLT1 promoter.
Figure 5.
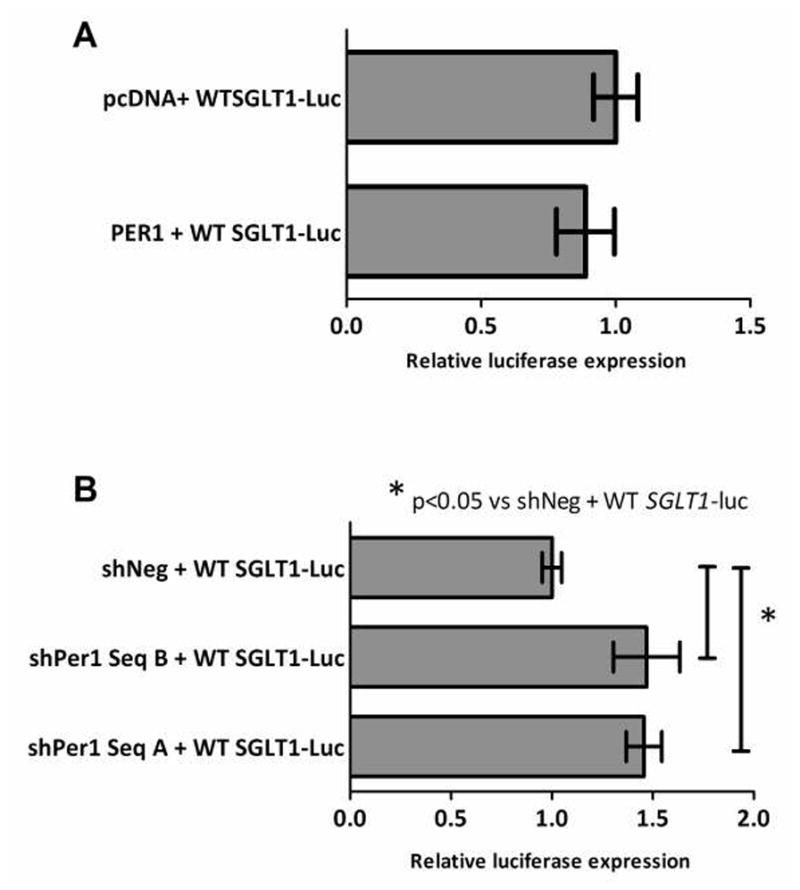
Effect of PER1 overexpression and knockdown on SGLT1 promoter activity. CHO cells were transfected at 80% confluence with combinations of the wild-type SGLT1 promoter reporter construct pGL3/WT-SGLT1luc and (A) either the PER1 expression vector or the pcDNA3.1 empty vector, or (B) shPER1 SeqA and B or the scrambled negative control. Firefly luciferase expression was measured at 48 hours post-transfection as a surrogate measure of SGLT1 promoter activity and normalized to Renilla luciferase to correct for variability in transfection efficiency. Results are expressed as means ± SEM, n = 3 per group, and are representative of 3 individual experiments. Significance of variance between the three cell lines (SeqA, SeqB and control) was determined using ANOVA. Significant differences between each knockdown cell line and the control cell line were subsequently identified using post-hoc Tukey analysis.
Table 3.
Effect of PER1 overexpression and knockdown on SGLT1 promoter activity in CHO cells. Student’s t-test was used to compare promoter activity following overexpression of PER1 versus control and one-way ANOVA to compare effects of knockdown of PER1 versus control.
| Vector combination | Fold change in promoter activity vs. control | p-value | |
|---|---|---|---|
| Expression vector | Reporter vector | ||
| PER1 | WT-SGLT1luc | 0.89 | 0.24 |
| shPER1SeqA | WT-SGLT1luc | 1.46 | <0.05 |
| shPER1SeqB | WT-SGLT1luc | 1.47 | <0.05 |
E-boxes are negative elements in the SGLT1 promoter
Transient transfection of CHO cells with the E-box mutants revealed that promoter activity increased 2.2- and 1.9- fold with mutations in the E-boxes EB1-2, respectively (p<0.0001 on ANOVA and p<0.01, and <0.05 vs. wild-type SGLT1 promoter respectively on post-hoc Tukey, Figure 6, Table 4). Mutation of the most distal two E-boxes EB3 and EB4 had smaller effects which did not meet statistical significance (1.7 and 1.1-fold increase in promoter activity vs. wild-type SGLT1 promoter, p>0.05, Figure 6, Table 4). These data indicate that the two proximal E-boxes have a repressive function on the SGLT1 promoter. Mutant EB4 had a negligible effect on SGLT1 promoter activity and hence was not included in the combinatorial mutants. Mutant EB1 had the strongest effect on the SGLT1 promoter hence mutant EB1 was included in all combinatorial mutants.
Figure 6.
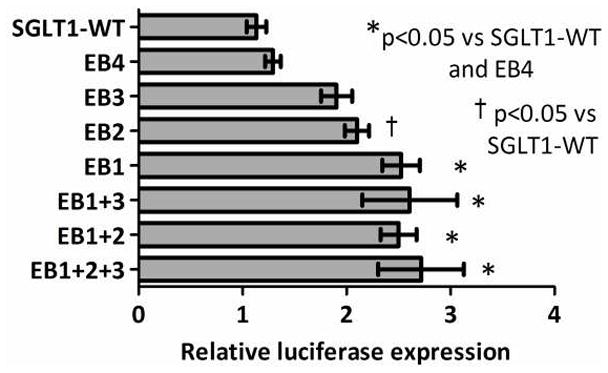
Effect of E-box mutations on SGLT1 promoter activity in CHO cells. E-boxes at −306/−311, −352/−357, −827/−832 and −837/−842 on the SGLT1 promoter were mutated either singly or in combination using site-directed mutagenesis to the NheI site. CHO cells were transfected with either the wild-type SGLT1 promoter or the four E-box mutants (single or combinatorial). Firefly luciferase expression was measured at 48 hours post-transfection as a surrogate measure of SGLT1 promoter activity and normalized to Renilla luciferase to correct for variability in transfection efficiency. Results are expressed as means ± SEM, n = 3 per group, and are representative of 3 individual experiments. Significance of variance between mutants EB1-4 was determined using ANOVA. Significant differences between each mutant and the control were subsequently identified using post-hoc Tukey analysis.
Table 4.
Effect of combinatorial E-box mutations on SGLT1 promoter activity in CHO cells in the absence and presence of PER1 overexpression. One-way ANOVA with post-hoc Tukey was used to identify significant differences between luciferase expression of mutants and the wild-type promoter.
| Expression vector | Single E-box mutant | Fold change vs wild-type promoter | p-value |
|---|---|---|---|
| pcDNA | SGLT1-Luc mutEB1 | 2.23 | <0.01 |
| SGLT1-Luc mutEB2 | 1.85 | <0.05 | |
| SGLT1-Luc mutEB3 | 1.68 | >0.05 | |
| SGLT1-Luc mutEB4 | 1.14 | >0.05 | |
| PER1 | SGLT1-Luc mutEB1 | 1.14 | >0.05 |
| SGLT1-Luc mutEB2 | 1.15 | >0.05 | |
| SGLT1-Luc mutEB3 | 0.87 | >0.05 | |
| SGLT1-Luc mutEB4 | 1.21 | >0.05 |
Mutating E-boxes in combination had a slightly greater effect on SGLT1 promoter activity than individual mutants. Mutant combination EB1+2+3, involving mutations of all three of the most proximal E-boxes, had the strongest effect on SGLT1 promoter activity however this was not statistically significant (2.4-fold the activity of the wild-type SGLT1 promoter, p<0.001, Figure 6, Table 5). Mutant combination EB1+3 had a smaller but significant effect on SGLT1 promoter activity (2.3-fold the activity of the wild-type SGLT1 promoter, p<0.01, Figure 6, Table 5). Mutant combination EB1+2 had the smallest effect on SGLT1 promoter activity, inducing a 2.2-fold increase in luciferase activity compared to the wild-type SGLT1 promoter, this was also statistically significant (p<0.01, Figure 6, Table 5).
Table 5.
Effect of E-box mutations on SGLT1 promoter activity in CHO cells in the presence and absence of PER1 overexpression. One-way ANOVA with post-hoc Tukey was used to identify significant differences between luciferase expression of mutants and the wild-type promoter.
| Expression vector | Combinatorial mutant | Fold-change relative to wild-type promoter | p-value | Interaction response | Effect |
|---|---|---|---|---|---|
| pcDNA | SGLT1-Luc mutEB1+2 | 2.20 | <0.01 | −0.267 | Antagonistic |
| SGLT1-Luc mutEB1+3 | 2.30 | <0.01 | −0.230 | Antagonistic | |
| SGLT1-Luc mutEB1+2+3 | 2.40 | <0.001 | −0.381 | Antagonistic | |
| PER1 | SGLT1-Luc mutEB1+2 | 1.23 | >0.05 | −0.270 | Antagonistic |
| SGLT1-Luc mutEB1+3 | 1.38 | >0.05 | −0.162 | Antagonistic | |
| SGLT1-Luc mutEB1+2+3 | 1.51 | <0.05 | −0.322 | Antagonistic |
Although each mutant combination led to a greater than 2-fold increase in activity over wild-type, the interaction between the individual E-boxes as determined by the interaction response was antagonistic in all cases (interaction response <−0.1). This shows that the effect of mutating these E-boxes in combination is less than the sum of effects of each individual mutant. These findings suggest that the E-boxes on the SGLT1 promoter do not act cooperatively and that each E-box suppresses promoter activity independently.
Repression of SGLT1 promoter activity by PER1 occurs despite mutation of E-boxes
Mutation of E-boxes increased SGLT1 promoter activity in the absence of exogenous transcription factors as shown above (Figure 6 and Tables 4 and 5). PER1 was shown earlier in our studies to suppress SGLT1 promoter activity. If E-boxes mediated this suppression, transfection of PER1 overexpression vectors would not be expected to alter the increase in SGLT1 promoter activity induced by mutation of the E-boxes. In contrast, PER1 overexpression reduced activities of mutated promoters mutEB1, mutEB2, mutEB3 and mutEB4 such that there was no significant difference to luciferase activity of the unmutated wildtype SGLT1 promoter (1.1-fold, 1.1-fold, 0.9-fold and 1.2-fold luciferase activity of the wildtype promoter, p=0.0019 on one-way ANOVA and >0.05 on post-hoc Tukey analysis, Figure 7, Table 4).
Figure 7.
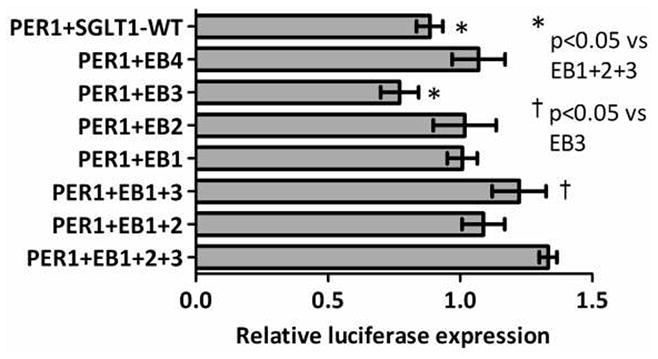
Effect of PER1 on the SGLT1 promoter bearing E-box mutations in CHO cells. E-boxes at −306/−311, −352/−357, −827/−832 and −837/−842 on the SGLT1 promoter were mutated either singly or in combination using site-directed mutagenesis to the NheI site. CHO cells were transfected with the PER1 overexpression vector and either the wild-type SGLT1 promoter or the four E-box mutants (single or combinatorial). Firefly luciferase expression was measured at 48 hours post-transfection as a surrogate measure of SGLT1 promoter activity and normalized to Renilla luciferase to correct for variability in transfection efficiency. Results are expressed as means ± SEM, n = 3 per group, and are representative of 3 individual experiments. Significance of variance between mutants EB1-4 was determined using ANOVA. Significant differences between each mutant and the control were subsequently identified using post-hoc Tukey analysis.
The three combination mutants (mutEB1+2, EB1+3 and EB1+2+3) were similarly inhibited by PER1 overexpression. Combinatorial mutation of the 3 proximal E-boxes in the SGLT1 promoter resulted in increased levels of luciferase activity compared to the wildtype SGLT1 promoter. The interaction of all three E-box mutations in the presence of PER1 was antagonistic (Figure 7, Table 5). This shows that the effect of PER1 on the SGLT1 promoter containing E- boxes mutated in combination is less than the sum of effects of PER1 on each individual mutant.
To analyse the relationship between PER1 activity on the SGLT1 promoter and E-box status a two-way ANOVA with Bonferroni post-tests was performed (Figure 8). The analysis showed a significant interaction between PER1 activity and E-box mutation (p<0.0001). In addition, PER1 continued to suppress SGLT1 promoter activity despite single mutations of EB1-3 or combinatorial mutation of EB1+2, 1+3 or 1+2+3 (p<0.001 vs pcDNA, Figure 8), indicating that the effects of PER1 on the SGLT1 promoter are independent of the status of E-boxes 1–3. PER1 had no effect on the SGLT1 promoter compared to pcDNA upon mutation of EB4 (p>0.05, Figure 8), however this mutation did not appear to significantly alter SGLT1 promoter activity on one-way ANOVA in the absence of PER1 (p>0.05, Figure 6), suggesting that the EB4 binding site does not contribute to SGLT1 promoter activity.
Figure 8.
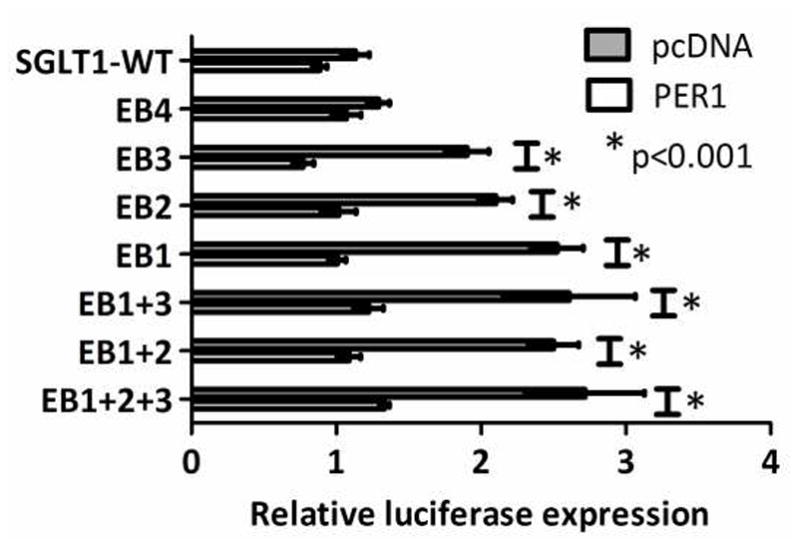
Effect of PER1 vs pcDNA on the SGLT1 promoter bearing E-box mutations in CHO cells. The data shown in Figures 4.10 and 4.11 have been juxtaposed to allow comparison of the effects of PER1 on the wild-type and mutated SGLT1 promoter. E-boxes at −306/−311, −352/−357, −827/−832 and −837/−842 on the SGLT1 promoter were mutated either singly or in combination using site-directed mutagenesis to the NheI site. CHO cells were transfected with the PER1 overexpression vector and either the wild-type SGLT1 promoter or the four E-box mutants (single or combinatorial). Renilla luciferase was used to normalize for transfection efficiency. Firefly and Renilla luciferase activity were measured after 48 hours. All experiments were performed three times. Graphs show mean and standard error. Two-way ANOVA with Bonferroni post-tests was used to identify any interaction between the effects of PER1 and mutation of E-boxes on the SGLT1 promoter.
Discussion
Our data show for the first time an effect of clock genes on SGLT1 in vitro. Knockdown of PER1 increased native SGLT1 expression in Caco-2 enterocytes, while promoter studies confirmed that the inhibitory activity of PER1 on SGLT1 occurs via the proximal 1kb of the SGLT1 promoter. E-box sites exerted a suppressive effect on the SGLT1 promoter, however mutation of E-boxes had little effect on the inhibitory activity of PER1 on the SGLT1 promoter suggesting that the actions of PER1 on SGLT1 are independent of E-boxes EB1-3. Overall the above findings suggest that PER1 exerts an indirect suppressive effect on SGLT1, possibly acting via other clock-controlled genes binding to non-E-box sites on the SGLT1 promoter (Figure 9).
Figure 9.
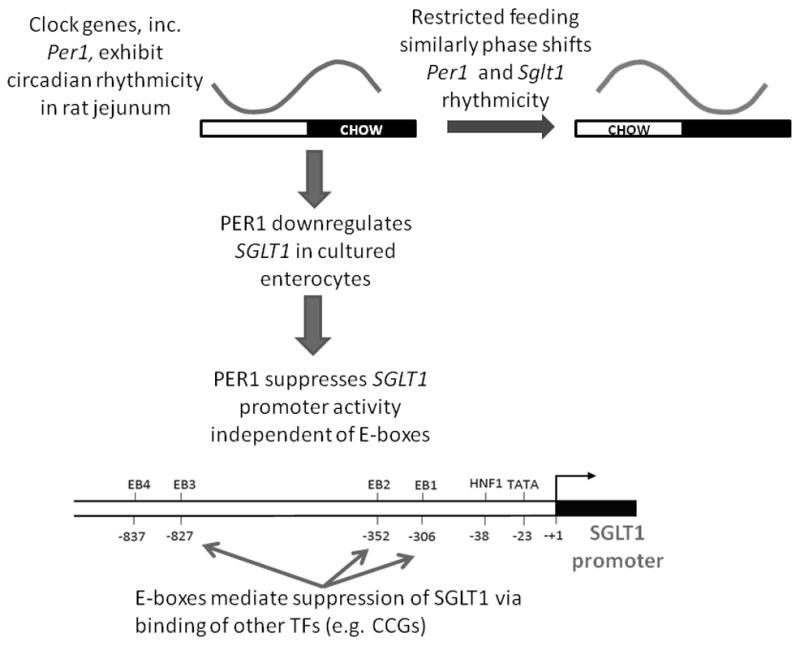
Clock-gene mediated regulation of SGLT1. Per1 exhibits circadian rhythmicity in rat jejunum and is phase-shifted similarly upon restricted feeding. Knockdown of PER1 upregulates SGLT1 expression in Caco-2 cells while reporter assays demonstrate suppression of SGLT1 expression by PER1. E-boxes also suppress SGLT1 expression independent of PER1 and possibly by other transcription factors such as other clock-controlled genes.
Knockdown of PER1 in Caco-2 cells by two independent shRNAs increased SGLT1 expression; of particular interest, the lack of major changes in other clock genes following PER1 knockdown suggests that the effect is mediated by PER1 itself or indirectly via a non-clock PER1 target. The absence of a significant effect of PER1 knockdown on other clock genes noted in this study is in contrast to previous studies showing decreased expression of Bmal1, Clock, Per2 and Cry1 in the peripheral tissues of PER1−/− mice, indicating that PER1 regulates other clock genes at a transcriptional level in peripheral tissues[23]. While it would be interesting to determine the effects of each of the other clock genes on SGLT1 those studies are beyond the scope of this paper. It is worth noting that in the SCN of PER1−/− mice however the effect of PER1 knockdown on other clock genes is only seen at a translational and not at a transcriptional level[24,25], suggesting that PER1 may play different roles in clock gene molecular feedback loops in the peripheral clock versus the SCN. Other possible alternatives may explain the lack of effect of PER1 knockdown on the expression of other clock genes in Caco-2 cells; for instance, the lack of synchronization in cultured Caco-2 cells may have dampened interactions of PER1 with other clock genes. Synchronized cells in culture (for example with a serum shock) are known to exhibit circadian oscillations in clock gene expression[26]. Synchronization of Caco-2 cells was not possible as the protocol for synchronization requires non-confluent rapidly growing cells; in contrast the expression of SGLT1 by Caco-2 cells only occurs in the confluent state upon which Caco-2 cells differentiate into a small-bowel enterocytic phenotype[20]. Confluence is associated with reduced growth and proliferation rate and the attendant reduction in cell turnover and metabolism suggests that confluent cells may thus be less responsive to expression changes of clock components. Alternatively, the extent of PER1 knockdown in this study may have been insufficient to modulate expression of other clock genes. Regardless, these findings demonstrate that reducing PER1 expression alone is sufficient to increase SGLT1 expression in enterocytes without requiring cooperation of other clock genes.
The increase in SGLT1 promoter activity following PER1 knockdown in CHO cells suggests that the suppressive effects of PER1 on SGLT1 transcription in Caco-2 cells are mediated at least in part by effects on the SGLT1 promoter. Surprisingly, overexpression of PER1 did not induce a significant decrease of SGLT1 promoter activity in CHO cells as would be expected. CHO cells are not an enterocytic cell line and the inability of PER1 overexpression to decrease SGLT1 transcription may be due to the already low basal SGLT1 promoter activity in these cells[21]. Promoter studies using the SGLT1 promoter construct in an enterocytic cell line such as Caco-2 may have added some insights into the contribution of other innate intestinal transcription factors in cooperative regulation of the SGLT1 promoter with PER1, however the low transfection efficiency of Caco-2 cells made transient transfections for promoter studies impractical. Our studies nevertheless provide valuable data showing that clock genes, specifically PER1, are able to exert an effect on the SGLT1 promoter even in the absence of other known SGLT1 transcriptional modulators.
Our results establish a suppressive effect of E-boxes on SGLT1, an observation which is not without precedent. E-boxes have been shown to mediate hormonal suppression of the luteinizing hormone (LH) promoter in vitro[27], and contribute to the regulation of the fatty acid synthase (FAS) promoter in vivo[28]. Of greater interest, the circadian Na+/H+ exchanger NHE3 in the kidney, a transporter like SGLT1, has also been shown to bear an E-box on its promoter[7]. Binding of the CLOCK-BMAL1 complex to this E-box has been shown to activate transcriptional activity of NHE3, while transfection of PER2 or CRY1 was able to suppress or abolish this transactivation respectively[7].
Our data showed a greater effect of the proximal E-boxes on the SGLT1 promoter than the distal E-boxes. Similar to our findings, other studies have also shown that E-boxes more proximal to the transcription start site were of greater functional relevance for gene transcription[29]. In particular, a recent study by Iwashina et al demonstrated diurnal rhythmicity of the binding of BMAL1 to regions at −400 and +0 relative to the SGLT1 transcription start site in mice, highlighting a role for the importance of the proximal promoter region[30]. Functionality of BMAL1 on the E-boxes was not specifically assesed in their study and remains to be determined[30].
Individual E-box sequences were able to suppress the SGLT1 promoter in our study; however SGLT1 promoter activity upon mutating 2 or more E-boxes in combination was less than would have been expected from the sum of each of the individual effects, suggesting that these E-boxes do not act cooperatively in regulating the SGLT1 transcription. Cooperative activity of E-boxes has, however, been demonstrated for other genes. The two most proximal adjacent E-boxes on the rat acetylcholine receptor β (AChRβ) promoter have been shown to be necessary for transcriptional regulation of this gene[29]. Both of these E-boxes were shown to be necessary for stimulation of transcriptional activity of the AChRβ promoter; mutation of individual E-boxes did not exert any significant effect on promoter activity[29]. Combinatorial effects of E-boxes were also noted by Lenka et al on the rat COX VIII gene[31] and by Oishi et al on the PPAR-α promoter[32]. The lack of cooperativity of E-boxes in our study may have been due to the distance of 40bp between the 2 most proximal E-boxes on the SGLT1 promoter; in contrast in previous studies cooperative E-boxes have often been immediately adjacent to each other[29]. The degree of cooperativity of E-boxes on a promoter may be a reflection of a conformational change upon binding of the transcription factor to one of the E-box sites thereby facilitating binding to the other E-box site.
The observation that PER1 continued to suppress the activities of SGLT1 promoters constructs despite mutations in any or several of its E-boxes indicates that PER1 suppression is independent of E-boxes. These findings demonstrate that PER1 and E-boxes are both able to suppress SGLT1 promoter activity but via independent mechanisms. The lack of effect of E-box mutation on PER1 activity in our studies suggests that PER1 may regulate SGLT1 via non-E-box binding transcription factors such as clock-controlled genes. The clock controlled gene albumin D-box binding protein (DBP) has been shown to regulate other intestinal transporters by binding not to E-boxes but to its own canonical consensus sequence of GTTACGAAAC[8]. Other clock-controlled genes such as DEC1 and DEC2 are known to bind to and suppress E-boxes in the promoters of other genes[33] and may similarly be binding to E-boxes to regulate SGLT1 transcription. DEC1 is known to be expressed in the intestine[34]; however the expression of DEC2 and the temporal expression profile of DEC1 and DEC2 in the intestine remain unknown.
A further possibility for the indirect regulation of SGLT1 by PER1 is the involvement of non-clock genes such as intestinal transcription factors hepatocyte nuclear factor (HNF1), HNF1, GATA binding protein (GATA) factors or caudal-type homeobox protein 2 (CDX2). Rhoads et al demonstrated differential binding of the HNF1β to the rat Sglt1 promoter, with increased levels of binding occurring during the daylight hours than the hours of darkness in the evening. In contrast HNF1α showed no circadian pattern of binding to the Sglt1 promoter[35]. HNF1 and GATA factors and CDX2 have binding sites on the SGLT1 promoter and have previously been shown to regulate activity of the human SGLT1 promoter [36]. PER1 may act on the SGLT1 promoter in cooperation with one of more of these transcription factors, acting via binding sites for these factors on the SGLT1 promoter. Further studies using EMSAs are currently ongoing in our laboratory to not only confirm binding of PER1 to the SGLT1 promoter, but also to identify the other transcription factors which may be acting in cooperation with PER1 to regulate SGLT1 transcription.
Knockout mice have proved useful in deciphering the role of PER1 in circadian rhythmicity. Zheng et al[24] showed reduced stability and precision of circadian behavioural rhythms in mice with loss of functional PER1 expression. Circadian behavioural patterns of mPer1−/− and mPer2 −/− mice became gradually arrhythmic upon removal from the 12:12 light dark cycle and introduction into constant darkness, however the duration to onset and extent of rhythm persistence in both groups of knockout mice was variable[25]. In contrast, double mutant mPer1−/− mPer2−/− knockout mice had an abrupt immediate loss of rhythmicity upon transfer to constant darkness[25], leading the authors to suggest that PER1 and PER2 played similar but redundant roles in the molecular clock. Another study showed that knockout of PER1 in mice resulted in a delayed peak in PER1 expression in peripheral tissues (kidney, heart and skeletal muscle)[37]. These findings led the authors to propose that PER1 may be specifically involved in modulation of physiological rhythmicity of the peripheral clock[37]. Although enterocyte gene expression in these knockout mice has yet to be examined, a recent study identified loss of rhythmicity of colonic motility in mPer1−/− mPer2−/− double knockout mice but persistent rhythmicity in individual mPer1−/− or mPer2−/− mice[38].
Knockout mice are likely to be invaluable in investigating the role of PER1 in mediating circadian rhythmicity of SGLT1 expression in the intestine and in deciphering the effect of selective loss of PER1 expression on the expression of other clock genes in the intestine. Our in vitro findings suggest that loss of PER1 in vivo would be expected to result in increased baseline SGLT1 expression with possible loss of circadian rhythmicity, while expression of other clock genes remained unchanged. Analysis of clock gene and SGLT1 expression in the intestines of PER1 knockout mice would allow confirmation of this proposal.
In summary, our data show a suppressive role for the clock gene PER1 on SGLT1 expression in enterocytes. These effects are likely to be mediated by the SGLT1 promoter however are independent of E-box sites, which also have a suppressive effect on the SGLT1 promoter. It seems likely that PER1 may be acting via other clock-controlled genes binding to non-E-box sites on the SGLT1 promoter, while E-box sites mediate the effects of other genes on SGLT1 transcription. While the suppressive effect of PER1 on SGLT1 is clear, further studies are required to characterize the molecular pathways and the exact genes involved in the regulation of circadian rhythmicity of SGLT1 transcription. Understanding the regulation of rhythmicity of SGLT1 may lead to new treatments for the modulation of SGLT1 expression in conditions such as malabsorption, diabetes and obesity.
Supplementary Material
Acknowledgments
Grant support:
NIH - 5 R01 DK047326 (SWA), ADA - 7-05-RA-121 (DBR), Harvard Clinical Nutrition Research Center - P30-DK040561 (AT), Nutricia Research Foundation (AB) and Berkeley Fellowship (ATS).
Abbreviations
- Bmal1
brain muscle Arnt-like 1
- Cry
cryptochrome
- Mdr1
multidrug resistance 1
- mRNA
messenger ribonucleic acid
- Nhe3
Na+/H+ exchanger
- Per
period
- PVDF
polyvinylidenefluoride
- SGLT1
sodium glucose cotransporter 1
Footnotes
Disclosures:
All authors confirm no conflicts of interest.
Copyright licence statement:
The authors attest that this manuscript is not currently under consideration by any other journal.
Author contributions to manuscript:
AB, SWA, DBR and AT designed the studies; AB and ATS conducted the research; AB analyzed the data; AB, DBR and AT wrote the paper. All authors read and approved the final manuscript.
References
- 1.Balakrishnan A, Stearns AT, Rounds J, et al. Diurnal rhythmicity in glucose uptake is mediated by temporal periodicity in the expression of the sodium-glucose cotransporter (sglt1) Surgery. 2008;143:813–818. doi: 10.1016/j.surg.2008.03.018. [DOI] [PMC free article] [PubMed] [Google Scholar]
- 2.Hediger MA, Coady MJ, Ikeda TS, Wright EM. Expression cloning and cdna sequencing of the na+/glucose co-transporter. Nature. 1987;330:379–381. doi: 10.1038/330379a0. [DOI] [PubMed] [Google Scholar]
- 3.Wright EM, Martin MG, Turk E. Intestinal absorption in health and disease--sugars. Best practice & research. 2003;17:943–956. doi: 10.1016/s1521-6918(03)00107-0. [DOI] [PubMed] [Google Scholar]
- 4.Tavakkolizadeh A, Berger UV, Shen KR, et al. Diurnal rhythmicity in intestinal sglt-1 function, v(max), and mrna expression topography. Am J Physiol Gastrointest Liver Physiol. 2001;280:G209–215. doi: 10.1152/ajpgi.2001.280.2.G209. [DOI] [PubMed] [Google Scholar]
- 5.Richards AM, Nicholls MG, Espiner EA, et al. Diurnal patterns of blood pressure, heart rate and vasoactive hormones in normal man. Clin Exp Hypertens A. 1986;8:153–166. doi: 10.3109/10641968609074769. [DOI] [PubMed] [Google Scholar]
- 6.Selmaoui B, Touitou Y. Reproducibility of the circadian rhythms of serum cortisol and melatonin in healthy subjects: A study of three different 24-h cycles over six weeks. Life Sci. 2003;73:3339–3349. doi: 10.1016/j.lfs.2003.05.007. [DOI] [PubMed] [Google Scholar]
- 7.Rohman SM, Emoto N, Nonaka H, Okura R, Nishimura M, Yagita K, van der Horst GT, Matsuo M, Okamura H, Yokoyama M. Circadian clock genes directly regulate expression of the na(+)/h(+) exchanger nhe3 in the kidne. Kidney International. 2005;67:1410–1419. doi: 10.1111/j.1523-1755.2005.00218.x. [DOI] [PubMed] [Google Scholar]
- 8.Saito H, Terada T, Shimakura J, Katsura T, Inui K. Regulatory mechanism governing the diurnal rhythm of intestinal h+/peptide cotransporter 1 (pept1) Am J Physiol Gastrointest Liver Physiol. 2008;295:G395–402. doi: 10.1152/ajpgi.90317.2008. [DOI] [PubMed] [Google Scholar]
- 9.Murakami Y, Higashi Y, Matsunaga N, Koyanagi S, Ohdo S. Circadian clock-controlled intestinal expression of the multidrug-resistance gene mdr1a in mice. Gastroenterology. 2008;135:1636–1644. e1633. doi: 10.1053/j.gastro.2008.07.073. [DOI] [PubMed] [Google Scholar]
- 10.Hastings MH. Circadian clocks. Curr Biol. 1997;7:R670–672. doi: 10.1016/s0960-9822(06)00350-2. [DOI] [PubMed] [Google Scholar]
- 11.Panda S, Hogenesch JB. It’s all in the timing: Many clocks, many outputs. J Biol Rhythms. 2004;19:374–387. doi: 10.1177/0748730404269008. [DOI] [PubMed] [Google Scholar]
- 12.Reppert SM, Weaver DR. Coordination of circadian timing in mammals. Nature. 2002;418:935–941. doi: 10.1038/nature00965. [DOI] [PubMed] [Google Scholar]
- 13.Torra IP, Tsibulsky V, Delaunay F, et al. Circadian and glucocorticoid regulation of rev-erbalpha expression in liver. Endocrinology. 2000;141:3799–3806. doi: 10.1210/endo.141.10.7708. [DOI] [PubMed] [Google Scholar]
- 14.Preitner N, Damiola F, Lopez-Molina L, et al. The orphan nuclear receptor rev-erbalpha controls circadian transcription within the positive limb of the mammalian circadian oscillator. Cell. 2002;110:251–260. doi: 10.1016/s0092-8674(02)00825-5. [DOI] [PubMed] [Google Scholar]
- 15.Oishi K, Sakamoto K, Okada T, Nagase T, Ishida N. Humoral signals mediate the circadian expression of rat period homologue (rper2) mrna in peripheral tissues. Neuroscience letters. 1998;256:117–119. doi: 10.1016/s0304-3940(98)00765-4. [DOI] [PubMed] [Google Scholar]
- 16.Oishi K, Sakamoto K, Okada T, Nagase T, Ishida N. Antiphase circadian expression between bmal1 and period homologue mrna in the suprachiasmatic nucleus and peripheral tissues of rats. Biochem Biophys Res Commun. 1998;253:199–203. doi: 10.1006/bbrc.1998.9779. [DOI] [PubMed] [Google Scholar]
- 17.Takata M, Burioka N, Ohdo S, et al. Daily expression of mrnas for the mammalian clock genes per2 and clock in mouse suprachiasmatic nuclei and liver and human peripheral blood mononuclear cells. Jpn J Pharmacol. 2002;90:263–269. doi: 10.1254/jjp.90.263. [DOI] [PubMed] [Google Scholar]
- 18.Sakamoto K, Oishi K, Nagase T, Miyazaki K, Ishida N. Circadian expression of clock genes during ontogeny in the rat heart. Neuroreport. 2002;13:1239–1242. doi: 10.1097/00001756-200207190-00003. [DOI] [PubMed] [Google Scholar]
- 19.Balakrishnan A, Stearns AT, Ashley SW, Tavakkolizadeh A, Rhoads DB. Restricted feeding phase shifts clock gene and sodium glucose cotransporter 1 (sglt1) expression in rats. J Nutr. 2010;140:908–914. doi: 10.3945/jn.109.116749. [DOI] [PMC free article] [PubMed] [Google Scholar]
- 20.Blais A, Bissonnette P, Berteloot A. Common characteristics for na+-dependent sugar transport in caco-2 cells and human fetal colon. The Journal of membrane biology. 1987;99:113–125. doi: 10.1007/BF01871231. [DOI] [PubMed] [Google Scholar]
- 21.Martin MG, Wang J, Solorzano-Vargas RS, et al. Regulation of the human na(+)-glucose cotransporter gene, sglt1, by hnf-1 and sp1. Am J Physiol Gastrointest Liver Physiol. 2000;278:G591–603. doi: 10.1152/ajpgi.2000.278.4.G591. [DOI] [PubMed] [Google Scholar]
- 22.Krasinski SD, Van Wering HM, Tannemaat MR, Grand RJ. Differential activation of intestinal gene promoters: Functional interactions between gata-5 and hnf-1 alpha. Am J Physiol Gastrointest Liver Physiol. 2001;281:G69–84. doi: 10.1152/ajpgi.2001.281.1.G69. [DOI] [PubMed] [Google Scholar]
- 23.Fu L, Patel MS, Bradley A, Wagner EF, Karsenty G. The molecular clock mediates leptin-regulated bone formation. Cell. 2005;122:803–815. doi: 10.1016/j.cell.2005.06.028. [DOI] [PubMed] [Google Scholar]
- 24.Zheng B, Albrecht U, Kaasik K, et al. Nonredundant roles of the mper1 and mper2 genes in the mammalian circadian clock. Cell. 2001;105:683–694. doi: 10.1016/s0092-8674(01)00380-4. [DOI] [PubMed] [Google Scholar]
- 25.Bae K, Jin X, Maywood ES, et al. Differential functions of mper1, mper2, and mper3 in the scn circadian clock. Neuron. 2001;30:525–536. doi: 10.1016/s0896-6273(01)00302-6. [DOI] [PubMed] [Google Scholar]
- 26.Balsalobre A, Damiola F, Schibler U. A serum shock induces circadian gene expression in mammalian tissue culture cells. Cell. 1998;93:929–937. doi: 10.1016/s0092-8674(00)81199-x. [DOI] [PubMed] [Google Scholar]
- 27.Kowase T, Walsh HE, Darling DS, Shupnik MA. Estrogen enhances gonadotropin-releasing hormone-stimulated transcription of the luteinizing hormone subunit promoters via altered expression of stimulatory and suppressive transcription factors. Endocrinology. 2007;148:6083–6091. doi: 10.1210/en.2007-0407. [DOI] [PubMed] [Google Scholar]
- 28.Moon YS, Latasa MJ, Griffin MJ, Sul HS. Suppression of fatty acid synthase promoter by polyunsaturated fatty acids. Journal of lipid research. 2002;43:691–698. [PubMed] [Google Scholar]
- 29.Berberich C, Durr I, Koenen M, Witzemann V. Two adjacent e box elements and a m-cat box are involved in the muscle-specific regulation of the rat acetylcholine receptor beta subunit gene. European journal of biochemistry/FEBS. 1993;216:395–404. doi: 10.1111/j.1432-1033.1993.tb18157.x. [DOI] [PubMed] [Google Scholar]
- 30.Iwashina I, Mochizuki K, Inamochi Y, Goda T. Clock genes regulate the feeding schedule-dependent diurnal rhythm changes in hexose transporter gene expressions through the binding of bmal1 to the promoter/enhancer and transcribed regions. The Journal of nutritional biochemistry. 22:334–343. doi: 10.1016/j.jnutbio.2010.02.012. [DOI] [PubMed] [Google Scholar]
- 31.Lenka N, Basu A, Mullick J, Avadhani NG. The role of an e box binding basic helix loop helix protein in the cardiac muscle-specific expression of the rat cytochrome oxidase subunit viii gene. J Biol Chem. 1996;271:30281–30289. doi: 10.1074/jbc.271.47.30281. [DOI] [PubMed] [Google Scholar]
- 32.Oishi K, Shirai H, Ishida N. Clock is involved in the circadian transactivation of peroxisome-proliferator-activated receptor alpha (pparalpha) in mice. The Biochemical journal. 2005;386:575–581. doi: 10.1042/BJ20041150. [DOI] [PMC free article] [PubMed] [Google Scholar]
- 33.Nakashima A, Kawamoto T, Honda KK, et al. Dec1 modulates the circadian phase of clock gene expression. Molecular and cellular biology. 2008;28:4080–4092. doi: 10.1128/MCB.02168-07. [DOI] [PMC free article] [PubMed] [Google Scholar]
- 34.Shen M, Kawamoto T, Yan W, et al. Molecular characterization of the novel basic helix-loop-helix protein dec1 expressed in differentiated human embryo chondrocytes. Biochemical and biophysical research communications. 1997;236:294–298. doi: 10.1006/bbrc.1997.6960. [DOI] [PubMed] [Google Scholar]
- 35.Rhoads DB, Rosenbaum DH, Unsal H, Isselbacher KJ, Levitsky LL. Circadian periodicity of intestinal na+/glucose cotransporter 1 mrna levels is transcriptionally regulated. J Biol Chem. 1998;273:9510–9516. doi: 10.1074/jbc.273.16.9510. [DOI] [PubMed] [Google Scholar]
- 36.Balakrishnan A, Stearns AT, Rhoads DB, Ashley SW, Tavakkolizadeh A. Defining the transcriptional regulation of the intestinal sodium-glucose cotransporter using rna-interference mediated gene silencing. Surgery. 2008;144:168–173. doi: 10.1016/j.surg.2008.03.010. [DOI] [PMC free article] [PubMed] [Google Scholar]
- 37.Cermakian N, Monaco L, Pando MP, Dierich A, Sassone-Corsi P. Altered behavioral rhythms and clock gene expression in mice with a targeted mutation in the period1 gene. The EMBO journal. 2001;20:3967–3974. doi: 10.1093/emboj/20.15.3967. [DOI] [PMC free article] [PubMed] [Google Scholar]
- 38.Hoogerwerf WA, Shahinian VB, Cornelissen G, et al. Rhythmic changes in colonic motility are regulated by period genes. Am J Physiol Gastrointest Liver Physiol. 298:G143–150. doi: 10.1152/ajpgi.00402.2009. [DOI] [PMC free article] [PubMed] [Google Scholar]
Associated Data
This section collects any data citations, data availability statements, or supplementary materials included in this article.