

Abstract
Ankyloblepharon-ectodermal defects-cleft lip/palate (AEC) syndrome, which is characterized by cleft palate and severe defects of the skin, is an autosomal dominant disorder caused by mutations in the gene encoding transcription factor p63. Here, we report the generation of a knock-in mouse model for AEC syndrome (p63+/L514F) that recapitulates the human disorder. The AEC mutation exerts a selective dominant-negative function on wild-type p63 by affecting progenitor cell expansion during ectodermal development leading to a defective epidermal stem cell compartment. These phenotypes are associated with impairment of fibroblast growth factor (FGF) signalling resulting from reduced expression of Fgfr2 and Fgfr3, direct p63 target genes. In parallel, a defective stem cell compartment is observed in humans affected by AEC syndrome and in Fgfr2b−/− mice. Restoring Fgfr2b expression in p63+/L514F epithelial cells by treatment with FGF7 reactivates downstream mitogen-activated protein kinase signalling and cell proliferation. These findings establish a functional link between FGF signalling and p63 in the expansion of epithelial progenitor cells and provide mechanistic insights into the pathogenesis of AEC syndrome.
Keywords: AEC syndrome, epidermis, FGF signalling, p63 knock-in, p63 target genes
→See accompanying article http://dx.doi.org/10.1002/emmm.201100202
INTRODUCTION
The p63 gene encodes a tetrameric transcription factor belonging to the p53 family, which has an essential function in the formation of stratified epithelia. p63 expression is driven by two independent promoters generating TA and ΔN classes of proteins, each producing α, β or γ ends as the result of alternative splicing events towards the C-terminal region. The C-terminal end of the α isoform contains a sterile-alpha-motif (SAM) domain and a transactivation inhibitory domain, which are present in p63 and in p73 but absent from p53 (Yang et al, 1998). p63 is expressed most abundantly in the basal regenerative layers of stratified epithelia, where ΔNp63α, that can function either as an activator or a repressor, is the predominant isoform (Koster et al, 2007; Leboeuf et al, 2011).
Mice lacking the p63 gene die soon after birth with severe defects of all stratified epithelia and their derivatives, facial clefting and impaired limb formation (Mills et al, 1999; Yang et al, 1999). Genome-wide profiling of p63 binding regions and gene expression analyses have revealed that p63 directly regulates a large number of genes (Della Gatta et al, 2008; Kouwenhoven et al, 2010; Vigano et al, 2006; Yang et al, 2006). p63 is critical for a number of cellular and developmental processes in stratified epithelia, which include promoting cell proliferation (Antonini et al, 2010; Senoo et al, 2007; Truong et al, 2006), cell adhesion (Carroll et al, 2006; Koster et al, 2007) and stratification (Koster et al, 2004; Truong et al, 2006), while at the same time suppressing terminal differentiation (Nguyen et al, 2006). In addition, p63 is required, at least in vitro, for the proliferative potential of self-renewing populations of corneal and epidermal stem cells (Rama et al, 2010; Senoo et al, 2007) and in vivo for thymic epithelial cells (Senoo et al, 2007).
At least five human malformation syndromes resulting from heterozygous mutations in p63 exhibit phenotypes that are reminiscent of those displayed by p63−/− mice although they are less severe. Ankyloblepharon-ectodermal defects-cleft lip/palate (AEC) syndrome (or Hay–Wells syndrome; OMIM 106260) is caused by mutations clustered mostly in the SAM domain. AEC syndrome differs from other conditions resulting from p63 mutations, in the severity of the skin phenotype, the occurrence of ankyloblepharon and the absence of ectrodactyly (Dishop et al, 2009; McGrath et al, 2001). Dermatological features include mild atrophy, often associated with congenital erythroderma, widespread skin erosions at or soon after birth and ectodermal dysplasia (Dishop et al, 2009; Fete et al, 2009; Julapalli et al, 2009).
Investigation of the pathogenesis of AEC syndrome has been hampered by the lack of an animal model closely resembling the human disorder. To this aim, we generated the p63+/L514F mouse, a faithful mouse model of AEC syndrome, which is characterized by hypoplastic and fragile skin, ectodermal dysplasia and cleft palate. We find that epidermal hypoplasia and cleft palate are associated with a transient reduction in epithelial cell proliferation during development. These defects closely resemble those observed in the Fgfr2b−/− mice (De Moerlooze et al, 2000; Petiot et al, 2003; Rice et al, 2004). p63 transcriptionally controls the FGF receptors Fgfr2 and Fgfr3 and their expression as well as downstream signalling is affected in p63+/L514F mutant mice. We propose that impaired FGF signalling downstream of p63 is likely an important determinant of reduced ectodermal cell proliferation and defective self-renewing compartment in AEC syndrome.
RESULTS
The phenotype of p63+/L514F mice mimics that of AEC syndrome
To characterize the developmental alterations that occur in AEC syndrome, we generated a knock-in mouse model carrying a leucine to phenylalanine substitution in position 514 (L514F) in the p63 protein (Fig 1A–D). L514 is a highly conserved amino acid in the first helix of the SAM domain, which is mutated to either phenylalanine or valine in AEC patients (McGrath et al, 2001; Payne et al, 2005; Supporting Information Fig S1A). A correctly targeted embryonic stem cell line allowed the mutation to be transmitted through germline to produce heterozygous p63+/L514F mice. p63 messenger RNA (mRNA) was expressed at similar levels in p63+/L514F mutant and in wild-type epidermis (Supporting Information Fig S1B), whereas p63 protein was more abundant in mutant than in wild-type epidermis (Supporting Information Fig S1C-D) consistent with the previously reported p63 accumulation in the skin of AEC patients (Browne et al, 2011; Moretti et al, 2010). No aberrant isoforms were detected either at the RNA or the protein levels (Supporting Information Fig S1C and S1E).
Figure 1. Generation and phenotype of p63+/L514F mice.
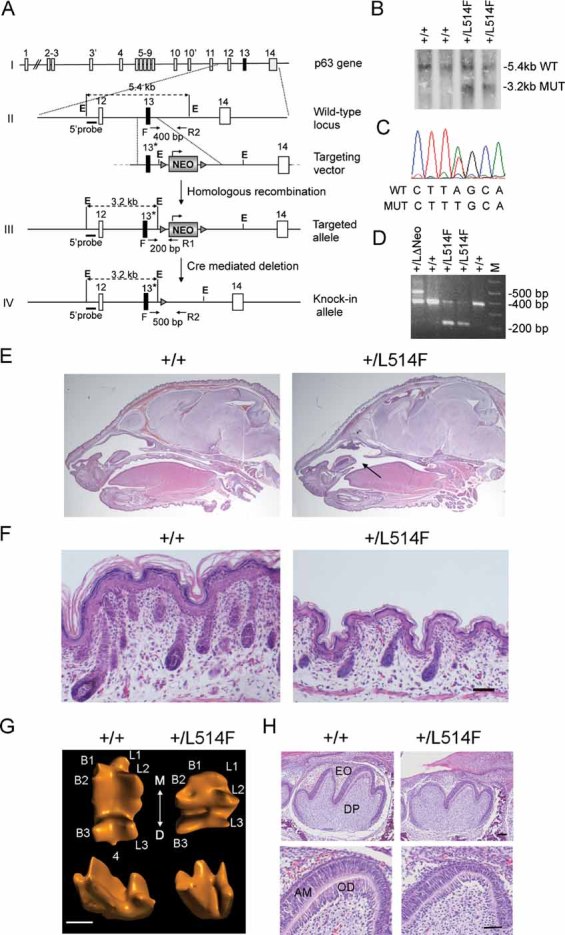
- Gene targeting strategy used to generate the p63+/L514F knock-in mice. The L514F mutation is indicated with *. Dotted black lines indicate the sizes of the fragments generated from each allele upon EcoRI (E) digestion. Oligonucleotide primers (arrows) used for PCR analysis and the relative PCR product length, are indicated.
- Southern blot analysis of ES cell clones using the EcoRI digestion of genomic DNA and the 5′ probe upstream of the recombinant targeted site.
- DNA sequencing analysis of the L514F point mutation in properly targeted ES cells.
- In vivo removal of the NEO cassette obtained by crossing chimeras with CMV-Cre transgenic mice, as revealed by PCR analysis performed on tail genomic DNA using one forward (F) and two reverse primers (R1 and R2).
- H&E staining of sagittal sections of +/+ and p63+/L514F newborn heads. Cleft of the secondary palate is indicated by the arrow.
- H&E staining of dorsal skin of p63+/L514F mice at P0. Mutant epidermis is thinner and with less developed hair follicles.
- Three-dimensional computer-aided reconstruction of tooth crown morphology of the first lower molar at P0. The cusps are numbered as buccal (B1, 2, 3), lingual (L1, 2, 3) and distal (4). The axis of the tooth coming in contact with adjacent teeth is indicated: mesial (M) and distal (D). Scale bar: 400 µm.
- Histological analysis of sagittal sections of the first lower molar at P0. EO, enamel organ; DP, dental papilla; AM, ameloblasts; OD, odontoblasts. Scale bar: upper panel 50 µm, lower panel 40 µm.
Visual inspection at birth revealed that newborn p63+/L514F mice exhibited air accumulation in their stomach and intestine without milk uptake and the mice died shortly after birth. p63+/L514F mice (n = 187) exhibited a fully penetrant wide cleft of the secondary palate without involvement of the lip/primary palate or other cranial or mandibular malformations (Fig 1E; Supporting Information Fig S2A–C). Cleft palate was not rescued by crossing chimeras with females of different inbred strains (see Supporting information) suggesting that this defect was independent of the genetic background.
Ankyloblepharon-ectodermal defects-cleft lip/palate patients are characterized by mild atrophy of the skin, skin erosions and sparse or absent hair (Dishop et al, 2009; McGrath et al, 2001). p63+/L514F mice displayed reduced skin folding and a translucent appearance of the skin at birth (Supporting Information Fig S3A). At the histological level, mutant skin was thinner than that of wild-type mice with consistently thin epidermis and dermis (Fig 1F). Blistering skin lesions, localized mainly between the basal and suprabasal layers of the epidermis, were observed in a fraction of mutant mice (21%; n = 28) (Supporting Information Fig S3B). The number of hair follicles in more advanced stages of differentiation was reduced (Fig 1F and Supporting Information Fig S3C). In spite of normal hair placode formation, hair follicle morphogenesis was delayed (Supporting Information Fig S3C-D). Vibrissae were similarly shortened (Supporting Information Fig S3E). Among the dental abnormalities observed in AEC patients are smaller teeth, with small occlusal surface in premolars and molars (Farrington & Lausten, 2009). Similarly, in p63+/L514F mice the crown of the lower first molar tooth was smaller than the wild-type, particularly in the mesial–distal axis, and the distal cusp was missing (Fig 1G). In addition, the tooth germ was smaller with less developed cusps and with hypoplastic pre-ameloblast and odontoblast layers (Fig 1H). Ankyloblepharon, a characteristic defect in AEC patients, could not be evaluated in mutant mice as eyelids are normally fused until postnatal day 15 (P15).
Taken together, these data show that p63+/L514F heterozygous mice phenocopy many aspects of the human AEC syndrome and thus represent the first mouse model for this disease.
Palate hypoplasia and reduced cell proliferation of the palatal epithelium in p63+/L514F mice
To identify the cause of cleft palate, we analyzed the p63+/L514F mouse oral cavity during development. At embryonic day (E)13.5, although reproducibly smaller, the mutant palatal shelves pointed downwards on either side of the tongue similar to their wild-type littermates (Fig 2A, C and D). Although the mutant palatal shelves elevated appropriately at E14.5, they were smaller, widely spaced and failed to meet in the midline (Fig 2B).
Figure 2. Palatal shelf hypoplasia and reduced epithelial cell proliferation in p63+/L514F embryos.
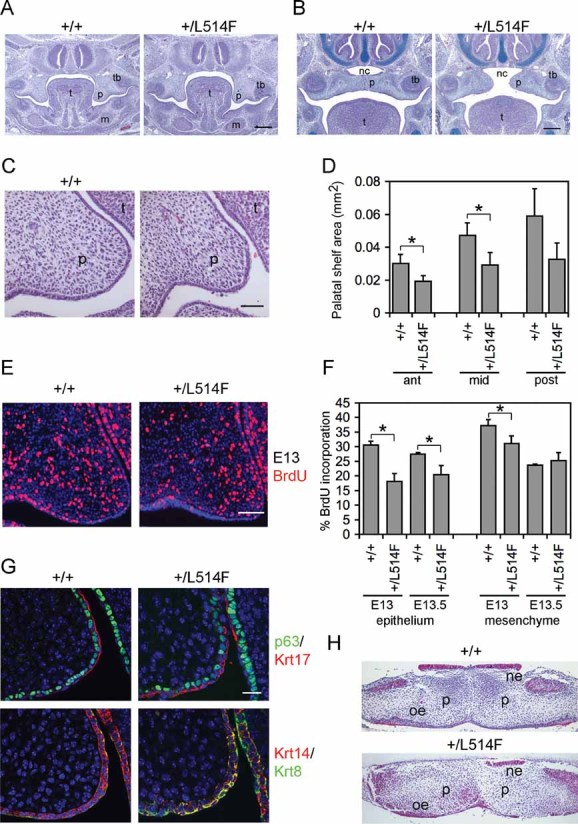
- H&E staining of coronal sections of p63+/L514F mid palate at E13.5 reveals grossly similar morphology of palatal shelves compared to controls. t, tongue; p, palatal shelf; tb, molar tooth bud; m, mandible. Scale bar: 200 µm.
- H&E and Alcian Blue staining of coronal sections of p63+/L514F mid palate at E14.5 reveals a failure of the palatal shelves to meet in the horizontal plane. nc, nasal cavity. Scale bar: 200 µm.
- A closer view of H&E staining of E13.5 coronal sections reveals that mutant palatal shelves are hypoplastic compared to controls. Scale bar: 50 µm.
- Quantification of the anterior, mid and posterior palatal shelf area. Error bars represent standard deviation (SD). Anterior palate *p-value = 0.00032; n = 9. Mid palate *p-value = 0.00079; n = 9. Posterior palate p-value = 0.0097; n = 9.
- Immunofluorescence with anti-BrdU antibodies at E13 (left panel) reveals reduced proliferation of mutant palatal shelves.
- The average percentage of BrdU incorporation is reduced in mutant palatal epithelium at E13 and E13.5. Epithelium at E13 p-value = 0.009; n = 9. Mesenchyme at E13 p-value = 0.032; n = 9. Epithelium at E13.5 p-value = 0.018; n = 9. Data are represented as mean ± SD. Scale bar: 50 µm.
- Double immunofluorescence staining for the indicated markers reveals hypoplasia and disorganization of the palatal shelf epithelium at E13.5. Scale bar: 20 µm.
- Palatal explant culture assay reveals that mutant palatal shelves fuse appropriately. Palatal shelves freshly isolated at E13.5 were placed in contact and cultured for 48 h. ne, nasal epithelium; oe, oral epithelium.
To test the possibility that the smaller size of the palatal shelves may result from reduced cell proliferation, we measured 5-bromodeoxyuridine (BrdU) incorporation between E13 and E13.5, the narrow time window during which most of the palatal shelf outgrowth occurs. At E13, cell proliferation was reduced significantly in the mutant epithelium and to a lesser extent in the mesenchyme (Fig 2E and F). At E13.5, BrdU incorporation was unaffected in the mesenchyme, but was still reduced significantly in the epithelium (Fig 2F).
Consistent with the reduced proliferation observed, the p63+/L514F palatal epithelium appeared disorganized and hypoplastic with irregularly spaced basal cells expressing p63 and keratin 14 (Krt14). Basal cells were intermingled with Krt17- and Krt8-positive periderm cells, which lacked the characteristic flattened morphology observed in wild-type mice (Fig 2G). To test whether the disorganization of the epithelium could affect palatal fusion, we placed E13.5 palatal shelves with their medial edge epithelia in contact in culture. All explants fused appropriately (Fig 2H; n = 9), suggesting that the cleft palate in mutant mice is unlikely to be caused by a fusion failure.
Thus, in p63+/L514 embryos cleft palate is caused by reduced cell proliferation as well as disorganization of the p63-expressing epithelium and consequent reduction of mesenchymal cell proliferation with insufficient extension of the palatal shelves toward the midline.
Epidermal hypoplasia and defective cell proliferation in p63+/L514F embryos
Severe hypoplasia was also observed in p63+/L514F epidermis (40% thinner than wild-type) during embryonic development and at birth, with a reduction in the number of nuclei and a more flattened appearance of cells in all layers (Fig 3A and B). In contrast, no hypoplasia was observed in epidermis of mice heterozygous for a null mutation in p63 (p63+/−) (Supporting Information Fig S4A).
Figure 3. p63+/L514F epidermis is hypoplastic compared to the control.
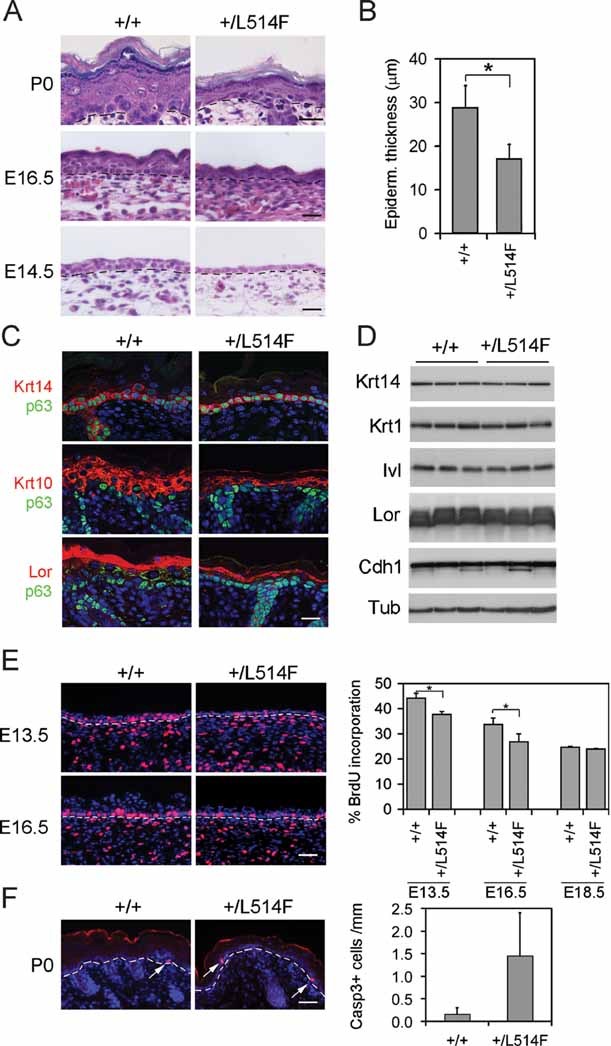
- H&E staining reveals hypoplasia of p63+/L514F epidermis at the indicated times of development. Dashed lines indicate the border between epidermis (top) and dermis (bottom). Scale bar: 50 µm.
- Quantification of epidermal thickness (µm) in +/+ and p63+/L514F skin at birth (*p-value = 0.0009; n = 6). Data are represented as mean ± SD.
- Immunofluorescence analysis for p63, Krt14 (basal layer), Krt10 (spinous layer), and loricrin (Lor, granular layer) at P0 reveals appropriate expression of these differentiation markers in mutant epidermis. Scale bar: 20 µm.
- Immunoblotting of total cell extracts from neonatal epidermis using antibodies against the indicated differentiation markers, Krt1 (spinous layer), the upper spinous layer marker involucrin (Ivl), the adherens junction component E-cadherin (Cdh1) and αTubulin (Tub) as loading control.
- BrdU staining of the epidermis reveals reduced proliferation in mutant epidermis during development. Left panels: BrdU positive cells are in red; nuclei are stained with DAPI. Dashed lines indicate the border between epidermis (top) and dermis (bottom). Scale bar: 50 µm. Right panel: BrdU positive cells are expressed as percentage of the total number of basal cells (E13.5 *p-value = 0.0151; n = 7. E16.5 *p-value = 0.0271; n = 7). Data are represented as mean ± SD.
- Left panel: immunofluorescence for active caspase 3 at P0 showing low levels of apoptosis in p63+/L514F epidermis compared to wild-type. Arrows indicate apoptotic cells. Scale bar: 70 µm. Right panel: quantification of active caspase 3 positive cells. Data are represented as mean ± SD (p-value = 0.0010; n = 16).
Differentiation markers were localized appropriately in neonatal and in developing mutant epidermis although each layer was hypoplastic compared to wild-type (Fig 3C; Supporting Information Fig S4B). Expression of these markers was quantitatively similar in wild-type and in mutant epidermis when cell extracts normalized for protein content (Fig 3D). Consistent with a normal differentiation process, the impermeable epidermal barrier was established at the appropriate developmental time-point in p63+/L514F embryos (Supporting Information Fig S4C), despite the epidermal hypoplasia.
To test whether epidermal hypoplasia could be due to defective cell proliferation, we performed in vivo BrdU labelling at different embryonic stages. A statistically significant reduction in BrdU incorporation was detected in mutant epidermis at both E13.5 and E16.5 (Fig 3E). In contrast, at E18.5 the rate of BrdU incorporation was similar in mutant and wild-type epidermis in spite of persistent epidermal hypoplasia (Fig 3E). Apoptosis was a very rare event in p63+/L514F epidermis as determined by staining for active caspase 3 at E16.5 and P0 (Fig 3F and Supporting Information Fig S5A) or by fluorescent activated cell sorting (FACS) analysis with annexin V antibodies of freshly isolated keratinocytes (Supporting Information Fig S5B). The apoptotic rate was modestly increased in mutant versus wild-type epidermis. Thus, in p63+/L514F epidermis, hypoplasia is associated with a transient reduction of cell proliferation during embryonic development and a modest increase in apoptosis, whereas terminal differentiation is not significantly affected.
Fgfr2b and Fgfr3b expression is downregulated in p63+/L514F mice
To gain insight into the molecular mechanisms underlying the proliferative defects observed in the developing palate and skin, we compared gene expression profiles of mutant and wild-type cells or tissues derived from E14.5 skin, E18.5 epidermis and newborn primary keratinocytes. These data were also compared with previously obtained gene expression profiles of p63 knockdown versus control keratinocytes (Della Gatta et al, 2008). Several known p63 target genes were affected to a similar extent in p63+/L514F cells or tissue and in p63 knockdown keratinocytes compared to the appropriate controls (Supporting Information Table S1). However, the expression of selected cell cycle regulators that have been previously implicated in p63-mediated cell cycle progression, including p21Cip1/Waf1 (Nguyen et al, 2006; Truong et al, 2006), p16Ink4a, p19Arf (Su et al, 2009) and the micro-RNA miR-34a (Antonini et al, 2010), was unaffected in E14.5 mutant skin or in primary keratinocytes (Supporting Information Fig S6A), suggesting that reduced proliferation in mutant epidermis was unlikely to depend on their direct regulation.
FGF signalling is a prominent pathway that controls epithelial cell proliferation during embryonic development. Fgfr2b−/− mice, which lack the epithelial-specific Fgfr2b isoform, display epidermal hypoplasia associated with a transient reduction of cell proliferation during development, tooth and hair defects and cleft palate with reduced palatal epithelial cell proliferation (De Moerlooze et al, 2000; Petiot et al, 2003; Rice et al, 2004). Interestingly, Fgfr2b expression is reduced in the developing epidermis and in thymus of p63−/− mice (Candi et al, 2007; Fomenkov et al, 2003; Laurikkala et al, 2006) and is affected by mutant p63 and by p63 knockdown in the global gene expression analysis (Supporting Information Table S1).
To provide further support for Fgfr2b or other FGF signalling components being affected in p63+/L514F embryos, we first measured the expression levels of FGF receptors in mutant and wild-type tissues. Fgfr2b mRNA was significantly reduced in p63+/L514F palatal shelves, skin and primary keratinocytes as compared to controls (Fig 4A and B), whereas its expression was unaffected in p63+/− skin (Supporting Information Fig S6B). Among the other FGF receptors, expression of the epidermal-specific isoform Fgfr3b, which plays a role in promoting both epidermal cell proliferation and differentiation (Mandinova et al, 2009), was significantly reduced in p63+/L514F tissue and cells as compared to p63+/− and wild-type controls (Fig 4A). In contrast, Fgfr1 and Fgfr4 were expressed equally in mutant and wild-type embryonic tissues (Supporting Information Table S2).
Figure 4. Fgfr2 and Fgfr3 are direct p63 target genes.

- Real-time RT-PCR performed on total mRNA isolated from palatal shelves at E13.5, embryonic skin at E14.5, and from neonatal keratinocytes, reveals reduced expression of Fgfr2b in p63+/L514F tissues compared to +/+ controls. Data are normalized for β-actin mRNA levels and are represented as mean ± SD normalized mRNA levels (palate p-value = 0.0015; n = 9, skin p-value = 0.00044; n = 8; keratinocytes p-value = 0.0098; n = 7) and Fgfr3b (palate p-value = 0.0112; n = 8; skin p-value = 0.0092; n = 8; keratinocytes p-value = 0.0002; n = 6).
- Immunostaining for Fgfr2 (red) reveals its reduced expression in mutant embryonic skin at E15.5 compared to control. Nuclei are stained in blue. Scale bar: 20 µm.
- Real-time RT-PCR for Fgfr2 pre-mRNA reveals reduced expression of the primary transcript in p63+/L514F keratinocytes compared to +/+ controls. Data are represented as mean ± SD (p-value = 0.023; n = 3). To control for genomic DNA contamination, reverse transcriptase (RT) was not added in the indicated samples.
- ChIP assay of mouse keratinocyte chromatin using mouse p63 polyclonal antibodies and rabbit IgG as negative control reveals strong p63 binding to Fgfr2 (+1.8 kb from TSS) and Fgfr3 (−10 kb from TSS) regulatory regions. The result is representative of three independent experiments, and error bars represent standard error (SE).
- ChIP assay of E14.5 skin chromatin reveals a similar p63 binding to Fgfr2 and Fgfr3 regulatory regions. The control regions (ctr) were at −130 bp from TSS and −8.5 kb from TSS in Fgfr2 and Fgfr3, respectively. Data are represented as mean ± SE and are representative of at least three independent experiments.
- Luciferase assay of the Fgfr2 regulatory region in H1299 reveals that p63 can enhance the wild-type (WT) region activity but not the mutant (MUT) one in cells devoid of p63. See Supporting Information Table S3 for the p63 binding site mutation.
- Luciferase assay in H1299 reveals that mutant p63L514F is unable to transactivate the Fgfr2 regulatory region and interferes with wild-type p63 affecting its transactivation ability. Data are represented as mean ± SE and are representative of at least three independent experiments.
Fgfr2 and Fgfr3 are p63 transcriptional target genes
To assess whether the Fgfr2 primary transcript was affected in p63 mutant mice, we measured the relative levels of unspliced Fgfr2 RNA (pre-mRNA) by amplifying segments of Fgfr2 introns. In mutant keratinocytes, Fgfr2 pre-mRNA and total Fgfr2 mRNA were similarly reduced compared to the wild-type indicating that the p63 mutation is likely to affect primarily Fgfr2 gene transcription (Fig 4A and C). In addition, Fgfr2 and Fgfr3 expression was measured in p63 knockdown mouse keratinocytes at different times after transfection with p63-specific siRNA. Both Fgfr2b and Fgfr3b were rapidly reduced upon p63 knockdown, whereas the gene encoding the FGF binding protein Fgfbp1, which was also affected in p63+/L514F epidermis, was reduced only at later time points (Supporting Information Fig S6C; Supporting Information Table S1).
To identify p63 binding sites within the Fgfr2 and Fgfr3 genomic loci, we analyzed chromatin immunoprecipitation, followed by deep sequencing (ChIP-seq) data obtained in human primary keratinocytes (Kouwenhoven et al, 2010). Several p63 binding regions were observed in the Fgfr2 and Fgfr3 loci, whereas no p63 binding regions were detected in Fgfr1 and Fgfr4 loci (Supporting Information Fig S7A and S8A; Kouwenhoven et al, 2010). In the Fgfr2 locus, four p63 binding regions were evolutionary conserved in mouse and were enriched for histone H3 methylation on lysine 4 mono- and di-methylations (H3K4me1 and me2), chromatin marks known to associate with distal regulatory regions [reviewed in (Bell et al, 2011)], suggesting that they function as regulatory elements (Supporting Information Fig S7A). ChIP assays of mouse primary keratinocytes under growing conditions demonstrated p63 binding to the corresponding mouse sequences, the strongest binding region being the +1.8 kb region from the Fgfr2 transcriptional start site (TSS) (Fig 4D; Supporting Information Fig S7B). p63 binding at the +1.8 kb was also detected in vivo in E14.5 skin extracts (Fig 4E), and in E13.5 mouse palatal shelves (ChIP-seq data; J.D., H.Z., unpublished observations). In addition, the +1.8 kb region was strongly enriched for trimethylated H3K4 (H3K4me3) (Supporting Information Fig S7C) that mark sites of transcriptional activation near the 5′ region of actively transcribed genes (Bell et al, 2011), supporting the possibility that this region plays an active role in gene transcription regulation.
Sequence analysis of the +1.8 kb p63 binding region revealed the presence of a ‘canonical’ p63 binding site that was conserved in mammals (Supporting Information Fig S7D). A luciferase reporter construct encompassing the p63 binding region was induced significantly by p63 overexpression in human H1299 cells lacking p63, and its response was abolished by a point mutation in the p63 binding site (Fig 4F). Mutant p63L514F was unable to transactivate the Fgfr2 promoter to the same extent as wild-type p63, and co-expression of mutant and wild-type p63 suppressed wild-type p63-mediated transactivation of the Fgfr2 promoter (Fig 4G). Taken together, these data indicate that p63 directly activates Fgfr2 expression in primary mouse keratinocytes and in embryonic skin.
Similarly, we identified a p63 binding region in the FGFR3 genomic locus at −10 kb from the TSS on human chromosome 4 that was evolutionary conserved in mouse (Supporting Information Fig S8A; Kouwenhoven et al, 2010). Binding to this region of the genome was observed by ChIP in primary human and mouse keratinocytes and in E14.5 embryonic skin (Fig 4D and E; Supporting Information Fig S8B). In addition, this region was enriched for H3K4me1 (Supporting Information Fig S8C). A conserved p63 binding site was found in the −10 kb region (Supporting Information Fig S8D). Luciferase assays revealed that the p63 binding region activity was efficiently induced by p63 expression in H1299 cells (Supporting Information Fig S8E).
These data indicate that Fgfr2 and Fgfr3 are bona fide p63 transcriptional target genes.
FGF signalling pathway is disrupted in p63+/L514F keratinocytes
To determine the contribution of Fgfr2b and Fgfr3b downregulation to FGF signalling and cell proliferation, we measured the levels of FGFR substrate 2α (FRS2α) tyrosine phosphorylation. In p63+/L514F primary keratinocytes, a strong reduction of Fgfr2b and Fgfr3b proteins was accompanied with a significant decrease in FRS2α phosphorylation (Fig 5A) indicating impaired activation of FGF signalling. FGF signalling leads to induction of the classical Ras/extracellular signal regulated kinase (ERK) pathway. In spite of impaired FGF receptor activity, ERK phosphorylation was unaffected in p63+/L514F keratinocytes. The presence of several other growth factors in the fully supplemented medium in which cells were grown may compensate for the impaired FGF receptor activity. In contrast, treatment of starved wild-type cells with KGF (keratinocyte growth factor or FGF-7), the Fgfr2b-specific ligand, resulted in ERK phosphorylation, whereas in mutant keratinocytes, ERK phosphorylation was impaired (Fig 5B). Restoring Fgfr2b expression by retroviral Fgfr2b transfer rescued ERK activation upon KGF treatment. As expected, EGF treatment elicited a similar induction in ERK phosphorylation in both wild-type and mutant keratinocytes, and exogenous Fgfr2b expression had no effect on EGF-induced ERK phosphorylation (Supporting Information Fig S9A) indicating a specific impairment of FGF/Ras/ERK pathway activation in mutant cells.
Figure 5. Rescue of FGF signalling by exogenous Fgfr2b expression in mutant epidermal cells.
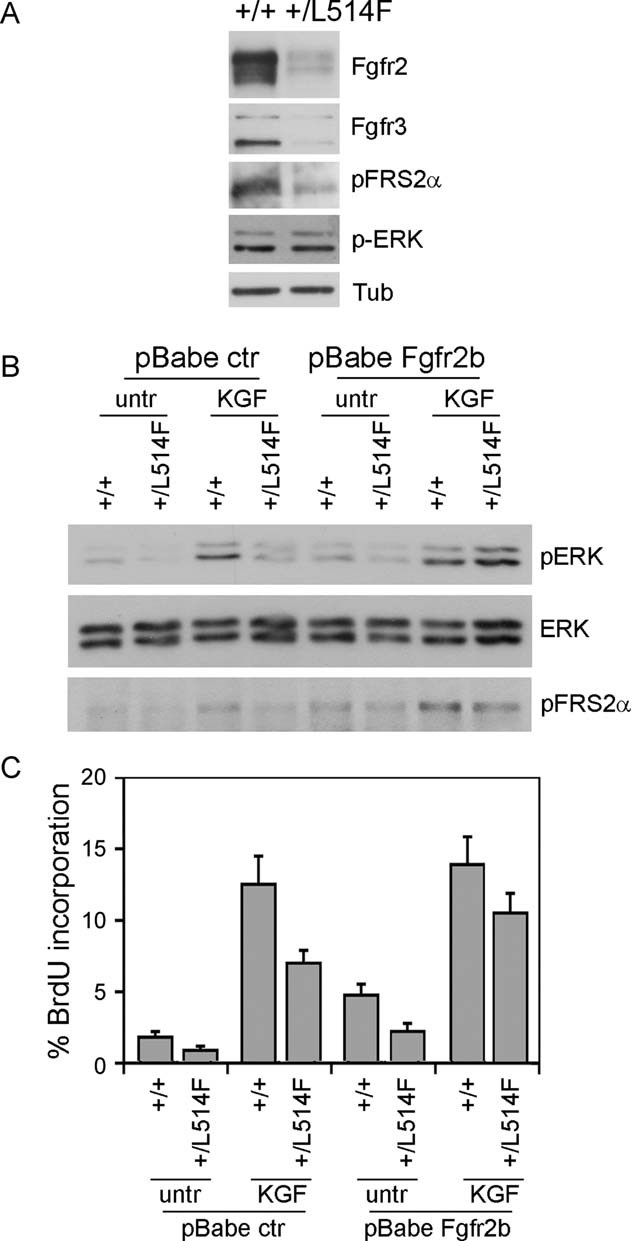
- Immunoblotting analysis for Fgfr2, Fgfr3 and the phosphorylated active form of the downstream signalling proteins FRS2α (p-FRS2α) and ERK (p-ERK) reveals downregulation of the FGF receptor and downstream signalling in p63+/L514F keratinocytes compared to controls. Tubulin was used to normalize samples for protein content.
- Immunoblotting analysis for ERK phosphorylation reveals reduced ERK activation in p63+/L514F starved keratinocytes compared to controls upon KGF treatment. Exogenous expression of Fgfr2b and concomitant treatment with KGF can restore ERK phosphorylation. Total ERK protein levels were used as control. pFRS2α was used as control of FGFR activation.
- BrdU incorporation of starved keratinocytes treated as in (B) reveals that p63+/L514F cells have a defective cell proliferation in the absence of exogenous growth factors. Rescue is obtained by exogenous expression of Fgfr2b and concomitant treatment with KGF (25% difference between mock-infected untreated samples and KGF treated/Fgfr2b expressing cells; p-value = 0.005, n = 6 of three independent experiment). Data are represented as mean ± SD.
Consistent with the normal rate of cell proliferation observed in neonatal skin (Fig 3E), mutant keratinocytes proliferated under growing conditions at a rate that was indistinguishable from that of wild-type cells (Supporting Information Fig S9B). However, in the absence of other growth factors, the rate of BrdU incorporation after KGF stimulation was reduced to 50% in mutant compared to wild-type cells. Restoring Fgfr2b expression by retroviral Fgfr2b transfer resulted in a significant rescue of BrdU incorporation upon KGF treatment (Fig 5C).
Taken together, these data indicate that downstream FGF signalling is impaired in p63+/L514F keratinocytes, and exogenous expression of the Fgfr2b receptor is sufficient to restore mitogen-activated protein kinase (MAPK) signalling and BrdU incorporation following KGF stimulation.
Reduced number of epidermal self-renewing cells in p63+/L514F and in Fgfr2b−/− mutant epidermis
Loss of p63 has been reported to affect the proliferative potential of stratified epithelial stem cells, including those of the skin (Senoo et al, 2007). To explore the possibility that mutant p63 may affect the pool of epidermal self-renewing cells, we first tested whether p63+/L514F cells have an altered clonogenic potential by plating freshly isolated newborn keratinocytes at clonogenic density and analyzing their ability to form clones over time. Initial plating efficiency was similar between mutant and wild-type cells. However, after 3 weeks in culture the number of large clones (>2 mm) generated by p63+/L514F cells was significantly lower than their wild-type counterparts (Fig 6A). Under clonogenic conditions, the overall mutant population was less proliferative (Supporting Information Fig S10A) consistent with a reduced number of clonogenic cells or with a reduced ability to proliferate under clonogenic conditions. However, no differences in cell proliferation were detected between p63+/L514F mutant and wild-type large clones 3 weeks after plating in spite of a maintained reduction in Fgfr2 protein expression (Supporting Information Fig S10B-C). Accordingly, Fgfr2b−/− keratinocytes had a very similar reduction in the number of large clones (>2 mm) compared to wild-type controls in spite of a similar initial plating efficiency (Fig 6B).
Figure 6. The epidermal self-renewing compartment is reduced in p63+/L514F mice.
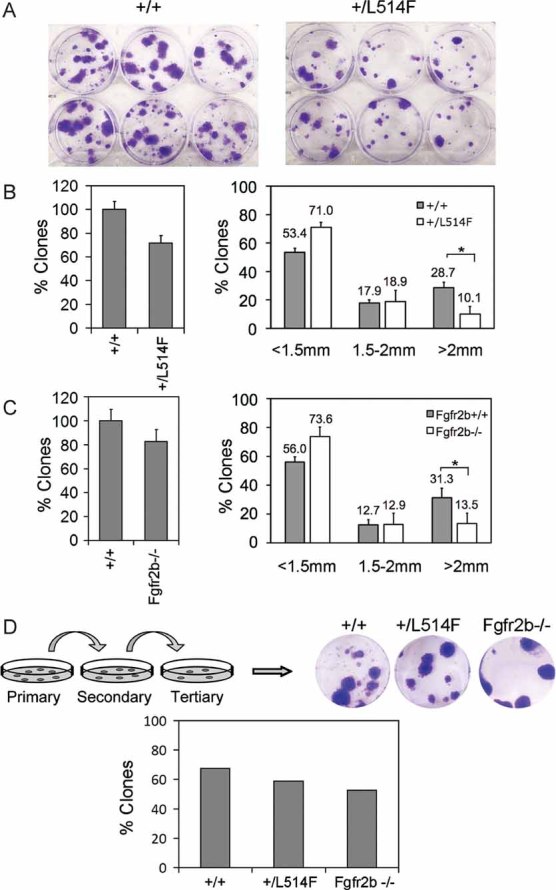
- Clonogenicity assay performed with freshly isolated epidermal cells cultured for 3 weeks reveals a reduced clonogenic potential of p63+/L514F keratinocytes.
- Left panel: Percentage of total number of p63+/L514F compared to +/+ clones. The difference is not statistically significant. Right panel: A reduction in clones larger than 2 mm is observed in p63+/L514F mice compared to +/+. Data are represented as mean ± SD (*p-value = 0.0076; n = 6).
- Clonogenicity assay performed with freshly isolated Fgfr2b−/− and +/+ keratinocytes cultured for 3 weeks. Clonogenicity assay reveals a reduction in the number of clones with a high-clonogenic potential (>2 mm) in Fgfr2b−/− mice compared to wild-type. Data are represented as mean ± SD (*p-value = 0.035; n = 6).
- Secondary and tertiary replating of clones reveals that p63+/L514F epidermal cells can self-renew similarly to +/+ in tertiary cultures. The percentage of secondary clones that formed tertiary clones is indicated (+/+ n = 37; p63+/L514F = 27; Fgfr2−/− n = 19).
To test whether the self-renewal capacity of p63+/L514F and Fgfr2b−/− cells was impaired, a secondary and tertiary plating strategy was employed. Clones were picked individually and disaggregated cells were cultured for 3 weeks at clonogenic density for two consecutive passages. p63+/L514F keratinocytes generated secondary and tertiary large clones with a similar efficiency to that of the wild-type (Fig 6D; n = 34) in spite of persistent p63L514F mutant expression in tertiary clones (Supporting Information Fig S10D), revealing that the intrinsic self-renewal ability of mutant cells was unaffected. Similarly, Fgfr2b−/− large clones were passaged with a somewhat reduced but still high efficiency compared to the wild-type, indicating that the intrinsic self-renewal ability of Fgfr2b−/− cells was only modestly affected. These data are consistent with the possibility that neonatal p63+/L514F and Fgfr2b−/− skin contains a reduced number of clonogenic cells with a similar self-renewal ability compared to wild-type.
The stem cells of the interfollicular epidermis have long been thought to reside in the basal layer, however, their identity is still elusive, and there are no definitive markers for these cells [reviewed in (Fuchs, 2009; Watt & Jensen, 2009)]. In contrast, various populations of hair follicle stem cells have been characterized in great detail. Hair bulge stem cells expressing high levels of α6 integrin (Itga6bri) and low levels of the transferrin receptor CD71 (CD71dim) are enriched for cells with a higher clonogenic potential both in vitro and in vivo (Tani et al, 2000; Tumbar et al, 2004). Consistent with these previous reports, the Itga6bri/CD71dim population had an enhanced ability to form large clones in a clonogenicity assay (Supporting Information Fig S10E). In wild-type skin, the Itga6bri/CD71dim population constituted 0.5% of the total epidermal cells using stringent criteria (Supporting Information Fig S10F). In contrast, the Itga6bri/CD71dim population was significantly reduced in p63+/L514F epidermis, representing only 0.1% of the total, suggesting that the clonogenic cell population is reduced in mutant skin.
To further evaluate the presence of cells with high-proliferative potential in mutant skin, we immunostained neonatal skin for markers that have been shown to correlate with these cells, such as Krt15 (Liu et al, 2003; Stachelscheid et al, 2008) and Sox9 (Nowak et al, 2008; Vidal et al, 2005). Krt15 expression was dramatically reduced in p63+/L514F and in Fgfr2b−/− neonatal epidermis and hair follicle as assessed by immunofluorescence and, for p63+/L514F epidermis, also by immunoblotting (Fig 7A and B). Importantly, a similar strong downregulation of Krt15 was also observed in AEC patient skin by immunofluorescence and by real-time RT-PCR (Fig 7C and D). Similarly, Sox9 was strongly reduced in p63+/L514F and Fgfr2b−/− hair follicles even in the rare well-formed follicles containing a visible bulge region (Fig 7E). A significant reduction of Sox9 mRNA was also detected in skin samples derived from AEC patients compared to wild-type controls (Fig 7F).
Figure 7. Reduced progenitor marker expression in p63+/L514F and Fgfr2b−/− mice and in skin of AEC patients.

- Immunostaining reveals reduced Krt15 expression (green) in the epidermis and in the hair follicle of p63+/L514F and Fgfr2b−/− compared to +/+ control. Nuclei are stained with DAPI. Scale bar: 50 µm.
- Immunoblotting for Krt15 confirms decreased protein expression in p63+/L514F epidermis compared to +/+. Tubulin was used to normalize samples.
- Immunostaining for Krt15 (green) of skin biopsies from AEC patients (AEC1 and AEC2) and a human unaffected control (CTR) demonstrates reduced Krt15 expression in AEC skin. Scale bar: 50 µm.
- Real-time RT-PCR for Krt15 mRNA in human skin isolated from AEC patients or controls (CTR) reveals a quantitative reduction of Krt15 mRNA levels in the skin of AEC patients compared to wild-type. Data are represented as mean ± SD (p-value = 0.026).
- Immunofluorescence for Sox9 on neonatal mouse skin reveals reduced Sox9 expression in p63+/L514F and Fgfr2b−/− compared to +/+ control. Scale bar: 50 µm.
- Levels of Sox9 mRNA in human skin isolated from AEC patients or controls (CTR) were assessed by real-time RT-PCR. Data are represented as mean ± SD (p-value = 3.85 × 10⁻⁵).
Taken together, these data indicate that neonatal skin of p63+/L514F mice has a significant reduction in the number of epithelial cells with high-clonogenic and -proliferative potential, and that in spite of the quite different structure of the human skin, reduced expression of Krt15 and Sox9 is also observed in the skin of AEC patients. Fgfr2b is required for the epidermal self-renewing compartment suggesting that impairment of the FGF signalling may account for a reduced number of epidermal cells with high-proliferative potential in p63+/L514F skin.
DISCUSSION
Here, we generated a mouse model for AEC syndrome that closely mimics the human disorder at the genetic and phenotypic levels. Among the various processes regulated by p63, we find that the AEC mutant affects primarily ectodermal cell proliferation during development through a highly selective mechanism, leading to epidermal and palatal hypoplasia and reduced expansion of epithelial progenitor cells. In addition, our work demonstrates a novel functional link between p63 and FGF signalling in controlling progenitor cell expansion providing significant mechanistic insights into the pathogenesis of AEC syndrome.
p63+/L514F epidermis is hypoplastic and hypoproliferative during embryonic development. In contrast, cell proliferation is unaffected at birth in spite of persistent hypoplasia. This is an unusual phenotype that has been reported only for Fgfr2b−/− mice (Petiot et al, 2003) suggesting that the underlying mechanism is common between these two mutants. In addition, a similar reduction of the self-renewing compartment is observed in p63+/L514F and in Fgfr2b−/− skin, implicating Fgfr2b and FGF signalling in epidermal progenitor cell expansion and/or specification for the first time. While the number of epidermal progenitors with stemness properties is reduced, their intrinsic self-renewal ability appears unaffected as judged by long-term replating assays. In vivo competition experiments will be required to determine the exact nature of the defect in the self-renewing epithelial compartments.
The lack of bona fide markers for interfollicular epidermal stem cells has prevented us from fully demonstrating that not only hair follicle stem cells but also interfollicular stem cells are defective. However, it is tempting to speculate that a defective epidermal self-renewal compartment may also be a likely contributor to the neonatal epidermal hypoplasia in p63+/L514F mice and possibly in humans affected by AEC syndrome.
As discussed above, skin and palate defects in p63+/L514F embryos are similar, albeit less severe, to those observed in Fgfr2b−/− embryos. However, some defects observed in embryos lacking Fgfr2b, including limb and lung defects, are not observed or are observed to a much lesser extent in p63+/L514F embryos (De Moerlooze et al, 2000; Revest et al, 2001). We speculate that in some tissues, p63 may not be the main regulator of Fgfr2b expression or reduced Fgfr2b levels may be still sufficient to allow normal development. In addition, some defects observed in p63+/L514F embryos are not observed in Fgfr2b−/− embryos suggesting that other p63 target genes affected by AEC mutations may also contribute to the phenotype. This may be the case of ankyloblepharon, a characteristic defect of AEC syndrome, not found in Fgfr2b−/− mice, which on the contrary display absence of eyelids (De Moerlooze et al, 2000; Revest et al, 2001). Similarly, epidermal adhesion defects are observed in p63+/L514F newborn mice but not in Fgfr2b−/− mice. A previously described mouse model for AEC syndrome obtained by conditional ΔNp63 knockdown in epidermis is affected by skin erosions and by focal disruption of the basement membrane (Koster et al, 2009), which was not observed in p63+/L514F newborn mice. Thus, skin erosions in patients may be the consequence of a variety of molecular defects, and additional research will be required to establish the nature of these defects in humans.
In humans, heterozygous deletion of the p63 gene does not cause clinical features typical of AEC syndrome (Chitayat et al, 1996). Similarly, p63 heterozygous mice are not affected by cleft palate or epidermal hypoplasia and, in contrast to p63−/− mice, have normal levels of Fgfr2b and Fgfr3b suggesting that mutations in the SAM domain do not lead to haploinsufficiency (Candi et al, 2007; Fomenkov et al, 2003; Laurikkala et al, 2006).
Previous overexpression studies in vitro have shown that p63 AEC mutants have dominant negative activities towards wild-type ΔNp63α (Koster et al, 2009; Lopardo et al, 2008; Marinari et al, 2009) and that Fgfr2b expression is affected by p63 at the RNA and protein levels (Wu et al, 2003). Consistent with these reports, we found that in p63+/L514F mutant epidermis and keratinocytes, a large number of p63 target genes, including Fgfr2 and Fgfr3 are affected, suggesting a broad dominant-negative function of AEC mutants. p63 directly regulates Fgfr2 and Fgfr3 transcription by binding to several regulatory regions in the Fgfr2 and the Fgfr3 loci, and Fgfr2 primary transcripts are affected in p63+/L514F keratinocytes, suggesting that an important level of dysregulation in AEC syndrome occurs at the transcriptional level. Interestingly, the repressive function of p63 on several cell cycle regulators, which has been shown to occur through interactions with histone deacetylase 1 (HDAC1) and histone deacetylase 2 (HDAC2) (Leboeuf et al, 2011), is not altered by the AEC mutation. How mutations in the SAM domain selectively affect a subset of target genes remains an open question for future studies and will require identification of more SAM domain-binding partners.
MATERIALS AND METHODS
Generation of p63+/L514F mice
The generation of knock-in mice is described in Supporting information. 129/C57BL/6 p63L514F chimeric males were bred with C57BL/6 female mice to generate p63+/L514F offspring. For NEO cassette removal, chimeras were bred with CMV-Cre transgenic mice in a C57BL/6 background. An indistinguishable phenotype was observed with and without the NEO cassette. Fgfr2b−/− mice have been described previously (De Moerlooze et al, 2000). All mouse experiments were approved by the Italian Ministry of Health.
Histology, Immunostaining and Immunoblotting
Mouse tissue was fixed in 4% PFA and embedded in paraffin wax. To evaluate cell proliferation, 5-bromo-2′-deoxy-uridine (BrdU, Invitrogen) was injected 3 h before the animals were sacrificed. Immunofluorescence was performed as described previously (De Rosa et al, 2009). Fluorescent signals were monitored under a Zeiss Axioskop2 plus image microscope or under a Zeiss confocal microscope LSM510meta. Human skin samples were obtained from previously described AEC patients (Dishop et al, 2009). Patient mutations have been reported (Rinne et al, 2009), and are listed in Table S3 of Supporting Information. For three-dimensional computer-aided reconstruction of the tooth, 5 µm serial paraffin sections of E18.5 heads were cut and stained with haematoxylin & eosin (H&E). The contour of the first lower molar was drawn at the epithelial–mesenchymal junction and reconstructed using BioVis3D software (BioVis3D, Uruguay). For immunoblotting, P0 epidermis was obtained by floating skin biopsies in 0.5 M ammonium thiocyanate (NH4SCN) in phosphate buffer, pH 6.8 for 20 min on ice. Tissue was pulverized in liquid nitrogen, lysed in sample buffer and immunoblotted as previously described (De Rosa et al, 2009). Antibodies used in this study are listed in Supporting information.
Cell and tissue culture, clonogenic assay and FACS analysis
Newborn mouse skin was placed in dispase o/n at 4 °C, and then keratinocytes were isolated from epidermis by enzymatic dissociation in trypsin, and cultured in defined PCT-epidermal keratinocyte medium (CnT-07, CELLnTEC) as described previously (Strachan et al, 2008). For clonogenic assays 103 cells/cm2 were plated on 35 mm dishes previously coated with 0.5 mg of Matrigel (BD Bioscience), and cultured in CnT-07. After 3 weeks, clones were stained with Crystal Violet (Sigma) and manually counted or picked individually for a secondary and tertiary plating in order to test their self-renewal ability.
For FACS analysis, freshly isolated newborn keratinocytes were prepared by enzymatic dissociation as above, and were stained with the indicated antibodies and with the vital dye Sytox Blue (Invitrogen) to exclude dead cells from the analysis. Samples were analyzed with FACSCanto II flow cytometry system (BD Biosciences) using BD FACSDIVA software. For the in vitro palatal shelves fusion assay, E13.5 palatal shelves were dissected and cultured in intimate contact on Millipore filters placed on metal grids in Trowell dishes, in DMEM/F12 as previously described (Thomason et al, 2008). For rescue experiments, primary keratinocytes were seeded on 12-well plates and infected with pBabe-Fgfr2b-C3 (Cha et al, 2009) or empty vector. After 2 days, cells were starved for 36 h and then treated with KGF (10 ng/ml). After 10 min, protein extracts were collected and samples were analyzed by immunoblotting. To evaluate proliferation, cells were incubated with BrdU labelling reagent 20 h after KGF treatment.
Real-time RT-PCR and ChIP analysis
Mouse epidermis was isolated from dermis by thermal shock at 55 °C for 1 min. RNA was extracted in TRIzol reagent (Invitrogen). Three millimeter human skin biopsies were obtained from AEC patients and stored in RNAlater. Total RNA was isolated from one-fourth of a 3 mm skin biopsy using RNeasy mini kits (Qiagen). Nuclear RNA was purified using Cytoplasmic & Nuclear RNA Purification Kit (Norgen) and treatment with DNase I (Roche). Complementary DNA (cDNA) synthesis was obtained using SuperScript Vilo (Invitrogen).
Real-time PCR was performed using the SYBR Green PCR master mix (Applied Biosystems) in an ABI PRISM 7500 (Applied Biosystems). Expression of target genes was normalized for Actb or for RPLP0 for mouse and human samples, respectively. ChIP analysis was performed as previously described (De Rosa et al, 2009). For antibodies and primer sequences see Supporting information and Table S4 of Supporting Information.
Luciferase reporter assay
Luciferase reporter constructs encompassing p63 binding regions in Fgfr2 intron 1 (422 bp) and at −10 kb (258 bp) from TSS of Fgfr3, were cloned in pGL3 basic vector (Promega). Mutagenesis was obtained using QuikChange site-directed mutagenesis (Stratagene). H1299 cells were transiently co-transfected with reporter and CMV-FLAG-ΔNp63α or empty vector, and pTK-Renilla (10 ng). Luciferase activity was determined 48 h after transfection with the dual-luciferase reporter assay kit (Promega).
The paper explained
PROBLEM
Ankyloblepharon-ectodermal defects-cleft lip/palate syndrome is an autosomal dominant disorder mainly characterized by cleft palate, and ectodermal dysplasia associated with severe involvement of the skin at birth, whose consequences are life-threatening. It is caused by heterozygous mutations in the p63 gene, encoding a transcription factor essential for the development of several stratified epithelia. Full understanding of AEC syndrome is impaired by genetic and clinical variability among unrelated patients, and by lack of foetal or neonatal biological samples.
RESULTS
Our article reports the characterization of a knock-in mouse model for AEC syndrome that recapitulates the human disorder both at the genetic and phenotypic levels. The p63 AEC mutation exerts a selective dominant-negative function on wild-type p63 by affecting the expression of a number of p63 target genes, including Fgfr2 and Fgfr3. Impairment of FGF signalling in p63 mutant embryos causes epidermal hypoplasia and cleft palate due to reduced expansion of ectodermal progenitor cells. These phenotypes are associated with a defective stem cell compartment that is observed not only in AEC mutant mice and in mice lacking epithelial Fgfr2, but also in humans affected by AEC syndrome.
IMPACT
Our studies provide novel mechanistic insights into the pathogenesis of AEC syndrome and establish a functional link between FGF signalling and p63 in the expansion of epithelial progenitor cells during embryonic development, a step required for skin and palate morphogenesis. Moreover, our observations provide the first evidence that reduced FGF signalling during embryogenesis leads to defects in the epidermal stem cell compartment.
Author contributions
GF carried out most of the experiment, contributed to the design of the experiments and helped writing the manuscript. HAT helped in the initial characterization of the skin and palate phenotype. DA measured gene and micro-RNA expression, performed luciferase assays and helped with data analysis. LDR helped in the characterization of the skin and hair follicle phenotype. BH characterized the tooth phenotype. MG performed FACS analysis. HZ shared unpublished ChIP-seq data. RA contributed to the generation of the knock-in construct. DPR provided tissue samples from Fgfr2b−/− mice. DA generated p63L514F chimeras. HvB shared unpublished ChIP-seq data. LDV supervised generation of FACS analysis data. MIK provided RNA samples and paraffin-fixed tissues from AEC patients. GT provided paraffin-fixed tissues from an AEC patient. BSD R provided Fgfr2b−/− mice. MD performed palate fusion assays and helped in interpreting the data. JD helped with the characterization of skin, tooth and palate phenotype, shared unpublished ChIP-seq data, and helped in interpreting the data. CM supervised the experimental design, analyzed and interpreted data and wrote the manuscript. All authors critically revised the manuscript and approved its final version.
Acknowledgments
We thank Dr. Tommaso Russo for critical reading of the manuscript, and Drs. Lutz Langbein and Pierre Coulombe for providing anti-Krt15 and anti-Krt17 antibodies, respectively. We also thank Dr. Virginia Sybert for providing human samples and for her continuous encouragement. We thank the DIM facility at CEINGE for imaging microscopy. The financial support of Telethon, Italy (GGP09230) (C.M.), the National Foundation for Ectodermal Dysplasias (C.M., H.v.B., H.Z., M.I.K.), the Italian Association for Cancer Research (AIRC; IG 5348), the European Union: Epistem LSHB-CT-2005-019067 (H.v.B., H.Z.), the Healing Foundation UK, the Medical Research Council, UK (G0901539) (M.D., J.D.) and the NIH (AR054696) (M.I.K.) is gratefully acknowledged.
Supporting information is available at EMBO Molecular Medicine online.
The authors declare that they have no conflict of interest.
For more information
AEC syndrome in OMIM (Online Mendelian Inheritance in Man):
p63 gene link:
http://www.ncbi.nlm.nih.gov/gene/8626
Telethon Foundation:
National Foundation for Ectodermal Dysplasia (NFED):
Author's website:
Supplementary material
Detailed facts of importance to specialist readers are published as ”Supporting Information”. Such documents are peer-reviewed, but not copy-edited or typeset. They are made available as submitted by the authors.
References
- Antonini D, Russo MT, De Rosa L, Gorrese M, Del Vecchio L, Missero C. Transcriptional repression of miR-34 family contributes to p63-mediated cell cycle progression in epidermal cells. J Invest Dermatol. 2010;130:1249–1257. doi: 10.1038/jid.2009.438. [DOI] [PubMed] [Google Scholar]
- Bell O, Tiwari VK, Thoma NH, Schubeler D. Determinants and dynamics of genome accessibility. Nat Rev Genet. 2011;12:554–564. doi: 10.1038/nrg3017. [DOI] [PubMed] [Google Scholar]
- Browne G, Cipollone R, Lena AM, Serra V, Zhou H, van Bokhoven H, Dotsch V, Merico D, Mantovani R, Terrinoni A, et al. Differential altered stability and transcriptional activity of DeltaNp63 mutants in distinct ectodermal dysplasias. J Cell Sci. 2011;124:2200–2207. doi: 10.1242/jcs.079327. [DOI] [PubMed] [Google Scholar]
- Candi E, Rufini A, Terrinoni A, Giamboi-Miraglia A, Lena AM, Mantovani R, Knight R, Melino G. DeltaNp63 regulates thymic development through enhanced expression of FgfR2 and Jag2. Proc Natl Acad Sci USA. 2007;104:11999–12004. doi: 10.1073/pnas.0703458104. [DOI] [PMC free article] [PubMed] [Google Scholar]
- Carroll DK, Carroll JS, Leong CO, Cheng F, Brown M, Mills AA, Brugge JS, Ellisen LW. p63 regulates an adhesion programme and cell survival in epithelial cells. Nat Cell Biol. 2006;8:551–561. doi: 10.1038/ncb1420. [DOI] [PubMed] [Google Scholar]
- Cha JY, Maddileti S, Mitin N, Harden TK, Der CJ. Aberrant receptor internalization and enhanced FRS2-dependent signaling contribute to the transforming activity of the fibroblast growth factor receptor 2 IIIb C3 isoform. J Biol Chem. 2009;284:6227–6240. doi: 10.1074/jbc.M803998200. [DOI] [PMC free article] [PubMed] [Google Scholar]
- Chitayat D, Babul R, Silver MM, Jay V, Teshima IE, Babyn P, Becker LE. Terminal deletion of the long arm of chromosome 3 [46,XX,del(3)(q27–>qter)] Am J Med Genet. 1996;61:45–48. doi: 10.1002/(SICI)1096-8628(19960102)61:1<45::AID-AJMG9>3.0.CO;2-W. [DOI] [PubMed] [Google Scholar]
- De Moerlooze L, Spencer-Dene B, Revest JM, Hajihosseini M, Rosewell I, Dickson C. An important role for the IIIb isoform of fibroblast growth factor receptor 2 (FGFR2) in mesenchymal–epithelial signalling during mouse organogenesis. Development (Cambridge, England) 2000;127:483–492. doi: 10.1242/dev.127.3.483. [DOI] [PubMed] [Google Scholar]
- De Rosa L, Antonini D, Ferone G, Russo MT, Yu PB, Han R, Missero C. p63 suppresses non-epidermal lineage markers in a bone morphogenetic protein-dependent manner via repression of Smad7. J Biol Chem. 2009;284:30574–30582. doi: 10.1074/jbc.M109.049619. [DOI] [PMC free article] [PubMed] [Google Scholar]
- Della Gatta G, Bansal M, Ambesi-Impiombato A, Antonini D, Missero C, di Bernardo D. Direct targets of the TRP63 transcription factor revealed by a combination of gene expression profiling and reverse engineering. Genome Res. 2008;18:939–948. doi: 10.1101/gr.073601.107. [DOI] [PMC free article] [PubMed] [Google Scholar]
- Dishop MK, Bree AF, Hicks MJ. Pathologic changes of skin and hair in ankyloblepharon-ectodermal defects-cleft lip/palate (AEC) syndrome. Am J Med Genet. 2009;149A:1935–1941. doi: 10.1002/ajmg.a.32826. [DOI] [PubMed] [Google Scholar]
- Farrington F, Lausten L. Oral findings in ankyloblepharon-ectodermal dysplasia-cleft lip/palate (AEC) syndrome. Am J Med Genet. 2009;149A:1907–1909. doi: 10.1002/ajmg.a.32790. [DOI] [PubMed] [Google Scholar]
- Fete M, vanBokhoven H, Clements SE, McKeon F, Roop DR, Koster MI, Missero C, Attardi LD, Lombillo VA, Ratovitski E, et al. International Research Symposium on Ankyloblepharon-Ectodermal Defects-Cleft Lip/Palate (AEC) Syndrome. Am J Med Genet. 2009;149A:1885–1893. doi: 10.1002/ajmg.a.32761. [DOI] [PMC free article] [PubMed] [Google Scholar]
- Fomenkov A, Huang YP, Topaloglu O, Brechman A, Osada M, Fomenkova T, Yuriditsky E, Trink B, Sidransky D, Ratovitski E. P63 alpha mutations lead to aberrant splicing of keratinocyte growth factor receptor in the Hay–Wells syndrome. J Biol Chem. 2003;278:23906–23914. doi: 10.1074/jbc.M300746200. [DOI] [PubMed] [Google Scholar]
- Fuchs E. Finding one's niche in the skin. Cell Stem Cell. 2009;4:499–502. doi: 10.1016/j.stem.2009.05.001. [DOI] [PMC free article] [PubMed] [Google Scholar]
- Julapalli MR, Scher RK, Sybert VP, Siegfried EC, Bree AF. Dermatologic findings of ankyloblepharon-ectodermal defects-cleft lip/palate (AEC) syndrome. Am J Med Genet. 2009;149A:1900–1906. doi: 10.1002/ajmg.a.32797. [DOI] [PubMed] [Google Scholar]
- Koster MI, Kim S, Mills AA, DeMayo FJ, Roop DR. p63 is the molecular switch for initiation of an epithelial stratification program. Genes Dev. 2004;18:126–131. doi: 10.1101/gad.1165104. [DOI] [PMC free article] [PubMed] [Google Scholar]
- Koster MI, Dai D, Marinari B, Sano Y, Costanzo A, Karin M, Roop DR. p63 induces key target genes required for epidermal morphogenesis. Proc Natl Acad Sci USA. 2007;104:3255–3260. doi: 10.1073/pnas.0611376104. [DOI] [PMC free article] [PubMed] [Google Scholar]
- Koster MI, Marinari B, Payne AS, Kantaputra PN, Costanzo A, Roop DR. DeltaNp63 knockdown mice: a mouse model for AEC syndrome. Am J Med Genet. 2009;149A:1942–1947. doi: 10.1002/ajmg.a.32794. [DOI] [PMC free article] [PubMed] [Google Scholar]
- Kouwenhoven EN, van Heeringen SJ, Tena JJ, Oti M, Dutilh BE, Alonso ME, de la Calle-Mustienes E, Smeenk L, Rinne T, Parsaulian L, et al. Genome-wide profiling of p63 DNA-binding sites identifies an element that regulates gene expression during limb development in the 7q21 SHFM1 locus. PLoS Genet. 2010;6:e1001065. doi: 10.1371/journal.pgen.1001065. [DOI] [PMC free article] [PubMed] [Google Scholar]
- Laurikkala J, Mikkola ML, James M, Tummers M, Mills AA, Thesleff I. p63 regulates multiple signalling pathways required for ectodermal organogenesis and differentiation. Development (Cambridge, England) 2006;133:1553–1563. doi: 10.1242/dev.02325. [DOI] [PubMed] [Google Scholar]
- Leboeuf M, Terrell A, Trivedi S, Sinha S, Epstein JA, Olson EN, Morrisey EE, Millar SE. Hdac1 and Hdac2 act redundantly to control p63 and p53 functions in epidermal progenitor cells. Dev Cell. 2011;19:807–818. doi: 10.1016/j.devcel.2010.10.015. [DOI] [PMC free article] [PubMed] [Google Scholar]
- Liu Y, Lyle S, Yang Z, Cotsarelis G. Keratin 15 promoter targets putative epithelial stem cells in the hair follicle bulge. J Invest Dermatol. 2003;121:963–968. doi: 10.1046/j.1523-1747.2003.12600.x. [DOI] [PubMed] [Google Scholar]
- Lopardo T, Lo Iacono N, Marinari B, Giustizieri ML, Cyr DG, Merlo G, Crosti F, Costanzo A, Guerrini L. Claudin-1 is a p63 target gene with a crucial role in epithelial development. PLoS One. 2008;3:e2715. doi: 10.1371/journal.pone.0002715. [DOI] [PMC free article] [PubMed] [Google Scholar]
- Mandinova A, Kolev V, Neel V, Hu B, Stonely W, Lieb J, Wu X, Colli C, Han R, Pazin MJ, et al. A positive FGFR3/FOXN1 feedback loop underlies benign skin keratosis versus squamous cell carcinoma formation in humans. J Clin Invest. 2009;119:3127–3137. doi: 10.1172/JCI38543. [DOI] [PMC free article] [PubMed] [Google Scholar]
- Marinari B, Ballaro C, Koster MI, Giustizieri ML, Moretti F, Crosti F, Papoutsaki M, Karin M, Alema S, Chimenti S, et al. IKKalpha is a p63 transcriptional target involved in the pathogenesis of ectodermal dysplasias. J Invest Dermatol. 2009;129:60–69. doi: 10.1038/jid.2008.202. [DOI] [PubMed] [Google Scholar]
- McGrath JA, Duijf PH, Doetsch V, Irvine AD, de Waal R, Vanmolkot KR, Wessagowit V, Kelly A, Atherton DJ, Griffiths WA, et al. Hay–Wells syndrome is caused by heterozygous missense mutations in the SAM domain of p63. Hum Mol Genet. 2001;10:221–229. doi: 10.1093/hmg/10.3.221. [DOI] [PubMed] [Google Scholar]
- Mills AA, Zheng B, Wang XJ, Vogel H, Roop DR, Bradley A. p63 is a p53 homologue required for limb and epidermal morphogenesis. Nature. 1999;398:708–713. doi: 10.1038/19531. [DOI] [PubMed] [Google Scholar]
- Moretti F, Marinari B, Lo Iacono N, Botti E, Giunta A, Spallone G, Garaffo G, Vernersson-Lindahl E, Merlo G, Mills AA, et al. A regulatory feedback loop involving p63 and IRF6 links the pathogenesis of 2 genetically different human ectodermal dysplasias. J Clin Invest. 2010;120:1570–1577. doi: 10.1172/JCI40267. [DOI] [PMC free article] [PubMed] [Google Scholar]
- Nguyen BC, Lefort K, Mandinova A, Antonini D, Devgan V, Della G, Koster G, Zhang MI, Wang Z, Tommasi J, et al. Cross-regulation between Notch and p63 in keratinocyte commitment to differentiation. Genes Dev. 2006;20:1028–1042. doi: 10.1101/gad.1406006. [DOI] [PMC free article] [PubMed] [Google Scholar]
- Nowak JA, Polak L, Pasolli HA, Fuchs E. Hair follicle stem cells are specified and function in early skin morphogenesis. Cell Stem Cell. 2008;3:33–43. doi: 10.1016/j.stem.2008.05.009. [DOI] [PMC free article] [PubMed] [Google Scholar]
- Payne AS, Yan AC, Ilyas E, Li W, Seykora JT, Young TL, Pawel BR, Honig PJ, Camacho J, Imaizumi S, et al. Two novel TP63 mutations associated with the ankyloblepharon, ectodermal defects, and cleft lip and palate syndrome: a skin fragility phenotype. Arch Dermatol. 2005;141:1567–1573. doi: 10.1001/archderm.141.12.1567. [DOI] [PubMed] [Google Scholar]
- Petiot A, Conti FJ, Grose R, Revest JM, Hodivala-Dilke KM, Dickson C. A crucial role for Fgfr2-IIIb signalling in epidermal development and hair follicle patterning. Development (Cambridge, England) 2003;130:5493–5501. doi: 10.1242/dev.00788. [DOI] [PubMed] [Google Scholar]
- Rama P, Matuska S, Paganoni G, Spinelli A, De Luca M, Pellegrini G. Limbal stem-cell therapy and long-term corneal regeneration. N Engl J Med. 2010;363:147–155. doi: 10.1056/NEJMoa0905955. [DOI] [PubMed] [Google Scholar]
- Revest JM, Spencer-Dene B, Kerr K, De Moerlooze L, Rosewell I, Dickson C. Fibroblast growth factor receptor 2-IIIb acts upstream of Shh and Fgf4 and is required for limb bud maintenance but not for the induction of Fgf8, Fgf10, Msx1, or Bmp4. Dev Biol. 2001;231:47–62. doi: 10.1006/dbio.2000.0144. [DOI] [PubMed] [Google Scholar]
- Rice R, Spencer-Dene B, Connor EC, Gritli-Linde A, McMahon AP, Dickson C, Thesleff I, Rice DP. Disruption of Fgf10/Fgfr2b-coordinated epithelial–mesenchymal interactions causes cleft palate. J Clin Invest. 2004;113:1692–1700. doi: 10.1172/JCI20384. [DOI] [PMC free article] [PubMed] [Google Scholar]
- Rinne T, Bolat E, Meijer R, Scheffer H, van Bokhoven H. Spectrum of p63 mutations in a selected patient cohort affected with ankyloblepharon-ectodermal defects-cleft lip/palate syndrome (AEC) Am J Med Genet. 2009;149A:1948–1951. doi: 10.1002/ajmg.a.32793. [DOI] [PubMed] [Google Scholar]
- Senoo M, Pinto F, Crum CP, McKeon F. p63 Is essential for the proliferative potential of stem cells in stratified epithelia. Cell. 2007;129:523–536. doi: 10.1016/j.cell.2007.02.045. [DOI] [PubMed] [Google Scholar]
- Stachelscheid H, Ibrahim H, Koch L, Schmitz A, Tscharntke M, Wunderlich FT, Scott J, Michels C, Wickenhauser C, Haase I, et al. Epidermal insulin/IGF-1 signalling control interfollicular morphogenesis and proliferative potential through Rac activation. EMBO J. 2008;27:2091–2101. doi: 10.1038/emboj.2008.141. [DOI] [PMC free article] [PubMed] [Google Scholar]
- Strachan LR, Scalapino KJ, Lawrence HJ, Ghadially R. Rapid adhesion to collagen isolates murine keratinocytes with limited long-term repopulating ability in vivo despite high clonogenicity in vitro. Stem Cells. 2008;26:235–243. doi: 10.1634/stemcells.2007-0534. [DOI] [PubMed] [Google Scholar]
- Su X, Cho MS, Gi YJ, Ayanga BA, Sherr CJ, Flores ER. Rescue of key features of the p63-null epithelial phenotype by inactivation of Ink4a and Arf. EMBO J. 2009;28:1904–1915. doi: 10.1038/emboj.2009.151. [DOI] [PMC free article] [PubMed] [Google Scholar]
- Tani H, Morris RJ, Kaur P. Enrichment for murine keratinocyte stem cells based on cell surface phenotype. Proc Natl Acad Sci USA. 2000;97:10960–10965. doi: 10.1073/pnas.97.20.10960. [DOI] [PMC free article] [PubMed] [Google Scholar]
- Thomason HA, Dixon MJ, Dixon J. Facial clefting in Tp63 deficient mice results from altered Bmp4, Fgf8 and Shh signaling. Dev Biol. 2008;321:273–282. doi: 10.1016/j.ydbio.2008.06.030. [DOI] [PubMed] [Google Scholar]
- Truong AB, Kretz M, Ridky TW, Kimmel R, Khavari PA. p63 regulates proliferation and differentiation of developmentally mature keratinocytes. Genes Dev. 2006;20:3185–3197. doi: 10.1101/gad.1463206. [DOI] [PMC free article] [PubMed] [Google Scholar]
- Tumbar T, Guasch G, Greco V, Blanpain C, Lowry WE, Rendl M, Fuchs E. Defining the epithelial stem cell niche in skin. Science. 2004;303:359–363. doi: 10.1126/science.1092436. [DOI] [PMC free article] [PubMed] [Google Scholar]
- Vidal VP, Chaboissier MC, Lutzkendorf S, Cotsarelis G, Mill P, Hui CC, Ortonne N, Ortonne JP, Schedl A. Sox9 is essential for outer root sheath differentiation and the formation of the hair stem cell compartment. Curr Biol. 2005;15:1340–1351. doi: 10.1016/j.cub.2005.06.064. [DOI] [PubMed] [Google Scholar]
- Vigano MA, Lamartine J, Testoni B, Merico D, Alotto D, Castagnoli C, Robert A, Candi E, Melino G, Gidrol X, et al. New p63 targets in keratinocytes identified by a genome-wide approach. EMBO J. 2006;25:5105–5116. doi: 10.1038/sj.emboj.7601375. [DOI] [PMC free article] [PubMed] [Google Scholar]
- Watt FM, Jensen KB. Epidermal stem cell diversity and quiescence. EMBO Mol Med. 2009;1:260–267. doi: 10.1002/emmm.200900033. [DOI] [PMC free article] [PubMed] [Google Scholar]
- Wu G, Nomoto S, Hoque MO, Dracheva T, Osada M, Lee CC, Dong SM, Guo Z, Benoit N, Cohen Y, et al. DeltaNp63alpha and TAp63alpha regulate transcription of genes with distinct biological functions in cancer and development. Cancer Res. 2003;63:2351–2357. [PubMed] [Google Scholar]
- Yang A, Kaghad M, Wang Y, Gillett E, Fleming MD, Dotsch V, Andrews NC, Caput D, McKeon F. p63, a p53 homolog at 3q27-29, encodes multiple products with transactivating, death-inducing, and dominant-negative activities. Mol Cell. 1998;2:305–316. doi: 10.1016/s1097-2765(00)80275-0. [DOI] [PubMed] [Google Scholar]
- Yang A, Schweitzer R, Sun D, Kaghad M, Walker N, Bronson RT, Tabin C, Sharpe A, Caput D, Crum C, et al. p63 is essential for regenerative proliferation in limb, craniofacial and epithelial development. Nature. 1999;398:714–718. doi: 10.1038/19539. [DOI] [PubMed] [Google Scholar]
- Yang A, Zhu Z, Kapranov P, McKeon F, Church GM, Gingeras TR, Struhl K. Relationships between p63 binding, DNA sequence, transcription activity, and biological function in human cells. Mol Cell. 2006;24:593–602. doi: 10.1016/j.molcel.2006.10.018. [DOI] [PubMed] [Google Scholar]
Associated Data
This section collects any data citations, data availability statements, or supplementary materials included in this article.