Abstract
Elasticity imaging methods have been used to study tissue mechanical properties and have demonstrated that tissue elasticity changes with disease state. In current shear wave elasticity imaging methods typically only shear wave speed is measured and rheological models, e.g., Kelvin-Voigt, Maxwell and Standard Linear Solid, are used to solve for tissue mechanical properties such as the shear viscoelastic complex modulus. This paper presents a method to quantify viscoelastic material properties in a model-independent way by estimating the complex shear elastic modulus over a wide frequency range using time-dependent creep response induced by acoustic radiation force. This radiation force induced creep (RFIC) method uses a conversion formula that is the analytic solution of a constitutive equation. The proposed method in combination with Shearwave Dispersion Ultrasound Vibrometry (SDUV) is used to measure the complex modulus so that knowledge of the applied radiation force magnitude is not necessary. The conversion formula is shown to be sensitive to sampling frequency and the first reliable measure in time according to numerical simulations using the Kelvin-Voigt model creep strain and compliance. Representative model-free shear complex moduli from homogeneous tissue mimicking phantoms and one excised swine kidney were obtained. This work proposes a novel model-free ultrasound-based elasticity method that does not require a rheological model with associated fitting requirements.
1. Introduction
Tissue mechanical properties, such as elasticity, are linked to tissue pathology state (Mariappan et al., 2010; Huwart et al., 2008; Huwart et al., 2007; Arndt et al., 2010; Parker et al., 2011). Several methods have been developed to measure tissue mechanical properties noninvasively. The first proposed elasticity imaging methods, such as ultrasound elastography and Acoustic Radiation Force Impulse imaging (ARFI), provide qualitative measures of tissue stiffness based on the assumption that tissue elasticity is related to measured deformation (Ophir et al., 1999; Nightingale, 2003). One of the limitations of such methods is the fact that the stress and boundary conditions need to be considered to quantify the tissue elasticity. To overcome this limitation, elasticity imaging methods such as Magnetic Resonance Elastography (MRE), Shear Wave Elasticity Imaging (SWEI), Transient Elastography (TE), Supersonic Shear Imaging (SSI) and Shearwave Dispersion Ultrasound Vibrometry (SDUV), have been proposed to quantify tissue mechanical properties based on the propagation of shear waves (Muthupillai et al., 1995; Sarvazyan et al., 1998; Sandrin et al., 2003; Bercoff et al., 2004; Chen et al., 2009).
Shear waves are usually generated by external mechanical vibration or by acoustic radiation force from a focused ultrasound beam (Nightingale et al., 2001; Muthupillai et al., 1995). In the ultrasound-based methods mentioned above, shear waves that result from a transient (impulsive or short tone burst) excitation of tissue propagate only a few millimeters, as a result of tissue absorption and shear wave attenuation, therefore boundary condition problems are overcome, allowing us to assume that the shear waves propagate as if in an infinite medium. The advantage of using acoustic radiation force is that if an acoustic window is available then the ultrasound system can create a focused beam to apply radiation force to push on tissue.
Although these methods initially consider a pure elastic medium to describe the tissue mechanical properties, some of them have been extended to quantify tissue viscoelastic properties based on the characteristic that tissue exhibits time-dependent behavior known as viscoelastic behavior (Fung, 1993). Tissue viscoelastic properties, such as shear elasticity and viscosity, are measured in a model-dependent manner by means of fitting a rheological model, e.g., Kelvin-Voigt, Maxwell and Standard Linear Solid, to shear wave speed dispersion (Chen et al., 2009; Deffieux et al., 2009) or in a model-independent manner if both shear wave speed and attenuation are known (Oliphant et al., 2001; Catheline et al., 2004). Although measuring shear wave speed attenuation is challenging in the field of elasticity imaging, a method called Harmonic Motion Imaging proposes to estimate shear wave attenuation from phase shift between input force and shear stress (Vappou et al., 2009).
Acoustic radiation force has been used to study quasi-static viscoelastic properties of tissue during creep and relaxation conditions. Tissue creep response to an applied step-force by means of external compression (Sridhar and Insana, 2007; Qiu et al., 2008) and acoustic radiation force has been shown in several studies (Walker et al., 2000; Viola and Walker, 2003; Nightingale et al., 2001; Mauldin et al., 2008). Mauldin, et al. (2008) have reported a method to estimate tissue viscoelastic properties by monitoring the steady-state excitation and recovery of tissues using acoustic radiation force imaging and shear wave elasticity imaging. This method, called monitored steady-state excitation and recovery (MSSER) imaging, is a noninvasive radiation force-based method that estimates viscoelastic parameters by fitting rheological models, Kelvin-Voigt and Standard Linear Solid model, to the experimental creep strain response. However, as with shear wave propagation methods, a rheological model needs to be fit to the MSSER experimental data to solve for viscoelastic parameters.
Current shear wave imaging techniques are useful to identify tissue linear viscoelastic properties, however to quantify these properties a rheological model must be used. This paper presents a method to quantify viscoelastic properties in a model-independent way by estimating complex elastic modulus from time-dependant creep response induced by acoustic radiation force. The creep response is generated as described in MSSER imaging method and the viscoelastic parameters, complex elastic modulus and loss tangent, are estimated by using a formula that converts time-domain creep compliance to frequency-domain complex modulus developed by Evans, et al. (Evans et al., 2009) then shear wave measurements using SDUV (Chen et al., 2009; Chen et al., 2004) are used to calibrate the complex modulus. Using this shear wave method to calibrate the modulus makes the method independent of needing to know the applied radiation force magnitude and spatial distribution. Experimental data are obtained in homogeneous tissue mimicking phantoms and one excised swine kidney.
2. Theory
2.1. Complex modulus spectrum from creep compliance
Transient characteristics of viscoelastic materials are known as creep and stress relaxation. Creep is a slow, progressive deformation of a material under constant stress. In a shear creep test, the ratio between the unitless measured shear strain response, γ(t), and the applied constant shear stress, τ0 [N/m2], is called the creep compliance, J(t) [m2/N]. By using the Boltzmann superposition principle, which states that the sum of the strain outputs resulting from each component of the stress input is the same as the strain output resulting from the combined stress input, the strain output under variable stress, τ(t), is (Findley et al., 1989):
| (1) |
where γ is shear strain, τ is shear stress, J is creep compliance and ∂[·]/∂ξ represents the first derivative respect to the independent variable ξ. Equation (1) is known as the integral representation of viscoelastic constitutive equations (Findley et al., 1989) and illustrates how the complex shear modulus, G*(ω) [N/m2], is related to the time-domain creep compliance, J(t), by a convolution operation. This relationship becomes much clearer (4) when using the Fourier transform convolution and derivative properties in (1)
| (2) |
| (3) |
| (4) |
where FT[.] represents the Fourier transform. Because creep compliance, J(t), is a function that grows with increasing time, its Fourier transform is not a convergent integral. Recently, Evans, et al. have reported the analytic solution of (4) by taking advantage of the properties of Fourier transform (Evans et al., 2009). Briefly, the second derivative of the creep compliance vanishes with time, therefore its Fourier transform exists. The time-creep compliance to complex modulus conversion formula described by Evans, et al. is (Evans et al., 2009):
| (5) |
where J(0) and η are the compliance at n = 0 and the steady-state viscosity, respectively. The value of J(0) is estimated by extrapolation of the compliance function to t → 0. Similarly, η is estimated by extrapolation of compliance function to t → ∞. The frequency range of G*(ω) depends on the temporal resolution (the time of the first data point, t(1)) and duration (the time of the last data point, t(N)) of the data set. The advantage of using (5) to convert time-dependent compliance, J(t), to complex shear modulus, G*(ω), is the fact that no fitting of theoretical models is required. Thus the moduli can be recovered for a range of frequencies without a model.
2.2. Displacement and creep compliance relation
Acoustic radiation force can be used to apply a step-stress input, τ0, that causes creep in a viscoelastic material (Nightingale et al., 2001; Mauldin et al., 2008; Walker et al., 2000; Viola and Walker, 2003). The displacement, u(t), and creep compliance, J(t), relation is then described in (6), where γ(t) is the unitless measured creep strain defined as measured displacement u(t) [m] per unit length L [m], assuming that geometry and boundary conditions do not change with time, and τ0 [N/m2] is the applied stress defined as applied force, F0 [N], per unit area A [m2]. However, the actual applied force, F0, is generally unknown; as a consequence, the magnitude of the applied stress, τ0, is also unknown. In addition, ultrasound motion detection applications usually estimate displacement responses instead of strain response.
| (6) |
Assuming that the material is linear, the creep compliance, J(t), is then linearly proportional to displacement, u(t):
| (7) |
where β [m/N] is a proportionality constant that relates the magnitude of the step-stress, F0/A, and the length of an infinitesimal cube, L. By combining (4) and (7), the complex shear modulus, G*(ω), can be extracted from the displacement, u(t), relative to the constant β:
| (8) |
If we call the extracted relative complex modulus, C*(ω) [1/m], it can be written in a form where C*(ω) and G*(ω) are related by the constant β:
| (9) |
where Gs(ω) and Gl(ω) are the real and imaginary parts of the complex shear modulus G*(ω). Gs(ω) is associated with energy storage and release during periodic deformation, therefore called the elastic or storage modulus (Findley et al., 1989). Gl(ω) is associated with the dissipation of energy that is transformed into heat, and is therefore called the viscous or loss modulus (Findley et al., 1989).
Because the magnitude of the acoustic radiation force, F = 2αI/c, is proportional to the absorption coefficient of the media, α, and the temporal average intensity of the acoustic beam at a given spatial location, I (Torr, 1984), in a homogenous material, the magnitude of the extracted relative complex modulus C*(ω) will vary as a function of material absorption and acoustic beam intensity, therefore, the extracted relative complex modulus C*(ω) would not be a very useful measure. To overcome this problem, a widely used property of viscoelastic materials called loss tangent or tan(δ), defined as the ratio between the loss modulus and the storage modulus, is used (Findley et al., 1989):
| (10) |
where Cs(ω) and Cl(ω) are the real and imaginary part of the extracted relative complex modulus C*(ω). The loss tangent or tan(δ) is associated with the damping capacity of viscoelastic material (Findley et al., 1989). In the following section a method to calibrate the function in (9) to solve for the actual complex modulus over a range of frequencies is described.
2.3. Complex modulus calibration with shear wave dispersion
The wavenumber, k, and the shear elastic modulus, G, are linked through the shear wave propagation equation. In an elastic medium, they are related by
| (11) |
where ρ is density of the medium and ω the angular frequency. In the case of linear viscoelastic medium the wave number, k, and shear elastic modulus, G, are complex, written as k* = kr − iki and G*(ω)=Gs(ω)+iGl(ω) (Blackstock, 2000). Then for a viscoelastic medium, (11) can be written as (Vappou et al., 2009):
| (12) |
| (13) |
where ρ is density, kr is the real part of the wave number (defined as kr = ω/cs, where cs is the shear wave speed), ki is the imaginary part of the wave number (defined as ki = αs, where αs is shear wave attenuation), Gs is the storage shear modulus or shear elastic modulus and Gl is the loss shear modulus or shear viscous modulus. The loss tangent or tan(δ) written in terms of the complex wave number is (Vappou et al., 2009):
| (14) |
If both tan(δ) and kr are known, the negative root for ki in (14) is (Vappou et al., 2009):
| (15) |
Finally, by knowing kr and ki, the shear storage and loss moduli are obtained from (12) and (13). In the following section applications of these methods for obtaining the complex modulus without a model are described.
3. Methods
3.1. Radiation force induced creep (RFIC)
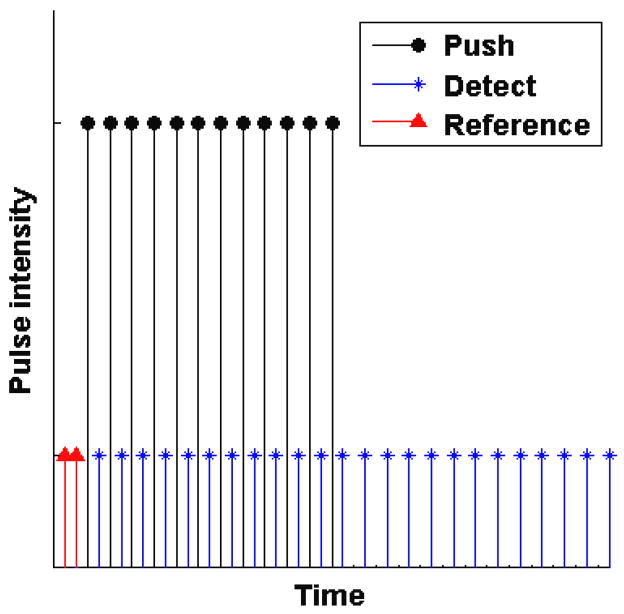
A Verasonics V-1 ultrasound system (Verasonics, Redmond, WA) equipped with a L7-4 linear array transducer (Philips Healthcare, Andover, MA) was used in all experiments. Similar to monitored steady-state excitation and recovery (MSSER) radiation force imaging previously described by Mauldin, et al., (Mauldin et al., 2008), two types of ultrasound beams are used. Figure 1 illustrates the beam sequence to induce and monitor creep and recovery. The symbols represent high intensity pushing beams (•) are interspersed with conventional B-mode tracking beams (*) during the creep period. This sequence generates a temporal step-force while creep displacements are tracked through the creep period. Additionally, two reference tracking beams (Δ) are used before the creep period and additional tracking beams following the cessation of the high intensity pushing beams.
Figure 1.
Illustration of the pulse sequences used to induce and monitor creep and recovery. The symbols represent pushing beams (●), detecting beams (*) and reference beams (△).
3.2. Shearwave Dispersion Ultrasound Vibrometry
SDUV is a method that quantifies both tissue shear elasticity and viscosity by evaluating dispersion of shear wave propagation speed over a certain bandwidth (Chen et al., 2009; Chen et al., 2004). The Verasonics V-1 ultrasound system equipped with a L7-4 linear array transducer was used to generate shear waves with acoustic radiation force and capture shear wave propagation with flash imaging (Montaldo et al., 2009). For a complete description of the SDUV method, see (Chen et al., 2009) and (Chen et al., 2004).
4. Simulation and experiment
4.1. Simulation
The purpose of the simulations was to test these methods using a known analytic model and to evaluate parameters affecting the performance of the creep compliance to complex modulus conversion formula, such as the effect of sampling frequency, Fs, and the first reliable data point, t1 (5). Creep compliance data were simulated by using a combination of viscoelastic parameters in the Kelvin-Voigt model. The values of these viscoelastic parameters are within a range of experimental values measured by ex vivo and in vivo SDUV studies in various soft tissues such as liver, prostate, kidney, and heart (Chen et al., 2009; Mitri et al., 2011; Amador et al., 2011; Nenadic et al., 2011) and human MRE studies in liver (Huwart et al., 2006; Huwart et al., 2007). Equation (16) describe the Kelvin-Voigt model creep compliance, JKV(t), under step-stress input, τ0 (Findley et al., 1989):
| (16) |
where G is the elastic element property as shear modulus and η is viscous element property as viscosity. The complex shear modulus, G*(ω) = Gs(ω) + iGl(ω), for the Kelvin-Voigt model is described in (17) and (18) (Findley et al., 1989).
| (17) |
| (18) |
For a given combination of G and η for the Kelvin-Voigt model, creep compliance and complex shear modulus were calculated.
Once the creep compliance response was generated, the conversion formula (5) was used to estimate the complex shear modulus, , from the simulated creep compliance, (16). The conversion formula results were compared to the theoretical complex shear modulus, , described in (17) and (18), by calculating the magnitude of the complex modulus, , and computing the normalized mean absolute error (nMAE), between the magnitude of the theoretical complex shear modulus, , and the magnitude of the complex shear modulus recovered from the conversion formula, . The normalized mean absolute error is defined as:
| (19) |
Additionally, these simulations were used to illustrated the concept of tan(δ). The conversion formula was applied to both creep compliance and creep strain. All simulations were performed in MATLAB (The MathWorks, Inc., Natick, MA).
4.2. Experiment
Two homogeneous elasticity phantoms (custom-made by CIRS, Inc., Norfolk, VA) and one excised swine kidney were used in this study. Each phantom had dimensions of 10 × 10 × 8 cm3 (width, depth, height) and the speed and attenuation of sound (claimed by CIRS, Inc.) in phantom 1 was, 1538.1 m/s and 0.42 dB/cm-MHz, and phantom 2 was 1539 m/s and 0.43 dB/cm-MHz, respectively. The kidney was removed immediately after sacrifice and placed in saline solution at room temperature.
4.2.1. Radiation force induced creep
The pulse repetition frequency (PRF) for both pushing and tracking pulses was 6.25 kHz. The total duration of the creep period or pushing sequences, including the intermittent tracking beams, was 10 ms and the total acquisition time was 20 ms (63 pushing beams and 126 tracking beams). The magnitude of the mimicked temporal step-force was varied by increasing the length of the pushing beams. The pushing beam intensity was set at 8 cycles (1.6 μs) and 16 cycles (3.2 μs), the tracking beam intensity was set at 2 cycles (0.4 μs). Both pushing and tracking beams were at 5 MHz center frequency and focused at an axial distance of 20 mm with an F/1.0 focal configuration. The acoustic radiation force creep sequence was used in 5 different regions of the phantoms and the kidney, and 5 repeated measurements were acquired at each region. The transducer was manually translated to the 5 different locations. These 5 different locations were randomly selected. A 2D autocorrelation method was used to calculate axial displacements (Kasai et al., 1985).
4.2.2. Shearwave dispersion ultrasound vibrometry
A 331 μs duration push beam was transmitted and focused at 20 mm to generate shear waves in the medium. The shear wave propagation was measured with the same transducer with plane wave compounding imaging technique (Montaldo et al., 2009). A set of 5 plane waves with different emission angles were transmitted at 12.5 kHz PRF. By coherently compounding each set of 5 plane waves, a compound image PRF of 2.5 kHz was produced. The spatial resolution in x-direction and z-direction were 0.15 mm and 0.15 mm respectively. Displacement response is estimated using 2-D autocorrelation between two images (Kasai et al., 1985). Shear wave phase velocity was estimated by previously described two–dimensional Fourier transform method (Bernal et al., 2011; Alleyne, 1991). Shear wave speed thus measured at several frequencies (100–500 Hz) is used to inversely solve for complex modulus through a Kelvin-Voigt dispersion model:
| (20) |
The estimated shear elastic modulus, G, and viscosity, η, are then used to calculate Kelvin-Voigt model shear complex modulus which then is compared to the model-independent complex modulus.
5. Results
5.1. Simulations
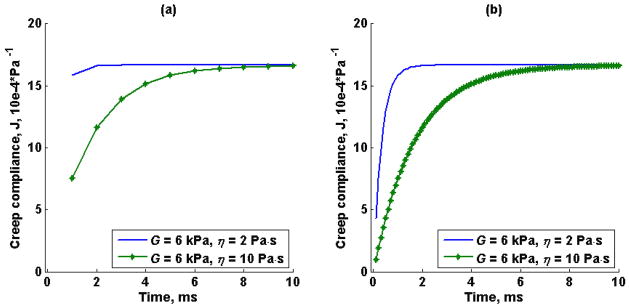
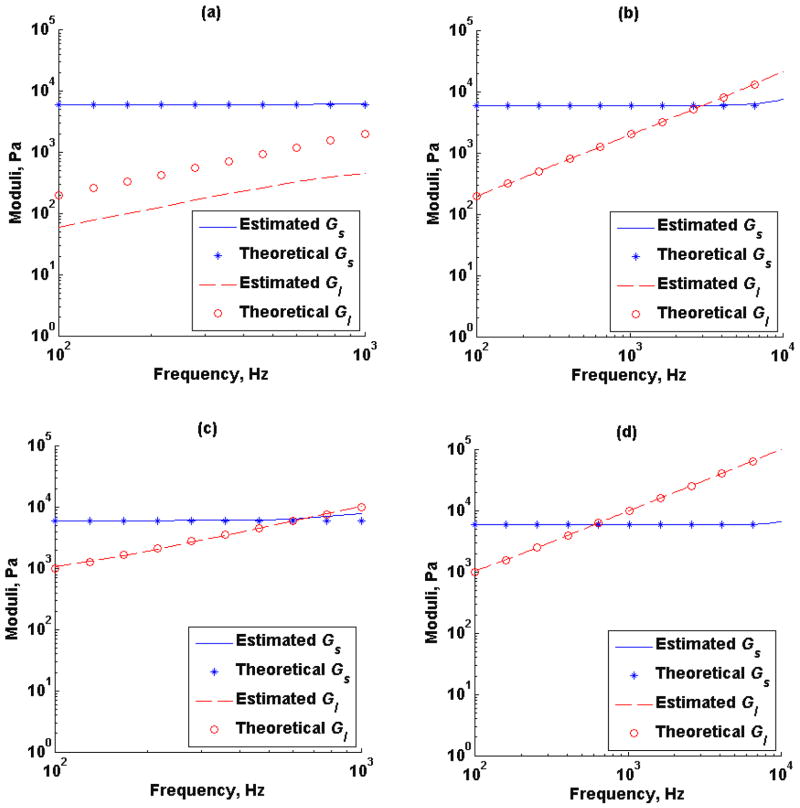
Figure 2 illustrates the effect of temporal resolution in the Kelvin-Voigt model creep compliance for viscosity values, η, of 2 Pa·s and 10 Pa·s, with an elastic modulus, G, fixed at 6 kPa. Two different time vectors were used to simulate creep compliance response, 1 kHz (Figure 2a) and 10 kHz (Figure 2b) sampling frequency, Fs and t1 of 1 ms and 0.1 ms respectively. Similarly, the effect of temporal resolution in the time-creep compliance to complex modulus conversion formula (5) for the Kelvin-Voigt model creep compliance illustrated in Figure 2 was studied. Figure 3 illustrates both the estimated and theoretical storage modulus (-, *) and loss modulus (--, *) from the creep compliance generated at 1 kHz sampling frequency and 10 kHz sampling frequency respectively at fixed viscosity of 2 Pa·s (Figures 3a and 3b) and viscosity of 10 Pa·s (Figures 3c and 3d).
Figure 2.
Kelvin-Voigt model creep compliance for a shear elastic modulus, G, of 6 kPa and viscosity, η, of 2 Pa·s (-) and 10 Pa·s (-*). The time vector in (a) starts at t1 of 1 ms with a sampling rate, Fs, of 1 kHz. The time vector in (b) starts at t1 of 0.1 ms with a sampling rate of 10 kHz.
Figure 3.
Estimated and theoretical storage modulus (-, *), Gs, and loss modulus (--, o), Gl, as a function of frequency from Kelvin-Voigt model creep compliance for shear elastic modulus, G, of 6 kPa and viscosity, η, of 2 Pa·s and (a) sampling frequency, Fs, of 1 kHz, (b) sampling frequency, Fs, of 10 kHz. Viscosity, η, of 10 Pa·s and (c) sampling frequency, Fs, of 1 kHz, (d) sampling frequency, Fs, of 10 kHz.
The viscoelastic parameters used to simulate the Kelvin-Voigt model creep compliance curves shown in Figure 2 are summarized in Table I as well as the nMAE calculated from the magnitude of the estimated complex modulus and the magnitude of the theoretical complex modulus shown in Figure 3, as described in (19).
Table I.
Viscoelastic parameters used to simulate Kelvin-Voigt model creep compliance
| G (Pa) | η (Pa·s) | t1 (s) | tN (s) | Fs (Hz) | nMAE |
|---|---|---|---|---|---|
| 6000 | 10 | 0.001 | 0.01 | 1000 | 0.032 |
| 6000 | 2 | 0.001 | 0.01 | 1000 | 0.001 |
| 6000 | 10 | 0.0001 | 0.01 | 10000 | 0.00006 |
| 6000 | 2 | 0.0001 | 0.01 | 10000 | 0.00022 |
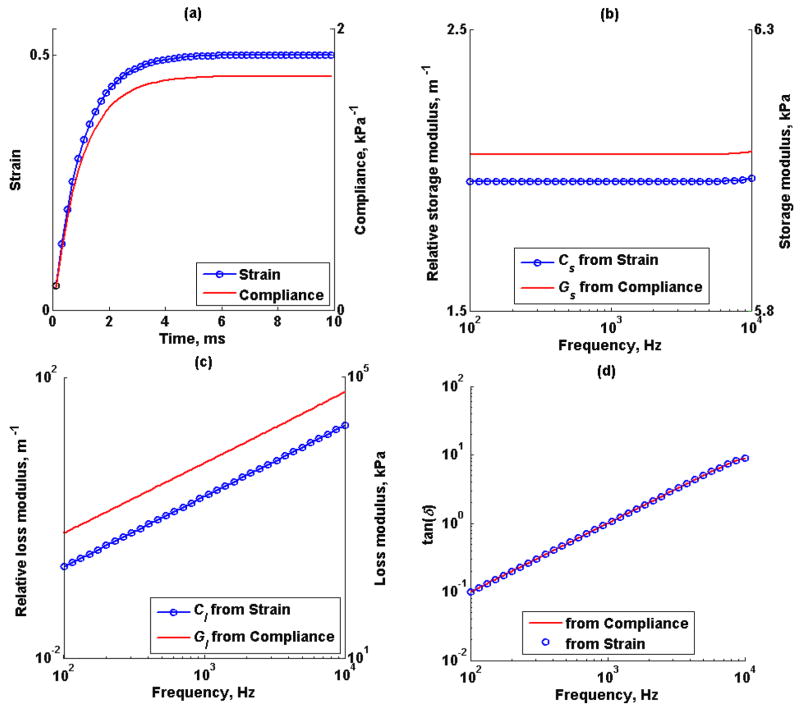
Figure 4a illustrates the Kelvin-Voigt model creep strain and compliance response to 3 kPa step-stress input, the elastic modulus G and viscosity η were fixed at 6 kPa and 6 Pa·s, the sampling frequency was 10 kHz. The conversion formula described in (5) was used to estimate the complex modulus from creep strain response and creep compliance response, Figures 4b and 4c. In this case, the extracted relative modulus from creep strain, C*(ω), is proportional to the extracted modulus from creep compliance, G*(ω), by a constant β which is related the applied step-stress magnitude. The tan(δ) or ratio between the storage modulus and loss modulus, from the extracted relative modulus C*(ω) and G*(ω) are shown in Figure 4d.
Figure 4.
Kelvin-Voigt model; (a) creep strain (o) and creep compliance (-) response of shear elastic modulus, G, of 6 kPa, and viscosity, η, of 6 Pa·s at 10 kHz sampling rate. (b) Estimated relative storage modulus from creep strain (o), Cs, and creep compliance (-), Gs. (c) Estimated relative loss modulus from creep strain, Cl, and creep compliance, Gl. (d) tan(δ) from estimated complex modulus using from creep strain (o) and creep compliance (-).
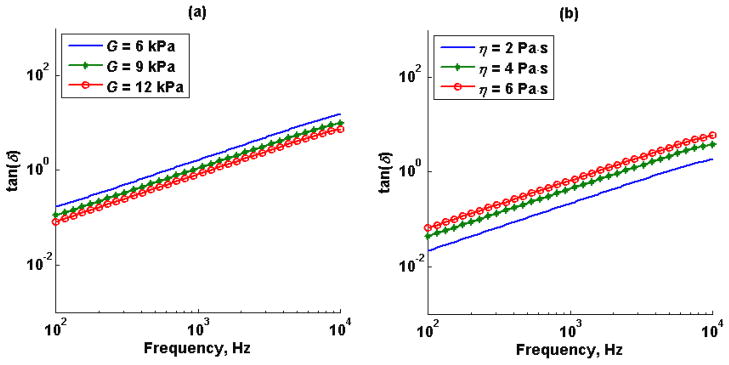
Figure 5 illustrates the Kelvin-Voigt model tan(δ) for (Figure 5a) fixed viscosity, η, and different shear elastic modulus, G, and (Figure 5b) fixed shear elastic modulus, G, and different viscosities, η.
Figure 5.
Kelvin-Voigt model tan(δ) for (a) fixed viscosity, η, at 10 Pa·s and shear elastic modulus, G, of 6 kPa (-), 9 kPa (*) and 12 kPa (o) at 10 kHz sampling rate; (b) fixed shear elastic modulus, G, at 9 kPa and viscosity, η, of 2 Pa·s (-), 4 Pa·s (*) and 6 Pa·s (o) at 10 kHz sampling rate.
5.2. Experiments
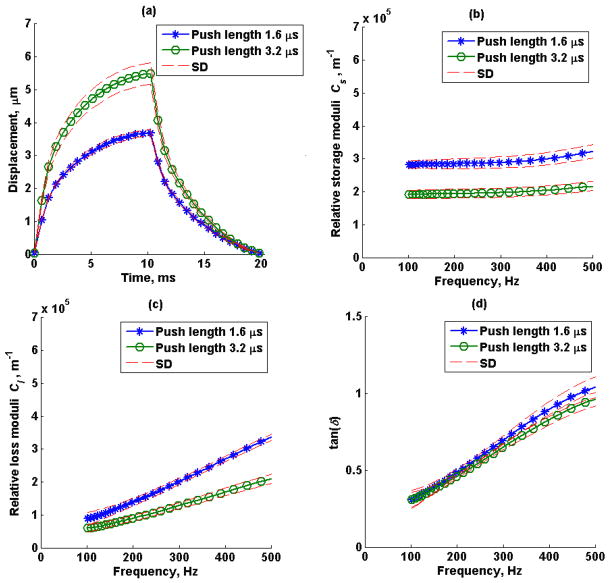
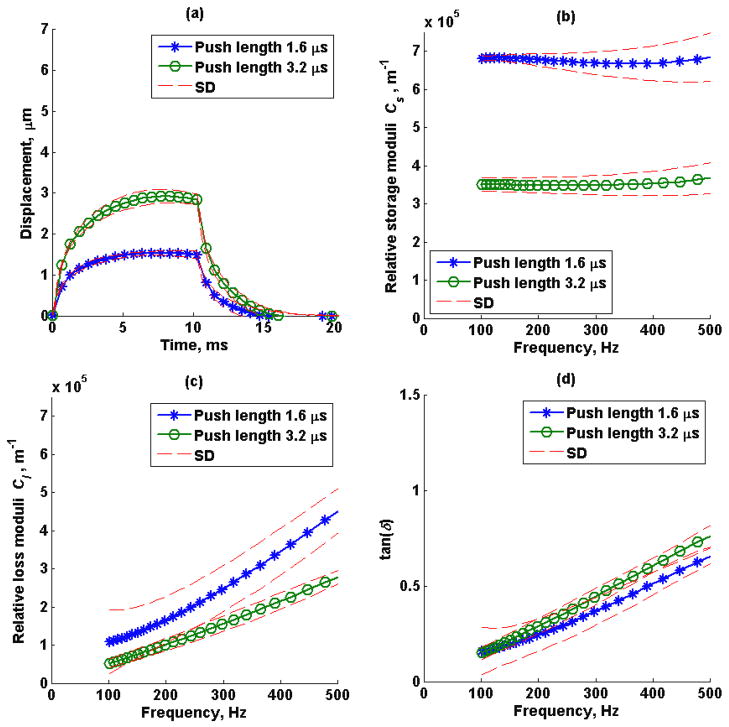
The mean (average of 5 repeated measurements) creep displacement response, estimated relative storage (Cs), loss modulus (Cl) and loss tangent (tan(δ)) from a 1.6 μs and 3.2 μs push duration in phantom 1 and phantom 2 are shown in Figure 6 and Figure 7, respectively. The dashed lines represent the standard deviation of the five repeated measurements.
Figure 6.
Phantom 1 (a) mean creep displacement, (b) estimated relative storage moduli, Cs, (c) estimated relative loss moduli, Cl, and (d) loss tangent, tan(δ), of a 1.6 μs (o) and 3.2 μs (*) push duration. Average of 5 repeated measurements over a window of 3 mm in axial direction and 1 mm in lateral direction. The dashed lines represent the standard deviation of 5 repeated measurements.
Figure 7.
Phantom 2 (a) mean creep displacement, (b) estimated relative storage moduli, Cs, (c) estimated relative loss moduli, Cl, and (d) loss tangent, tan(δ), of a 1.6 μs (o) and 3.2 μs (*) push duration. Average of 5 repeated measurements over a window of 3 mm in axial direction and 1 mm in lateral direction. The dashed lines represent the standard deviation of 5 repeated measurements.
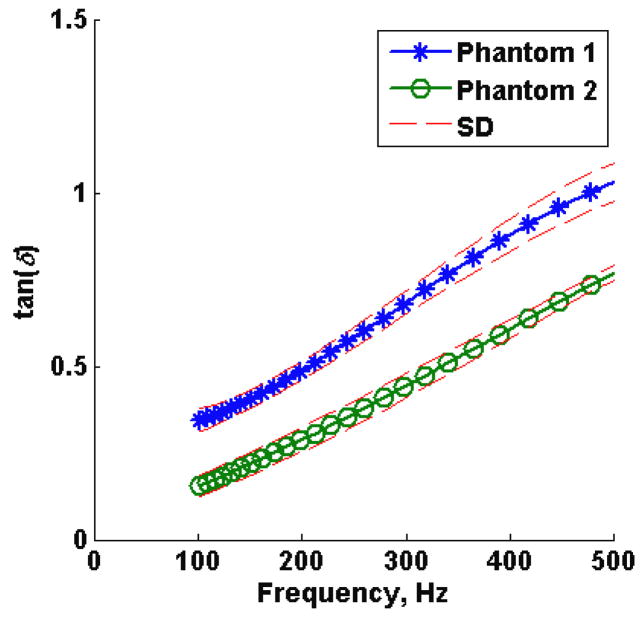
The mean loss tangent measured in five regions of interest using 3.2 μs push duration of phantom 1 and phantom 2 are shown in Figure 8. The dashed lines represent the standard deviation of 5 measured regions in each phantom.
Figure 8.
Loss tangent (average of 5 measured locations using 3.2 μs push duration) as a function of frequency for phantom 1 (*) and phantom 2 (o). The dashed lines represent the standard deviation of 5 measured locations in each phantom.
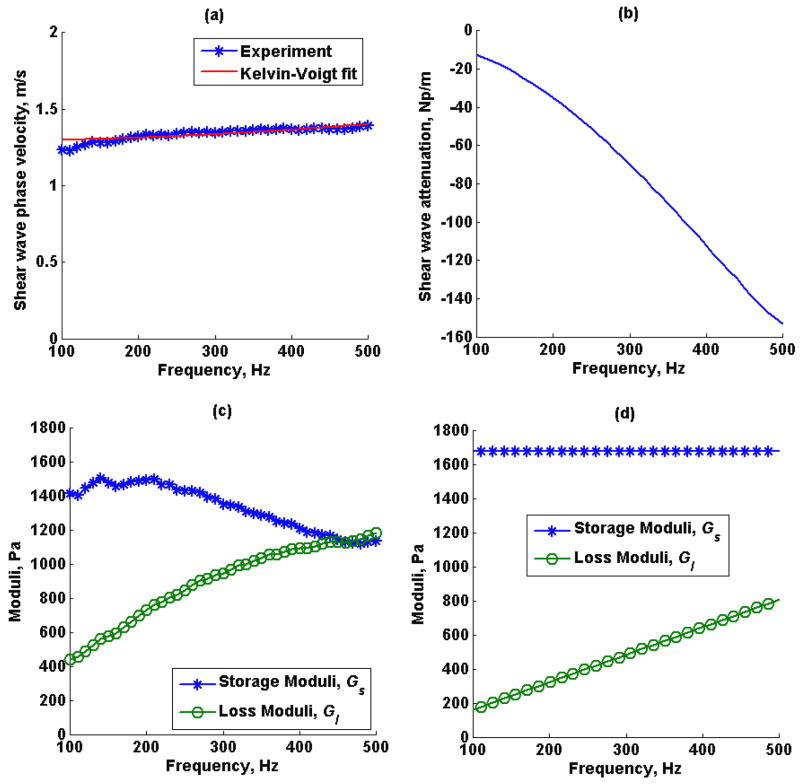
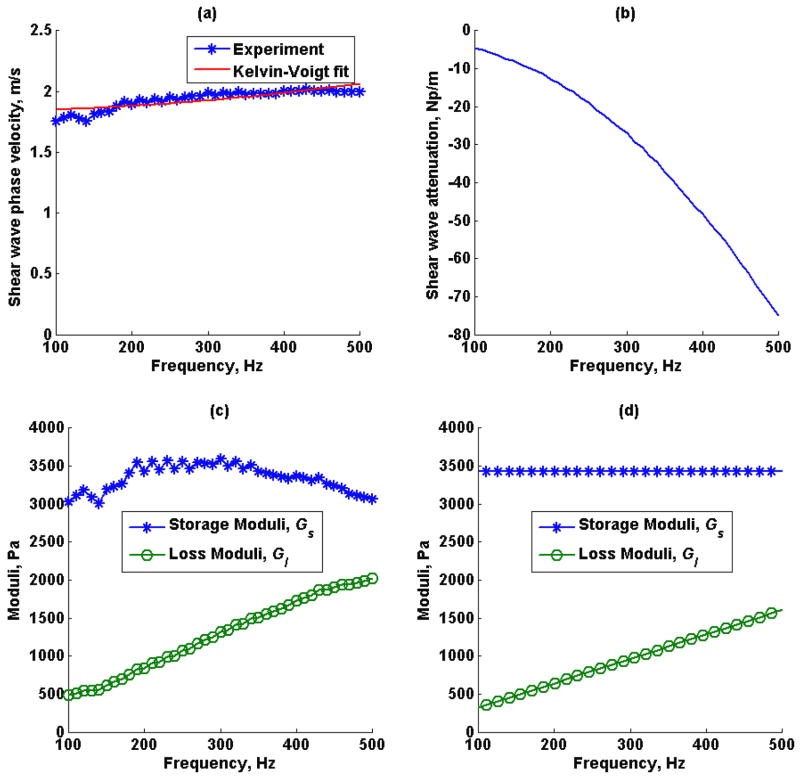
Shear wave speed dispersion measured by SDUV, the shear wave attenuation estimated by RFIC and SDUV using (15), the complex shear moduli calculated from shear wave speed and shear wave attenuation in (12) and (13), and complex moduli estimated by fitting a Kelvin-Voigt model to shear wave speed dispersion measured by SDUV in phantom 1 and phantom 2 are shown in Figures 9 and 10, respectively. The shear elastic modulus G and η from the Kelvin-Voigt model fit to shear wave dispersion were 1.67 kPa and 1.68 Pa·s for phantom 1 and 3.39 kPa and 4.01 Pa·s for phantom 2.
Figure 9.
Phantom 1 (a) shear wave speed dispersion estimated by SDUV, (b) shear wave attenuation estimated by SDUV and RFIC, (c) model-free complex moduli estimated by shear wave phase velocity and shear wave attenuation, (d) complex moduli estimated by Kelvin-Voigt model fit to SDUV shear wave speed dispersion.
Figure 10.
Phantom 2 (a) shear wave speed dispersion estimated by SDUV, (b) shear wave attenuation estimated by SDUV and RFIC, (c) model-free complex moduli estimated by shear wave phase velocity and shear wave attenuation, (d) complex moduli estimated by Kelvin-Voigt model fit to SDUV shear wave speed dispersion.
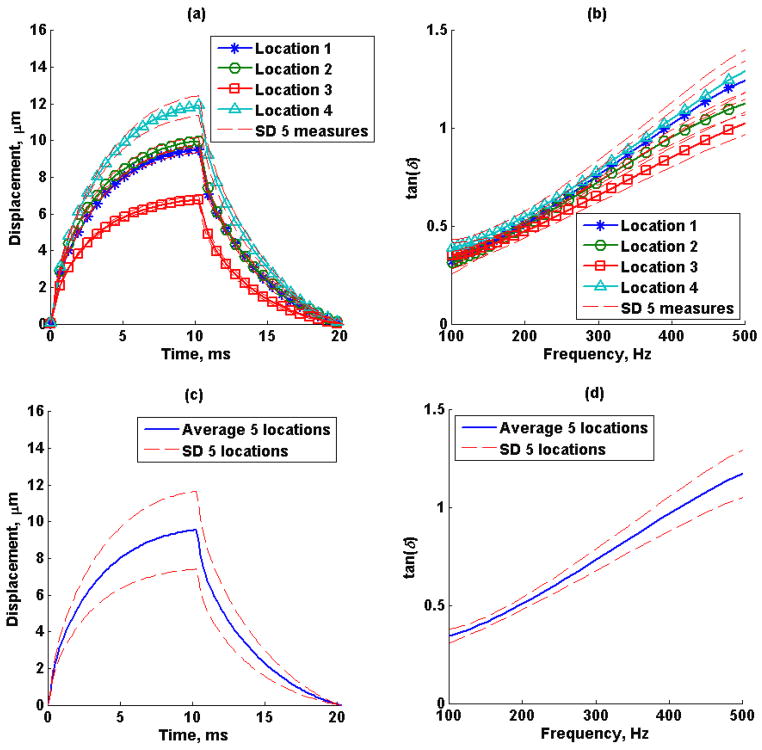
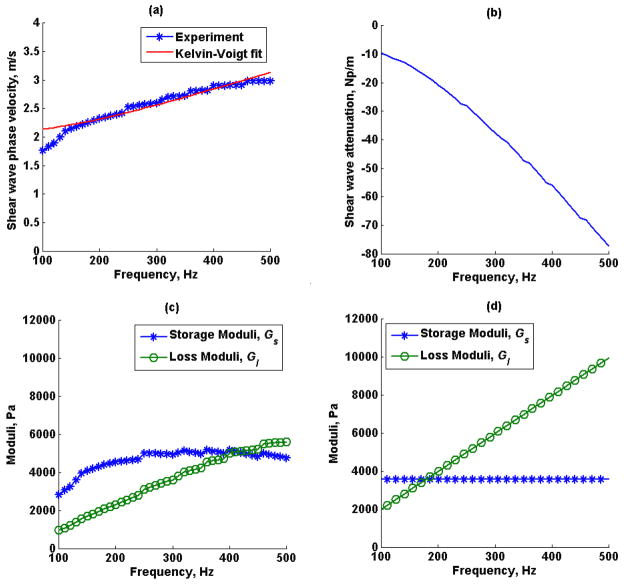
Figures 11a and 11b show the mean (average of 5 repeated measurements) creep displacement response and loss tangent (tan(δ)) from 5 locations in an excised swine kidney, respectively. The dashed lines represent the standard deviation of the five repeated measurements. Figures 11c and 11d show the average displacement and loss tangent of the 5 different locations, respectively. Shear wave speed dispersion measured by SDUV, the shear wave attenuation estimated by RFIC and SDUV, the complex shear moduli calculated from shear wave speed and shear wave attenuation, and complex moduli estimated by fitting a Kelvin-Voigt model to shear wave dispersion measured by SDUV in one excised swine kidney are shown in Figure 12. The shear elastic modulus G and η from the Kelvin-Voigt model fit to shear wave speed dispersion were 4.30 kPa and 12.70 Pa·s, respectively.
Figure 11.
Excised swine kidney (a) mean creep displacement, (b) estimated loss tangent of 5 repeated measurements in 4 locations, the dashed lines represent the standard deviation of 5 repeated measurements. (c) Mean creep displacement and (d) loss tangent of 5 locations, dashed lines represent the standard deviation of 4 locations.
Figure 12.
Excised swine kidney (a) shear wave speed dispersion estimated by SDUV, (b) shear wave attenuation estimated by SDUV and RFIC, (c) complex moduli estimated by shear wave phase velocity and shear wave attenuation, (d) complex moduli estimated by Kelvin-Voigt model fit to SDUV shear wave speed dispersion.
6. Discussion
Simulations showed that the new method of converting from creep compliance to complex modulus is robust when using a high sampling rate to study low viscosity materials. For the Kelvin-Voigt model, the discrepancies between the theoretical and estimated complex moduli associated with a low sampling rate in a low viscous medium seems to be present mostly in the loss modulus (refer to Figure 3a). These discrepancies are generally reduced but still appear at high frequencies when the viscosity is increased (refer to Figure 3c) and are not present when the sampling rate is increased (refer to Figures 3b and 3d). However, the mean absolute error was relatively small in all scenarios even when a lower sampling frequency was used.
As expected, the complex modulus estimated from simulated time-strain response is proportional to the complex modulus estimated from simulated time-compliance response as shown in Figures 4b and 4c. Unfortunately, the estimated complex modulus from creep-strain would not be a useful value if the proportionality constant β is unknown, even for homogeneous material. To overcome this limitation, a well known property of viscoelastic materials called the loss tangent or the ratio between the loss modulus and the storage modulus is used. Figure 4d illustrates the loss tangent calculated from both creep compliance and strain. Interestingly, the loss tangent calculated from complex modulus from creep strain agreed with the loss tangent calculated from complex modulus from creep compliance. Therefore, knowledge of the applied radiation force magnitude is not necessary to estimate the loss tangent.
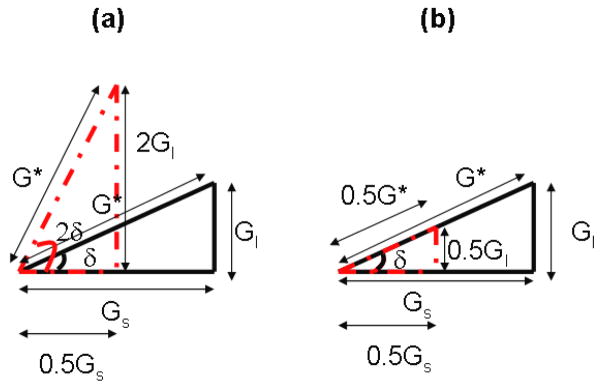
The loss tangent as a function of shear elastic modulus, G, and viscosity, η, for the Kelvin-Voigt model shown in Figure 5, illustrate that varying either storage or loss modulus is represented as a shift of the curve. More specifically, increasing the storage modulus for a fixed value of loss modulus shifted the loss tangent curve to the right, toward high frequencies; on the other hand, increasing the loss modulus for a fixed value of storage modulus shifted the loss tangent curve to the left toward lower frequencies. A potential limitation of the proposed method, measuring loss tangent of tissues to differentiate healthy tissue from disease tissue, is the case when both storage and loss modulus increase or decrease with the same proportion, in that case, the loss tangent does not change, but the magnitude of the complex modulus is different. Figure 13 shows a vector diagram with the relationship between complex modulus, storage modulus, loss modulus and loss angle.
Figure 13.
Vector diagrams of the relationship between loss angle, δ, complex modulus, G*, storage modulus, Gs, and loss modulus, Gl. The complex modulus, G*, is independent of tan(δ) when Gs and Gl change independently; (a) changing Gs and Gl in opposite direction cause tan(δ) to change and G* remains the same; (b) changing Gs and Gl in the same direction and magnitude causes G* to change but tan(δ) remains the same.
The complex modulus can be represented as the resultant vector of the storage modulus, Gs, and loss modulus, Gl, and their ratio is represented as tan(δ). The complex modulus is independent of tan(δ) when Gs and Gl change independently, for instance changing Gs and Gl in opposite direction cause G* to be the same and tan(δ) to change, Figure 13a, or changing Gs and Gl in the same direction and magnitude causes G* to change but tan(δ) remains the same, Figure 13b. Creep displacement responses shown in Figures 6 and 7 were obtained in the tissue-mimicking phantoms. When the magnitude of the radiation force was increased by a factor of 2 by using a longer pushing pulse, a proportional increase in displacement was observed in both phantoms, which is expected for linear viscoelastic materials as shown in Figures 6a and 7a. Moreover, the extracted relative complex modulus, C*(ω), was also proportional to the acoustic radiation force magnitude. Most importantly, the estimated loss tangent was independent of force magnitude and geometry, as shown theoretically and in simulations.
The tissue mimicking phantoms were expected to have different storage modulus and similar loss modulus, as reported by the manufacturer, this was illustrated in Figure 8, where the phantom 1 loss tangent was approximately 1.3 times the loss tangent of phantom 2, therefore phantom 1 is softer than phantom 2. Because there may be a case where loss tangent is the same for materials with different storage and loss modulus, as discussed in the previous paragraph, SDUV was used in combination with RFIC to estimate the true complex modulus as demonstrated in Figures 9 and 10. The calibrated complex modulus for both phantoms provides a more complete characterization of viscoelastic properties, and still in a model-free manner. A difference in both storage and loss modulus was seen for both phantoms, however, because the difference in storage modulus was higher compared to difference in loss modulus between the two phantoms, the loss tangent was still different for both phantoms. Shear wave elasticity methods usually fit a rheological model to shear wave speed to solve for viscoelastic parameters. In the Kelvin-Voigt model, the storage modulus is not a function of frequency, therefore the average model-free storage modulus over 100 Hz to 500 Hz would be comparable to the storage modulus estimated from Kelvin-Voigt model fit to shear wave speed dispersion. The average model-free storage modulus over this frequency range was 1.33 ± 0.13 kPa for phantom 1 and 3.34 ± 0.17 kPa for phantom 2. Although the shear elastic modulus from Kelvin-Voigt model fit, 1.67 kPa and 3.39 kPa for phantom 1 and 2 respectively, are approximately within the average model-free shear elastic modulus, by inspection, the model-free shear elastic modulus does vary as a function of frequency in both phantoms. On the other hand, in the Kelvin-Voigt model, the loss modulus is a function of frequency, therefore the slope of the model-free loss modulus would be comparable to the loss modulus estimated from Kelvin-Voigt model fit to shear wave speed dispersion. The slope of the model-free loss modulus was 1.84 Pa·s for phantom 1 and 4.18 Pa·s for phantom 2. The Kelvin-Voigt model fit viscosity from the shear wave speed measurements was 1.68 Pa·s and 4.01 Pa·s for phantoms 1 and 2 respectively, and model-free loss modulus slope are within the same order of magnitude in both phantoms. The Kelvin-Voigt model fit the loss modulus from the SDUV measurements are shifted towards high frequencies when compared to the model–free loss modulus.
The excised swine kidney loss tangent for different regions of interest in the renal cortex was expected to be different because the kidney is highly inhomogeneous. Although these preliminary data do not show a significant difference in loss tangent for different locations in the kidney, in vitro SDUV studies in swine kidney have shown that kidney viscoelastic properties within an organ are typically similar (Amador et al., 2011). The calibrated complex modulus with SDUV illustrates a linear loss modulus, as in the case of a Kelvin-Voigt model, but shifted and a rather variant storage modulus with frequency.
Although the conversion formula (5) introduced by Evans, et al. returns a complex modulus in a range of frequencies that depends on the resolution (first reliable data point at t1) and duration (tN) of the measured creep data set, the upper limit of the measured relative complex modulus was set to 500 Hz because the simulations showed that the output of the conversion formula is biased at high frequencies when the sampling frequency is too low to capture creep displacements for not so viscous materials. In addition, the frequency range of the model-free complex modulus depends on the frequency range of the shear wave speed dispersion, which is usually from 100 Hz to 500 Hz.
In this paper, we described and validated a method to fully quantify regional viscoelastic properties in a manner independent of models by using RFIC and SDUV. Previous work in this area involved the use of rheological models, but the need for such models affects the viscoelastic parameter estimation as well as the fitting process. The described RFIC method, uses a conversion formula that is the analytic solution of a constitutive equation. This conversion formula is shown to be sensitive to sampling frequency and the first reliable measure in time. A more comprehensive study is needed to evaluate such parameters in biological tissue applications. Clinical applications of this novel method are could be easily explored because it only requires pushing beams similar to the acoustic radiation force impulse imaging (ARFI) method, which is currently implemented on commercial ultrasound scanning machines. Most importantly, the push beams are comparable to Doppler pulses, therefore this method is compatible with most ultrasound scanners and tissue heating is expected to be below FDA limits. Future work will focus in both in vitro and in vivo tissue viscoelastic properties estimation by RFIC and SDUV.
7. Conclusion
Very few methods have been proposed to characterize tissue mechanical properties in a model-independent manner. The method presented in this paper is a novel approach to overcome difficulties encountered with rheological model and fitting approaches. Acoustic radiation force creep in combination with a creep-compliance to complex modulus conversion formula provides a non-invasive, fast, robust and local measure of tissue viscoelasticity.
Acknowledgments
The project described was supported by grants R01EB002167 and R01EB002640 from the National Institute of Biomedical Imaging and Bioengineering. The content is solely the responsibility of the authors and does not necessarily represent the official views of the National Institute of Biomedical Imaging and Bioengineering or the National Institutes of Health.
References
- Alleyne D. A two-dimensional Fourier transform method for the measurement of propagating multimode signals. J Acoust Soc Am. 1991:89. [Google Scholar]
- Amador C, Urban MW, Chen S, Greenleaf J. Shearwave Dispersion Ultrasound Vibrometry (SDUV) on swine kidney. IEEE Trans Ultrason, Ferroelect, Freq Contr. 2011 doi: 10.1109/TUFFC.2011.2124. in press. [DOI] [PMC free article] [PubMed] [Google Scholar]
- Arndt R, Schmidt S, Loddenkemper C, Grunbaum M, Zidek W, van der Giet M, Westhoff TH. Noninvasive evaluation of renal allograft fibrosis by transient elastography - a pilot study. Transpl Int. 2010;23:871–7. doi: 10.1111/j.1432-2277.2010.01057.x. [DOI] [PubMed] [Google Scholar]
- Bercoff J, Tanter M, Fink M. Supersonic shear imaging: a new technique for soft tissue elasticity mapping. IEEE Trans Ultrason Ferroelectr Freq Control. 2004;51:396–409. doi: 10.1109/tuffc.2004.1295425. [DOI] [PubMed] [Google Scholar]
- Bernal M, Nenadic I, Urban MW, Greenleaf JF. Material property estimation for tubes and arteries using ultrasound radiation force and analysis of propagating modes. J Acoust Soc Am. 2011;129:1344–54. doi: 10.1121/1.3533735. [DOI] [PMC free article] [PubMed] [Google Scholar]
- Blackstock DT. Fundamentals of physical acoustics. Wiley; 2000. [Google Scholar]
- Catheline S, Gennisson JL, Delon G, Fink M, Sinkus R, Abouelkaram S, Culioli J. Measurement of viscoelastic properties of homogeneous soft solid using transient elastography: An inverse problem approach. J Acoust Soc Am. 2004;116:3734–4. doi: 10.1121/1.1815075. [DOI] [PubMed] [Google Scholar]
- Chen S, Fatemi M, Greenleaf JF. Quantifying elasticity and viscosity from measurement of shear wave speed dispersion. The Journal of the Acoustical Society of America. 2004;115:2781. doi: 10.1121/1.1739480. [DOI] [PubMed] [Google Scholar]
- Chen S, Urban MW, Pislaru C, Kinnick R, Yi Z, Aiping Y, Greenleaf J. Shearwave dispersion ultrasound vibrometry (SDUV) for measuring tissue elasticity and viscosity. IEEE Trans Ultrason Ferroelectr Freq Control. 2009;56:55–62. doi: 10.1109/TUFFC.2009.1005. [DOI] [PMC free article] [PubMed] [Google Scholar]
- Deffieux T, Montaldo G, Tanter M, Fink M. Shear Wave Spectroscopy for In Vivo Quantification of Human Soft Tissues Visco-Elasticity. IEEE Trans Med Imaging. 2009;28:313–22. doi: 10.1109/TMI.2008.925077. [DOI] [PubMed] [Google Scholar]
- Evans RML, Tassieri M, Auhl D, Waigh TA. Direct conversion of rheological compliance measurements into storage and loss moduli. Phys Rev E. 2009:80. doi: 10.1103/PhysRevE.80.012501. [DOI] [PubMed] [Google Scholar]
- Findley WN, Lai JS, Onaran K. Creep and relaxation of nonlinear viscoelastic materials: with an introduction to linear viscoelasticity. Dover; 1989. [Google Scholar]
- Fung Y. Biomechanics: mechanical properties of living tissues. Springer-Verlag; 1993. [Google Scholar]
- Huwart L, Peeters F, Sinkus R, Annet L, Salameh N, ter Beek LC, Horsmans Y, Van Beers BE. Liver fibrosis: non-invasive assessment with MR elastography. NMR Biomed. 2006;19:173–9. doi: 10.1002/nbm.1030. [DOI] [PubMed] [Google Scholar]
- Huwart L, Salameh N, ter Beek L, Vicaut E, Peeters F, Sinkus R, Van Beers BE. MR elastography of liver fibrosis: preliminary results comparing spin-echo and echo-planar imaging. Eur Radiol. 2008;18:2535–41. doi: 10.1007/s00330-008-1051-5. [DOI] [PubMed] [Google Scholar]
- Huwart L, Sempoux C, Salameh N, Jamart J, Annet L, Sinkus R, Peeters F, ter Beek LC, Horsmans Y, Van Beers BE. Liver fibrosis: Noninvasive assessment with MR elastography versus aspartate aminotransferase-to-platelet ratio index. Radiology. 2007;245:458–66. doi: 10.1148/radiol.2452061673. [DOI] [PubMed] [Google Scholar]
- Kasai C, Namekawa K, Koyano A, Omoto R. Real-Time Two-Dimensional Blood Flow Imaging Using an Autocorrelation Technique. Sonics and Ultrasonics, IEEE Transactions on. 1985;32:458–64. [Google Scholar]
- Mariappan YK, Glaser KJ, Ehman RL. Magnetic Resonance Elastography: A Review. Clin Anat. 2010;23:497–511. doi: 10.1002/ca.21006. [DOI] [PMC free article] [PubMed] [Google Scholar]
- Mauldin FW, Haider MA, Loboa EG, Behler RH, Euliss LE, Pfeiler TW, Gallippi CM. Monitored steady-state excitation and recovery (MSSER) radiation force imaging using viscoelastic models. IEEE Trans Ultrason Ferroelectr Freq Control. 2008;55:1597–610. doi: 10.1109/TUFFC.2008.836. [DOI] [PubMed] [Google Scholar]
- Mitri FG, Urban MW, Fatemi M, Greenleaf JF. Shear Wave Dispersion Ultrasonic Vibrometry for Measuring Prostate Shear Stiffness and Viscosity: An In Vitro Pilot Study. Biomedical Engineering, IEEE Transactions on. 2011;58:235–42. doi: 10.1109/TBME.2010.2053928. [DOI] [PMC free article] [PubMed] [Google Scholar]
- Montaldo G, Tanter M, Bercoff J, Benech N, Fink M. Coherent Plane-Wave Compounding for Very High Frame Rate Ultrasonography and Transient Elastography. IEEE Trans Ultrason Ferroelectr Freq Control. 2009;56:489–506. doi: 10.1109/TUFFC.2009.1067. [DOI] [PubMed] [Google Scholar]
- Muthupillai R, Lamos DJ, Rossman PJ, Greenleaf JF, Manduca A, Ehman RL. Magnetic resonance elastography by direct visualization of acoustic strain waves. Science. 1995;269:1854–7. doi: 10.1126/science.7569924. [DOI] [PubMed] [Google Scholar]
- Nenadic IZ, Urban MW, Mitchell SA, Greenleaf JF. Lamb wave dispersion ultrasound vibrometry (LDUV) method for quantifying mechanical properties of viscoelastic solids. Phys Med Biol. 2011;56:2245–64. doi: 10.1088/0031-9155/56/7/021. [DOI] [PMC free article] [PubMed] [Google Scholar]
- Nightingale K. Shear-wave generation using acoustic radiation force: in vivo and ex vivo results. Ultrasound in Medicine & Biology. 2003;29:1715–23. doi: 10.1016/j.ultrasmedbio.2003.08.008. [DOI] [PubMed] [Google Scholar]
- Nightingale KR, Palmeri ML, Nightingale RW, Trahey GE. On the feasibility of remote palpation using acoustic radiation force. J Acoust Soc Am. 2001;110:625–34. doi: 10.1121/1.1378344. [DOI] [PubMed] [Google Scholar]
- Oliphant TE, Manduca A, Ehman RL, Greenleaf JF. Complex-valued stiffness reconstruction for magnetic resonance elastography by algebraic inversion of the differential equation. Magn Reson Med. 2001;45:299–310. doi: 10.1002/1522-2594(200102)45:2<299::aid-mrm1039>3.0.co;2-o. [DOI] [PubMed] [Google Scholar]
- Ophir J, Alam SK, Garra B, Kallel F, Konofagou E, Krouskop T, Varghese T. Elastography: ultrasonic estimation and imaging of the elastic properties of tissues. Proc Inst Mech Eng Part H-J Eng Med. 1999;213:203–33. doi: 10.1243/0954411991534933. [DOI] [PubMed] [Google Scholar]
- Parker KJ, Doyley MM, Rubens DJ. Imaging the elastic properties of tissue: the 20 year perspective. Phys Med Biol. 2011;56:R1–R29. doi: 10.1088/0031-9155/56/1/R01. [DOI] [PubMed] [Google Scholar]
- Qiu YP, Sridhar M, Tsou JK, Lindfors KK, Insana MF. Ultrasonic Viscoelasticity Imaging of Nonpalpable Breast Tumors: Preliminary Results. Acad Radiol. 2008;15:1526–33. doi: 10.1016/j.acra.2008.05.023. [DOI] [PMC free article] [PubMed] [Google Scholar]
- Sandrin L, Fourquet B, Hasquenoph JM, Yon S, Fournier C, Mal F, Christidis C, Ziol M, Poulet B, Kazemi F, Beaugrand M, Palau R. Transient elastography: A new noninvasive method for assessment of hepatic fibrosis. Ultrasound Med Biol. 2003;29:1705–13. doi: 10.1016/j.ultrasmedbio.2003.07.001. [DOI] [PubMed] [Google Scholar]
- Sarvazyan AP, Rudenko OV, Swanson SD, Fowlkes JB, Emelianov SY. Shear wave elasticity imaging: A new ultrasonic technology of medical diagnostics. Ultrasound Med Biol. 1998;24:1419–35. doi: 10.1016/s0301-5629(98)00110-0. [DOI] [PubMed] [Google Scholar]
- Sridhar M, Insana MF. Ultrasonic measurements of breast viscoelasticity. Med Phys. 2007;34:4757–67. doi: 10.1118/1.2805258. [DOI] [PMC free article] [PubMed] [Google Scholar]
- Torr GR. The acoustic radiation force. American Journal of Physics. 1984;52:402–8. [Google Scholar]
- Vappou J, Maleke C, Konofagou EE. Quantitative viscoelastic parameters measured by harmonic motion imaging. Phys Med Biol. 2009;54:3579–94. doi: 10.1088/0031-9155/54/11/020. [DOI] [PubMed] [Google Scholar]
- Viola F, Walker WF. Radiation force imaging of viscoelastic properties with reduced artifacts. IEEE Trans Ultrason Ferroelectr Freq Control. 2003;50:736–42. doi: 10.1109/tuffc.2003.1209564. [DOI] [PubMed] [Google Scholar]
- Walker WF, Fernandez FJ, Negron LA. A method of imaging viscoelastic parameters with acoustic radiation force. Phys Med Biol. 2000;45:1437–47. doi: 10.1088/0031-9155/45/6/303. [DOI] [PubMed] [Google Scholar]


