

Abstract
S-adenosylmethionine (SAM) is a primary methyl donor for the methylation of many molecules including DNA. DNA methylation is believed to play an important role in functions of cells and genes. Dietary, genetic and metabolic factors that influence systematic SAM levels are not fully understood. We conducted cross-sectional analysis to evaluate associations between plasma concentrations of one-carbon metabolism nutrients and metabolites and plasma SAM concentrations using healthy individuals within the Singapore Chinese Health Study. Plasma SAM, betaine, choline, folate, total homocysteine (Hcy), methionine, S-adenosylhomocysteine (SAH), vitamin B6 and vitamin B12 concentrations were quantified. Genotypes of methionine adenosyltransferases (MAT1A, MAT2A and MAT2B) were also determined. Linear regression and path analysis were performed to depict the directed dependencies in one-carbon metabolism. Age and body mass index were positively associated while cigarette smoking were inversely associated with plasma SAM concentrations. Plasma choline, methionine and SAH were positively and strongly associated with plasma SAM after adjustment for confounders. Plasma betaine and folate were positively associated with plasma SAM only in men. Men carrying the variant MAT1A genotypes had lower plasma SAM concentrations than men carrying the wild type genotype (p for gene x gender interaction = 0.02). This effect modification by gender was restricted to individuals with low plasma methionine. In conclusion, plasma choline, methionine and SAH were strongly associated with plasma SAM concentrations. The MAT1A genetic polymorphism may impact plasma SAM concentrations in men with low plasma methionine concentrations.
Keywords: One-carbon metabolism, plasma SAM, MAT genetic polymorphism, path analysis
Introduction
S-adnosylmethionine (SAM) is a key metabolite in one-carbon metabolism (OCM) (Figure 1). OCM consists of two major pathways – folate metabolism and the methylation cycle – which are connected via the methylation of homocysteine (Hcy) to methionine. Hcy is a sulfhydryl-containing amino acid derived from the metabolic demethylation of methionine. It can be remethylated back to methionine, which is subsequently converted to SAM to maintain methyl group supply for methylation reactions.
Figure 1.
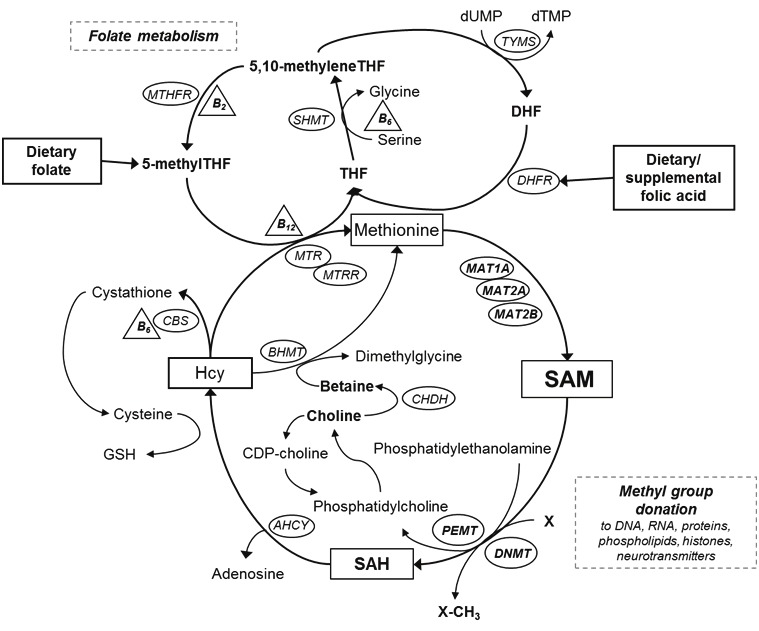
Overview of one-carbon metabolism and choline metabolism. AHCY = S-adenosylhomocysteine hydrolase; BHMT = betaine hydroxymethyltransferase; CBS = cystathione β-synthase; CDP-choline = cytidine diphosphocholine; CHDH = choline dehydrogenase; DHFR = dihydrofolate reductase; DNMT = DNA methyltransferase; GSH = glutathione; Hcy = homocysteine; MAT1A= methionine adenosyltransferase 1A; MAT2A = methionine adenosyltransferase 2A; MAT2B = methionine adenosyltransferase 2B; MTA = methylthioadenosine; MTHFR = methylenetetrahydrofolate reductase; MTR = methionine synthase; MTRR = methionine synthase reductase; PEMT = phosphatidylethanolamine methyltransferase; SAM = S-adenosylmethionine; SAH = S-adenosylhomocysteine; SHMT = serine hydroxymethyltransferase; THF = tetrahydrofolate; TYMS = thymidylate synthase; dTMP = deoxythymidine monophosphate; dUMP = deoxyuridine monophosphate
SAM provides methyl groups for nearly all biochemical reactions, including methylation of more than 80 molecules such as DNA, RNA, proteins, histones and neurotransmitters [1,2]. After transfer of methyl groups to DNA methylation, SAM is converted to S-adenosylhomocysteine (SAH), a competitive inhibitor of DNA methylation [3]. DNA methylation influences gene expression, DNA integrity and stability, chromosomal modifications and mutations [4]. Aberrations in DNA methylation, at both gene-specific and global levels, play a crucial role in carcinogenesis [5,6]. Global DNA hypomethylation has been associated with many types of cancer including bladder, breast, colon, esophagus, head and neck, liver, lung, prostate and stomach [7,8], and observed in cancer tissues, benign tumor tissues and normal tissues surrounding cancer tissues, indicating that global DNA hypomethylation may be an early event in carcinogenesis [9,10].
Methionine is a precursor of SAM and can be derived from diet as well as the re-methylation of Hcy in which a methyl group is transferred from either 5-methyl tetrahydrofolate (THF) or betaine, a choline derivative [11,12]. In addition, vitamin B groups (vitamin B2, B6 and B12) are cofactors for the re-methylation of Hcy and other reactions [11]. Therefore, the availability of SAM, as a methyl donor for DNA methylation, depends on the availability of these nutrients involved in OCM. Nutritional studies have shown that low dietary intake of OCM nutrients resulted in decreased levels of SAM and increased SAH contents in the liver [13,14].
In addition to nutritional intake, interindividual variation in OCM enzyme activity may impact SAM availability. The biosynthesis of SAM from methionine is catalyzed by methionine adenosyltransferases (MATs). Three distinct forms of MATs have been identified: MATI, MAT II and MAT III [15]. MAT I and MAT III are predominantly found in the liver and encoded by MAT1A. MAT II, encoded by MAT2A and MAT2B, can be found in the fetal liver and the tissues of many other organs. Differential expression of these genes has been shown to decrease hepatic and intracellular SAM concentrations and enhance global DNA hypomethylation and cancer cell growth in vitro [16-18]. In humans, deficiency of MATI and MATIII, caused by mutations in the MAT1A gene, was associated with persistent hypermethioninemia [19]. A recent study showed that genetic polymorphisms of MAT1A were associated with DNA damage, but only among individuals with low plasma vitamin B6 concentrations [20]. However, human data on genetic variation in MATs and plasma SAM concentrations are limited.
To date, human data describing associations between OCM nutrient/metabolite status and circulating SAM concentrations are limited. We therefore examined the associations between plasma concentrations of OCM nutrients and metabolites as well as MAT genotypes and plasma SAM concentrations among healthy adults.
Subjects and methods
Study population
The study subjects were selected from participants of the Singapore Chinese Health Study (SCHS), a population-based prospective cohort study of the role of diet and its interaction with genetic factors in the risk of cancer and other chronic diseases. The detailed study design and subject recruitment of the SCHS have been described elsewhere [11]. In brief, 63,257 Chinese men and women aged 45 – 74 years in Singapore were enrolled from April 1993 through December 1998. Eighty-five percent of eligible individuals participated in the study. At recruitment, information on demographic and lifestyle factors, medical history, family history of cancer and dietary intake was collected through in-person interviews. Usual dietary intake during the previous 12 months was assessed using a structured semi-quantitative food frequency questionnaire (FFQ) which was specifically designed to assess the dietary habits of Chinese in Singapore and validated through a series of 24-h dietary recalls [21].
We collected biospecimen from a 3% random sample of the cohort participants between 1994 and 1999. A 20-mL blood sample was collected from the cohort participants. Immediately after blood draw, blood tubes were transported from the homes of the subjects to the laboratory at the National University of Singapore, where plasma was separated from whole blood within approximately 4 hours after blood draw. Eight straws of plasma, each with approximately 0.5 mL, were created and stored in a liquid nitrogen tank at -180ºC until 2001, when they were moved to -80ºC freezers for long-term storage. All samples were kept on dry ice during shipment.
The subjects of the present study were selected from 509 men and women who donated their blood samples in 1994 – 1999. This study was approved by the Institutional Review Boards at the National University of Singapore and the University of Minnesota.
Laboratory measurements
Plasma folate, vitamin B6 and B12 concentrations were determined at the National University of Singapore in 1996 – 1997. The methods for the assays were described previously [11]. All other plasma biomarker determinations were performed by the Institute of Metabolic Disease at Baylor Research Institute in Dallas, Texas. Total plasma homocysteine (Hcy) concentrations were determined by a rapid, isocratic high performance liquid chromatography (HPLC) coupled to a fluorescence detector [22].
We used stable-isotope dilution liquid chromatography-electrospray ionization (ESI) tandem mass spectrometry (LC-ESI-MS/MS) to determine SAM, SAH, methionine, choline and betaine in plasma. Calibrators and internal standards (2H3-SAM, 2H4-SAH, 2H3-methionine, 2H3-choline and 2H3-betaine) were included in each analytical run for calibration. One-mM stock solutions of each standard were diluted in distilled water to perform a 5-point calibration curve (Table 1). Sample preparation utilized microcentrifugal filter units, Microcon YM-10, 10 kDa NMWL (Millipore, USA). Samples were prepared by the addition of 100 μL mobile phase A containing 10 – 50 μmol/L labeled-isotope internal standards to 30 μl of standard or plasma followed by vortex. Microcentrifugal filter units were centrifuged for 20 min at 14800 x g at 4°C. Sample filtrate was transferred to a microtiter plate for analysis. Chromatographic separation was achieved on an EZ-faast 250 x 2.0mm 4μ AAA-MS analytical column (Phenomenex) maintained at 36°C at a flow of 250μL/min with a bianary gradient with a total run time of 12 minutes. Solvents for HPLC were: (A) 4mM ammonium acetate, 0.1 % formic acid, 0.1 % heptafluorobutyric acid (pH=2.5); and (B) 100 % methanol and 0.1 % formic acid. The initial gradient condition was 75% A: 25% B and was increased in a linear fashion to 100% B in 6 minutes and held constant for 1 minute. At 7.1 minutes, the mobile phase was reset to initial conditions for 5 minutes. The flow from the column was delivered to the Turbo V source from the period of 3 to 8 minutes, otherwise the flow was diverted to waste. The compounds were detected by multiple reaction monitoring (MRM) using positive-ESI. Sample separation and injection was performed by a Shimadzu Prominence LC System interfaced with a 4000 Q TRAP® LC-MS/MS (ABSciex). All data were collected using Analyst software version 1.4.2. Table 1 indicates the MRM transitions for each metabolite, internal standards used, retention times and performance (inter-assay precision, n=10) for this method.
Table 1.
Mass transitions and method statistics for the determination of plasma one-carbon metabolism nutrients and metabolites
| Inter-assay Precision | ||||||||
|---|---|---|---|---|---|---|---|---|
| Analyte | Analyte MRM (m/z) | Labeled Isotope | Labeled Isotope MRM (m/z) | Retention Time (minutes) | LOQ (nmol /L) | Calibration Curve | Level 1 (CV %) | Level 2 (CV %) |
| SAM | 399→250 | 2H3-SAM | 402→250 | 7.1 | 5 | 400 - 25 nmol/L | 9.2 | 6.2 |
| SAH | 385→136 | 2H4-SAH | 389→138 | 6.8 | 5 | 400 - 25 nmol/L | 10.4 | 5.9 |
| Betaine | 118→59 | 2H3-Bet | 21→61 | 3.5 | 500 | 100 - 6.25 μmol/L | 6.3 | 7.3 |
| Choline | 104→45 | 2H4-Chol | 108→49 | 4.9 | 500 | 100 - 6.25 μmol/L | 6.9 | 6.7 |
| Methionine | 150→104 | 2H3-Met | 153→107 | 6.5 | 500 | 100 - 6.25 μmol/L | 6.1 | 6.4 |
SNP selection
We selected common single nucleotide polymorphisms (SNPs) of MAT1A, MAT2A and MAT2B. Given the relatively small study sample size, we selected common SNPs with minor allele frequency (MAF) ≥20%. Using data from the International HapMap Project (Tagger Pairwise method, HapMap Data Rel 27 Phase II + III, Feb09, on NCBI B36 assembly, dbSNP b126 for the Han Chinese (CHB) population), a total of 3 tag SNPs and their proxies (in parentheses) were selected: rs2993763 and (rs4934028) for MAT1A, rs2289972 and (rs2028900) for MAT2A, and rs4869089 and (rs7733775) for MAT2B.
DNA extraction and Genotype determinations
DNA extraction and genotype determinations were performed by the University of Minnesota BioMedical Genomics Center (BMGC). DNA was extracted from buffy coats using a Qiagen Kit (Qiagen Inc., Valencia, CA). Genotype determinations were performed in multiplex using the Sequenom MALDI-TOF mass spectrometry system (Sequenom Inc., San Diego, CA). Positive and negative controls were included in each 96-well plate. A tag SNP of MAT2B (rs4869089) had a low call rate (<95%), and therefore its proxy SNP (rs7733775) was used in the analysis. In this study, we report a total of 3 SNPs – MAT1A rs2993763, MAT2A rs2289972 and MAT2B rs7733775. All 3 SNPs included in the analysis were in Hardy-Weinberg equilibrium (p ≥0.05).
Statistical analysis
Of the 509 subjects, 14 subjects had missing values in plasma SAM concentrations and therefore were excluded. In addition, 19 subjects who had undetectable (n = 9) or extremely high values (n = 10) in all measured biomarkers, and 15 subjects who had missing (n=14) or extremely high values (n=1) in serum creatinine concentrations were excluded. After these exclusions, 461 subjects were included in the analysis.
The distributions of plasma concentrations of all measured OCM nutrients and metabolites and serum creatinine concentrations were markedly skewed with fewer subjects having high values; therefore, logarithmically transformed values were used when included in the models as covariates to correct the departure from the normal distribution. Plasma concentrations of OCM nutrients and metabolites were compared by gender using multiple linear regression modeling adjusting for age at blood draw and serum creatinine concentrations. Analysis of covariance (ANCOVA) was used to examine the associations between selected demographic, lifestyle and genetic characteristics and plasma SAM concentrations. To test the hypothesis that plasma concentrations of OCM nutrients (betaine, choline, folate, methionine, vitamin B6 and B12) and OCM metabolites (SAH and Hcy) are associated with plasma SAM concentrations, multiple linear regression modeling was used, adjusting for gender, age at blood draw, body mass index (BMI), smoking status (current, past and never) and serum creatinine concentrations. Geometric means and corresponding 95% confidence intervals (CIs) of plasma SAM concentrations were presented for quartile groups of plasma OCM nutrient or metabolite concentrations. A trend across quartiles was tested using median values of quartile groups. To examine the associations between MAT genotypes and plasma SAM concentrations, multiple linear regression modeling was used with adjustment for age at blood draw, gender, BMI, smoking status, plasma methionine concentrations and serum creatinine concentrations. To evaluate interactions with gender and/or plasma methionine concentrations, we included interaction terms in the models, and also performed stratified analysis by gender and plasma methionine concentrations (≤ or > the median (=23.4 μmol/L)).
To further depict the directed dependencies among a set of variables involved in the OCM pathway, we analyzed the data using a diagram-based approach of the path analysis [23]. We separated the associations between plasma choline or folate and plasma SAM concentrations. In the choline-SAM pathway and the folate-SAM pathway, we further broke down the associations between plasma concentrations of choline or folate and plasma SAM concentrations into associations among intermediate molecules on each causal pathway. The final models for the choline-SAM pathway and the folate-SAM pathway were determined incorporating paths that showed statistically significant associations, controlling for age at blood draw, gender, BMI, smoking status and serum creatinine concentrations.
Linear regression analysis and path analysis were performed using SAS version 9.2 (SAS Institute Inc., Cary, NC) and Mplus version 6.1 (Muthen & Muthen, Los Angeles, CA), respectively. All reported p values were two-sided, and significance was defined as p <0.05. This study had 80% power to detect 7.1 nmol/L (= 0.39 x standard deviation (SD)) difference in plasma SAM concentrations between the lowest and highest quartiles of plasma OCM nutrient or metabolite concentrations and 12.6 nmol/L (= 0.7 x SD) difference in plasma SAM concentrations between homozygous wild type genotype and homozygous variant genotype of MATs assuming 20% MAFs.
Results
The study subjects consist of 204 men and 257 women. The mean age of study subjects was 58 y (SD, 7.8 y; range, 46 – 77 y) at blood draw. About 72% of the subjects had BMI below 24 and only 4% had BMI of 28 or above. While 41% of men had secondary school or higher education, 75% of women had no formal education or only primary school education. About 56% of men were previous or current smokers, whereas the majorities (95%) of women were never smokers. Alcohol intake was not common; 70% and 93% of men and women, respectively, reported no alcohol intake.
Table 2 shows geometric means of plasma SAM and other OCM nutrient/metabolite concentrations in men and women, separately. The median plasma SAM concentrations for all subjects was 63.3 nmol/L (interquartile range (IQR), 54.9 – 75.9 nmol/L). Serum creatinine concentrations were statistically significantly higher in men (geometric mean, 75.6 μmol/L; 95%CI, 73.6 – 77.7 μmol/L) than women (54.6 μmol/L; 53.3 – 55.9 μmol/L) (p <0.0001). After adjustment for serum creatinine concentrations and age at blood draw, plasma SAM concentrations were comparable for men and women. Plasma concentrations of betaine, choline, Hcy and methionine were statistically significantly higher in men than women, whereas plasma concentrations of folate, SAH and vitamins B6 were higher in women than men. Plasma vitamin B12 concentrations did not differ by gender. Among OCM nutrients and metabolites, betaine, choline and methionine were positively correlated each other (Spearman partial correlation coefficients (r), 0.27 – 0.31; data not shown). Similarly, folate and vitamins B6 and B12 were positively correlated each other (r = 0.16 – 0.31). Hcy was inversely correlated with folate, betaine, and vitamins B6 and B12 (r = 0.12 – 0.32). Plasma SAM concentrations were positively correlated with plasma concentrations of choline, folate, methionine, SAH, and vitamin B6 (r = 0.11 – 0.37).
Table 2.
Geometric means and 95% confidence intervals (CIs)a of plasma one-carbon metabolism nutrients and metabolitesb by gender.
| Men (n = 204) | Women (n = 257) | p | |
|---|---|---|---|
| SAM (nmol/L) | 63.7 (61.1 – 66.4) | 64.8 (61.6 – 66.2) | 0.95 |
| Betaine (μmol/L) | 52.1 (49.9 – 54.4) | 44.5 (42.9 – 46.2) | <0.0001 |
| Choline (μmol/L) | 12.9 (12.4 – 13.4) | 11.9 (11.5 – 12.3) | 0.006 |
| Folate (nmol/L) | 12.9 (12.0 – 13.8) | 14.6 (13.8 – 15.5) | 0.02 |
| Hcy (μmol/L) | 10.2 (9.7 – 10.6) | 9.3 (9.0 – 9.7) | 0.009 |
| Methionine (μmol/L) | 25.0 (23.9 – 26.1) | 22.6 (21.7 – 23.4) | 0.002 |
| SAH (nmol/L) | 26.5 (25.2 – 28.0) | 29.2 (27.9 – 30.6) | 0.02 |
| Vitamin B6 (nmol/L) | 29.4 (26.5 – 32.6) | 36.2 (33.1 – 39.6) | 0.009 |
| Vitamin B12 (pmol/L) | 313.5 (294.8 – 333.5) | 336.4 (318.9 – 354.8) | 0.13 |
Adjusted for age at blood draw and serum creatinine concentrations;
One-carbon metabolism metabolites: SAM, S-adenosylmethionine;SAH, S-adenosylhomocysteine; Hcy, total homocysteine.
Table 3 describes the associations between selected demographic, lifestyle and genetic characteristics of the study subjects and plasma SAM concentrations in men and women, separately. Higher plasma SAM concentrations were observed in women at older age and in men with high BMI. Current smokers had statistically significantly lower plasma SAM than never smokers in men. The difference in plasma SAM concentrations between current /past and never smokers in women was not statistically significant, most likely due to the very few smokers in women. Alcohol consumption and methylenetetrahydrofolate reductase (MTHFR) C677T genotype was not associated with plasma SAM concentrations.
Table 3.
Plasma SAM concentrations in men and women by selected demographic, lifestyle and genetic factors
| Men (n = 204) | Women (n = 257) | |||||
|---|---|---|---|---|---|---|
| n | Geometric mean (95%CI) (nmol/L)a | Ptrend | n | Geometric mean (95%CI) (nmol/L)a | Ptrend | |
| Age at blood draw | ||||||
| <50 | 29 | 64.9 (59.1 – 71.3) | 0.17 | 43 | 59.7 (55.3 – 64.5) | 0.02 |
| 50 – 59 | 86 | 67.0 (63.5 – 70.8) | 126 | 58.2 (55.6 – 60.8) | ||
| 60 – 69 | 72 | 67.2 (63.3 – 71.3) | 58 | 68.0 (63.7 – 72.6) | ||
| ≥70 | 17 | 74.3 (65.8 – 84.1) | 30 | 63.1 (57.4 – 69.4) | ||
| BMI | ||||||
| <20 | 27 | 63.1 (57.2 – 69.5) | 0.02 | 41 | 59.0 (54.5 – 63.9) | 0.21 |
| 20 – <24 | 119 | 66.5 (63.5 – 69.6) | 147 | 60.7 (58.3 – 63.3) | ||
| 24 – <28 | 50 | 71.0 (66.2 – 76.3) | 58 | 63.3 (59.3 – 67.7) | ||
| ≥28 | 8 | 73.5 (61.5 – 87.8) | 11 | 62.0 (53.2 – 72.3) | ||
| Level of education | ||||||
| No formal school | 26 | 68.8 (62.0 – 76.4) | 0.26 | 96 | 60.2 (57.0 – 63.6) | 0.59 |
| Primary school | 94 | 68.2 (64.7 – 71.9) | 97 | 61.9 (58.8 – 65.2) | ||
| Secondary school | 58 | 67.0 (62.6 – 71.7) | 54 | 60.4 (56.3 – 64.8) | ||
| Some college or above | 26 | 63.6 (57.4 – 70.5) | 10 | 65.2 (55.5 – 76.6) | ||
| Smoking status | ||||||
| Never | 90 | 70.9 (67.2 – 74.8) | 0.004 | 243 | 61.2 (59.2 – 63.2) | 0.75 |
| Past | 53 | 67.2 (62.6 – 72.1) | 2 | 56.5 (39.4 – 80.9) | ||
| Current | 61 | 62.6 (58.8 – 66.7) | 12 | 60.0 (51.7 – 69.7) | ||
| Alcohol intake | ||||||
| None | 143 | 66.7 (63.9 – 69.6) | 0.32 | 239 | 60.8 (58.9 – 62.9) | 0.42 |
| <7 drinks/week | 45 | 68.3 (63.3 – 73.7) | 14 | 65.6 (57.2 – 75.2) | ||
| ≥7 drinks/week | 16 | 71.1 (62.6 – 80.7) | 4 | 62.1 (48.2 – 80.0) | ||
| MTHFR C677T | ||||||
| CC | 117 | 67.5 (64.4 – 70.8) | 0.82 | 139 | 59.9 (57.4 – 62.5) | 0.13 |
| CT | 69 | 67.7 (63.6 – 72.0) | 89 | 61.5 (58.3 – 64.9) | ||
| TT | 15 | 65.7 (57.6 – 75.0) | 22 | 65.7 (58.9 – 73.2) | ||
Adjusted for age at blood draw and serum creatinine concentrations.
Associations between plasma concentrations of each OCM nutrient or metabolite and plasma SAM concentrations in men, women and all study subjects from linear regression analyses are shown in Table 4. Higher plasma concentrations of choline, methionine and SAH were statistically significantly associated with higher plasma SAM concentrations in men and women. Plasma betaine and folate were positively associated with plasma SAM concentrations in men, but not in women. The positive association between plasma vitamin B6 and SAM was borderline significant in both men and women combined (p for trend = 0.046). Plasma concentrations of Hcy and vitamin B12 were not associated with plasma SAM concentrations in either men or women. We further examined the association between overall availability of methyl-containing nutrients in the choline (betaine)-mediated and the folate-mediated Hcy re-methylation pathways and plasma SAM concentrations using a sum of scores for quartiles of plasma betaine, choline and methionine concentrations, or a sum of scores for quartiles of plasma folate and methionine concentrations, respectively: zero was assigned to the lowest quartile and 3 to the highest quartile of each biomarker. In the choline-mediated Hcy re-methylation pathway, the geometric means of plasma SAM concentrations were 50.4 nmol/L (95%CI, 47.0 – 54.0 nmol/L) for subjects with the lowest summed score (0 to 1) and 70.0 nmol/L (95%CI, 65.5 – 74.7 nmol/L) for subjects with the highest summed score (8 to 9) in all subjects (p for trend <0.0001) (data not shown). Similarly, in the folate-mediated Hcy re-methylation pathway, the geometric means of plasma SAM concentrations were 56.2 nmol/L (95%CI, 53.3 – 59.2 nmol/L) for those with the lowest score (0 to 1) and 71.7 nmol/L (95%CI, 67.7 – 75.9 nmol/L) for those with the highest score (5 to 6) in all subjects (p for trend <0.0001). A similar dose-dependent positive association between the summed score and plasma SAM concentrations was observed in men and women in both pathways (p for trend <0.001).
Table 4.
Geometric means and 95% confidence intervals (CIs)a of plasma SAM concentrations (nmol/L) by quartiles of one-carbon metabolism nutrients and metabolitesb
| Quartiles of plasma concentrations | ptrend | ||||
|---|---|---|---|---|---|
| 1 (lowest) | 2 | 3 | 4 (highest) | ||
| Betaine | |||||
| Men | 63.0 (58.8 – 67.6) | 65.9 (61.5 – 70.8) | 67.7 (63.0 – 72.6) | 70.9 (66.2 – 76.0) | 0.02 |
| Women | 56.2 (48.9 – 64.6) | 59.7 (51.7 – 69.0) | 57.5 (50.0 – 66.1) | 61.5 (53.2 – 71.0) | 0.08 |
| All subjects | 60.7 (57.5 – 64.0) | 60.2 (57.2 – 63.5) | 61.6 (58.3 – 65.0) | 65.1 (61.7 – 68.7) | 0.03 |
| Choline | |||||
| Men | 59.5 (55.7 – 63.5) | 63.4 (59.1 – 68.0) | 74.0 (69.4 – 78.9) | 70.7 (66.1 – 75.6) | <0.0001 |
| Women | 55.8 (48.5 – 64.2) | 56.8 (49.3 – 65.4) | 60.1 (52.3 – 69.1) | 61.3 (53.0 – 71.0) | 0.02 |
| All subjects | 57.5 (54.5 – 60.6) | 59.3 (56.4 – 62.4) | 65.8 (62.3 – 69.4) | 65.4 (62.1 – 68.9) | <0.0001 |
| Folate | |||||
| Men | 64.8 (60.5 – 69.5) | 63.8 (59.5 – 68.4) | 67.1 (62.5 – 72.0) | 72.1 (67.1 – 77.4) | 0.02 |
| Women | 56.8 (49.2 – 65.6) | 57.0 (49.5 – 65.7) | 57.7 (49.8 – 66.9) | 59.7 (51.9 – 68.8) | 0.24 |
| All subjects | 60.2 (57.2 – 63.4) | 61.1 (57.8 – 64.5) | 61.8 (58.6 – 65.1) | 64.8 (61.3 – 68.5) | 0.03 |
| Hcy | |||||
| Men | 67.5 (62.8 – 72.4) | 67.9 (63.4 – 72.6) | 65.5 (61.2 – 70.0) | 67.4 (62.7 – 72.5) | 0.87 |
| Women | 57.8 (49.8 – 67.0) | 55.8 (48.3 – 64.5) | 59.3 (51.7 – 67.9) | 57.2 (49.3 – 66.4) | 0.92 |
| All subjects | 62.3 (58.9 – 65.9) | 60.4 (57.3 – 63.7) | 65.0 (61.6 – 68.6) | 56.9 (56.9 – 63.4) | 0.56 |
| Methionine | |||||
| Men | 56.9 (53.4 – 60.6) | 64.1 (60.1 – 68.3) | 71.5 (67.3 – 76.0) | 77.1 (72.3 – 82.2) | <0.0001 |
| Women | 54.6 (48.0 – 62.2) | 57.2 (49.7 – 65.8) | 64.0 (55.7 – 73.5) | 67.0 (58.2 – 77.2) | <0.0001 |
| All subjects | 55.5 (52.9 – 58.2) | 59.0 (56.1 – 62.1) | 65.9 (62.7 – 69.3) | 70.8 (67.3 – 74.6) | <0.0001 |
| SAH | |||||
| Men | 60.7 (56.4 – 65.2) | 63.9 (59.7 – 68.5) | 72.9 (68.1 – 78.1) | 70.3 (65.3 – 75.6) | 0.006 |
| Women | 52.7 (45.9 – 60.5) | 59.1 (51.3 – 67.9) | 61.9 (53.8 – 71.0) | 60.7 (52.6 – 69.9) | 0.005 |
| All subjects | 55.7 (52.8 – 58.7) | 61.3 (58.3 – 64.5) | 65.6 (62.2 – 69.1) | 65.2 (61.7 – 68.8) | <0.0001 |
| Vitamin B6 | |||||
| Men | 67.1 (62.5 – 72.1) | 65.7 (61.3 – 70.3) | 63.5 (59.3 – 68.1) | 71.5 (66.5 – 76.9 | 0.17 |
| Women | 57.3 (49.7 – 66.2) | 55.2 (47.8 – 63.7) | 59.1 (51.4 – 68.0) | 59.6 (51.7 – 68.6) | 0.19 |
| All subjects | 61.8 (58.8 – 65.1) | 59.5 (56.4 – 62.8) | 61.7 (58.4 – 65.1) | 64.9 (61.4 – 68.6) | 0.046 |
| Vitamin B12 | |||||
| Men | 68.3 (63.6 – 73.3) | 64.0 (59.8 – 68.5) | 65.4 (61.0 – 70.0) | 70.3 (65.4 – 75.6) | 0.41 |
| Women | 57.0 (49.2 – 66.0) | 58.2 (50.4 – 67.2) | 57.3 (49.8 – 66.0) | 58.8 (51.1 – 67.7) | 0.56 |
| All subjects | 60.9 (57.7 – 64.2) | 61.0 (57.9 – 64.3) | 62.1 (58.9 – 65.5) | 63.5 (60.1 – 67.1) | 0.19 |
Adjusted for age at blood draw, BMI, smoking status, serum creatinine concentrations and gender (for all subjects);
One-carbon metabolism metabolites: SAM, S-adenosylmethionine; SAH, S-adenosylhomocysteine; Hcy, total homocysteine.
We performed the path analysis for the choline (betaine)-mediated Hcy re-methylation pathway for all subjects and the folate-mediated Hcy re-methylation pathway in men and women separately, because the association between plasma folate and SAM was different in men and women in the regression analysis. Including plasma Hcy concentrations in the models did not change the results; therefore Hcy was not included in the final path models. Plasma folate was not statistically significantly associated with plasma SAM through OCM or other unspecified mechanisms in men and women (data not shown). Figure 2 graphically depicts a final path model for the choline (betaine)-mediated Hcy re-methylation pathway. The total association between choline and SAM was statistically significant with a standardized path coefficient of 0.218 (p <0.0001). When associations among intermediate molecules were separated, the associations of choline with betaine, methionine or SAM, the association between betaine and methionine as well as the association between methionine and SAM were all statistically significantly positive. The direct path between betaine and SAM was not statistically significant and thus excluded in the final model. When separated, the association between choline and SAM through the OCM pathway and through unspecified mechanisms other than the OCM pathway were statistically significant; the standardized path coefficients were 0.105 and 0.114, respectively (p <0.01 for both). We did not find any modifying effect of folate in the choline-SAM path model.
Figure 2.
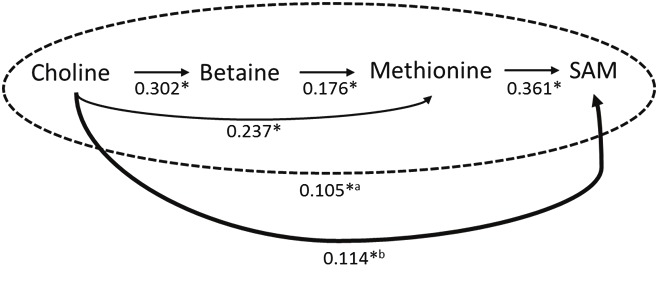
The final path analysis model for the choline-SAM pathway (figures are standardized regression coefficients for each path, adjusted for age at blood draw, gender, BMI, smoking status, and serum creatinine concentrations). *p<0.01; aStandardized regression coefficient for the impact of choline on SAM through the one-carbon metabolism pathway. bStandardized regression coefficient for the impact of choline on SAM through unspecified pathways other than the one-carbon metabolism pathway. Total impact of choline on SAM (= a + b): standardized regression coefficient = 0.218 (p <0.0001).
Overall, MAT1A, MAT2A and MAT2B genotypes were not associated with plasma SAM concentrations in both men and women combined (Table 5). However, the MAT1A-SAM association was modified by gender and plasma methionine concentrations. Plasma SAM concentrations were lower in subjects carrying the variant allele of MAT1A rs2993763 only in men (p for trend = 0.047, p for a gene x gender interaction = 0.02). When plasma methionine was below the median (23.4 μmol/L), the MAT1A genotype was marginally statistically significantly associated with plasma SAM concentrations in men (p for trend = 0.05); men with the GA or AA genotype had 13% and 14% decreases in plasma SAM, respectively, compared with men carrying the GG wild type genotype (Table 6). However, the MAT1A genotype was not associated with plasma SAM in men when plasma methionine concentrations were above the median. No such modulation of the MAT1A-SAM association by plasma methionine concentrations was observed in women. There was no modifying effect by plasma methionine concentrations or gender on associations between the MAT2A or MAT2B genotypes and plasma SAM concentrations (data not shown).
Table 5.
Plasma SAM concentrations (nmol/L) by genotypes of MAT1A, MAT2A and MAT2B
| All subjects | Men | Women | Pinteractionc | ||||
|---|---|---|---|---|---|---|---|
| na | Geometric means (95%CIs)b | na | Geometric means (95%CIs)b | na | Geometric means (95%CIs)b | ||
| MAT1A rs2993763 | |||||||
| GG | 134 | 62.2 (59.4 – 65.1) | 57 | 69.4 (65.5 – 73.4) | 77 | 58.9 (51.7 – 67.2) | 0.02 |
| GA | 230 | 63.0 (60.7 – 65.3) | 102 | 67.2 (64.4 – 70.1) | 128 | 61.6 (54.3 – 70.1) | |
| AA | 94 | 61.8 (58.6 – 65.1) | 44 | 63.5 (59.5 – 67.8) | 50 | 63.5 (59.5 – 67.8) | |
| Ptrend | 0.88 | 0.047 | 0.17 | ||||
| MAT2A rs2289972 | |||||||
| GG | 228 | 62.7 (60.3 – 65.1) | 100 | 67.4 (64.5 – 70.5) | 128 | 61.3 (56.9 – 66.1) | 0.72 |
| GA | 174 | 62.0 (59.5 – 64.6) | 83 | 65.9 (62.8 – 69.1) | 91 | 61.4 (56.6 – 66.7) | |
| AA | 43 | 61.7 (57.2 – 66.4) | 14 | 67.0 (59.5 – 75.5) | 29 | 61.1 (54.6 – 68.3) | |
| Ptrend | 0.59 | 0.63 | 0.96 | ||||
| MAT2B rs7733775 | |||||||
| GG | 324 | 62.8 (60.7 – 65.0) | 143 | 68.0 (65.6 – 70.6) | 181 | 60.5 (53.4 – 68.6) | 0.22 |
| GA | 118 | 62.6 (59.7 – 65.5) | 53 | 65.0 (61.3 – 68.9) | 65 | 61.8 (54.0 – 70.8) | |
| AA | 10 | 62.6 (54.1 – 72.4) | 5 | 63.1 (51.9 – 76.6) | 5 | 62.7 (49.2 – 79.8) | |
| Ptrend | 0.87 | 0.16 | 0.51 | ||||
Subjects with missing data on a genotype of each SNP were excluded from an analysis;
Adjusted for age at blood draw, BMI, smoking status, serum creatinine concentrations, plasma methionine concentrations and gender (for all subjects);
p value for an interaction between MAT genotype and gender.
Table 6.
Geometric means and 95% confidence intervals (CIs) of plasma SAM concentrations and MAT1A rs2993763 genotype by plasma methionine concentrations and gender.
| Plasma methionine ≤23.4 μmol/L | Plasma methionine >23.4 μmol/L | ||||
|---|---|---|---|---|---|
| na | Geometric means (nmol/L)b | na | Geometric means (nmol/L)b | p | |
| Men | |||||
| GG | 23 | 65.3 (59.5 – 71.6) | 34 | 71.7 (66.4 – 77.5) | 0.13 |
| GA | 40 | 57.0 (53.1 – 61.2) | 62 | 74.9 (70.8 – 79.3) | <0.0001 |
| AA | 19 | 56.1 (50.6 – 62.3) | 25 | 68.8 (62.9 – 75.4) | 0.004 |
| Ptrend | 0.05 | 0.66 | 0.18c | ||
| Women | |||||
| GG | 45 | 54.0 (47.0 – 62.1) | 32 | 62.9 (53.9 – 73.5) | 0.009 |
| GA | 75 | 57.0 (49.9 – 65.0) | 53 | 66.2 (57.4 – 76.4) | 0.001 |
| AA | 28 | 57.4 (49.1 – 67.0) | 22 | 68.1 (57.9 – 80.1) | 0.02 |
| Ptrend | 0.35 | 0.10 | 0.86c | ||
| Pinteraction | 0.06d | 0.14d | 0.48e | ||
| All subjects | |||||
| GG | 68 | 57.5 (54.0 – 61.1) | 66 | 66.1 (62.0 – 70.5) | 0.001 |
| GA | 115 | 57.0 (54.3 – 59.8) | 115 | 69.2 (65.9 – 72.7) | <0.0001 |
| AA | 47 | 56.5 (52.5 – 60.8) | 47 | 67.4 (62.6 – 72.5) | 0.0005 |
| Ptrend | 0.85 | 0.50 | 0.51c | ||
Subjects with missing data on a genotype of each SNP were excluded from an analysis;
Adjusted for age at blood draw, BMI, smoking status, serum creatinine concentrations and gender (for all subjects);
p value for an interaction between the MAT1A genotype and plasma methionine;
p value for an interaction between the MAT1A genotype and gender within plasma methionine groups;
p value for an interaction among the MAT1A genotype, plasma methionine, and gender in all subjects.
Discussion
This is the first comprehensive study to examine the relationship between OCM nutrient and metabolite status and circulating SAM levels in a free-living human population. Plasma choline, methionine and SAH were strongly positively associated with plasma SAM concentrations among healthy Singapore Chinese men and women. Plasma folate and betaine concentrations were positively associated with plasma SAM concentrations only in men. Vitamin B12 and B6 had no or minimal positive associations with plasma SAM. In OCM, nutrients and metabolites in the methylation cycle may play a more important role than those in the folate cycle in determining plasma SAM concentrations.
We observed higher concentrations of plasma SAM in women at the age of 60 or higher. The animal study showed a decrease in tissue SAM levels in aging rats compared to adult counterparts because of increased utilization of SAM due to elevated activity of the enzyme, catechol-O-methyltransferase (COMT) [24]. On the other hand, Van Driel et al. reported lack of difference in plasma SAM concentrations by age among women of reproductive ages (20 – 48 y) [25]. The mean age of the women in our study was 57.5 y, and about 84% of the women were postmenopausal at the cohort baseline. The differences in age and menopausal status may explain these conflicting results. We also observed a positive association between BMI and plasma SAM concentrations only in men, while Van Driel et al. reported a positive association between BMI and plasma SAM concentrations among premenopausal women [25]. Future studies are required to unravel the association of age and BMI with plasma SAM concentrations.
SAM is synthesized from its precursor, methionine, via a process catalyzed by the MAT enzymes. In theory, the SAM pool can be affected by the availability of methionine and the activity level of MATs. Methionine is a sulfur-containing essential amino acid furnishing methyl groups and sulfur necessary for normal metabolism. Methionine can be derived from dietary sources such as fish, meats and nuts, as well as from Hcy re-methylation which requires either 5-methyl THF or betaine (choline). Therefore, insufficient availability of these nutrients or dietary methionine may lead to low methionine and SAM status. Although folate-mediated Hcy re-methylation is traditionally considered as a major pathway of the re-methylation of Hcy, it is estimated that approximately 60% of methyl groups are derived from choline in the liver [26]. Therefore, choline and betaine may play a more important role than folate in providing methyl groups for methylation of DNA and other molecules. The choline (betaine)-mediated Hcy re-methylation pathway may become even more dominant when the folate-mediated Hcy re-methylation pathway is impaired because these two pathways are interrelated. This interrelationship between folate and choline has been demonstrated by the reduction of choline stores following the administration of the folate-deficient diet in animal and human studies [27-30]. In the SCHS cohort, the average folate intake at baseline was 156 μg/day, which is significantly lower than the recommended daily intake (RDI) of 400 μg/day from the Institute of Medicine in the United States [31]. The low dietary folate intake in our study population could be one of the reasons for weak or no associations between plasma folate and SAM concentrations in the present study. The low folate status might have enhanced the association between plasma choline and SAM in this population.
In adults, MAT I and MAT III, encoded by MAT1A, are found in the liver, whereas MATII is encoded by MAT2A and MAT2B which can be found in many organs and tissues, including lymphocytes. Experimental studies showed that individuals with persistent hypermethioninemia had deficient MAT activity in the liver but normal MAT activity in red blood cells and lymphoid cells [32,33], suggesting a critical role of hepatic MAT I and MAT III in methionine metabolism [17]. Our findings of the association between the MAT1 genotype and plasma SAM concentrations, especially in the condition of low methionine status, are consistent with those results. The lack of the association between the MAT1A genotype and plasma SAM, when methionine is sufficient, suggests that high plasma methionine concentrations may overcome the reduced MAT enzyme activity level in individuals carrying the MAT1A variant genotypes. Therefore, a sufficient supply of methionine might be important for the maintenance of an adequate methyl pool for methylation reactions.
Besides via the methionine-mediated OCM pathway, choline may play a critical role in determining plasma SAM concentrations via a non-methionine mediated OCM pathway. Choline can be acquired from diet, but also from the de novo biosynthesis via the methylation of phosphatidylethanolamine to phosphatidylcholine catalyzed by phosphatidylethanolamine methyltransferase (PEMT) (Figure 1). De novo choline biosynthesis might explain the lack of correlations between plasma concentrations of choline, betaine and methionine and dietary intake data in the current study (data not shown). Because PEMT consumes methyl groups from SAM to generate phosphatidylcholine, suboptimal choline intake may enhance the de novo biosynthesis of choline via the PEMT pathway that could reduce SAM concentrations. In the present study, we found a statistically significant positive association between plasma choline and SAM independent of the methionine-mediated OCM pathway. We speculate that this choline-SAM association via the non-methionine-mediated pathway may be in part through the choline biosynthesis pathway and may explain a stronger association of plasma choline than betaine with plasma SAM concentrations in the present study. Further studies are warranted to investigate this choline-SAM association.
After a methyl group is transferred to DNA catalyzed by DNA methyltransferases (DNMTs), SAM is converted to SAH, which is a competitive inhibitor of DNMTs. As expected, plasma SAH concentrations were statistically significantly positively associated with plasma SAM in the present study. SAH is subsequently converted to Hcy. We previously reported inverse associations between plasma Hcy and plasma folate, vitamin B6 and B12 in this Singapore Chinese population [11]. In the present study, plasma betaine concentrations were inversely associated with plasma Hcy but plasma choline was not. Hcy status is traditionally used as an indicator of OCM function in studies of health outcomes such as cardiovascular diseases, but health effects of Hcy on carcinogenesis are still not clear. In the present study, plasma Hcy concentrations were not associated with plasma SAM concentrations. Our result is consistent with the previous study reporting that plasma Hcy concentrations were highly correlated with plasma SAH, but not with plasma SAM among healthy adult females [34]. Lack of a correlation between plasma Hcy and SAM in the present study may be due to the fact that our study subjects were healthy individuals with normal plasma Hcy concentrations. We may have observed a higher correlation between Hcy and SAM, if our study had included hyperhomocysteinemic individuals.
The present study is novel in that existing human data describing associations between OCM nutrient status and circulating SAM levels are limited. The simultaneous measurement of major compounds in the OCM pathway including SAM, SAH, Hcy, methionine, choline, betaine, folate, vitamins B6 and B12 allowed the comprehensive analysis for their effects on SAM. The inclusion of genetic variation in MAT sheds lights on the methionine-SAM association. In addition, the path analysis based on the understanding of the biological function of these OCM metabolites provides further insight on the OCM pathway in humans. Although the present study is a cross-sectional study, which does not allow us to determine cause-effect relationships, it would be extremely difficult to disentangle complicated pathways involving multiple molecules in OCM in an intervention study.
One concern of the present study is the possible degradation of SAM in stored plasma samples over time. The median plasma SAM concentrations in the present study (63.3 nmol/L) was somewhat lower than those found in populations in Europe (70 to 128 nmol/L) [25]. However, the wide range of plasma SAM in various studies (50 to 150 nmol/L) might be due to different study populations and different laboratory methods [34-40]. It should be noted that a reliable method to measure plasma SAM concentrations became only recently available. Furthermore, previously reported plasma SAM concentrations were mainly in whites; no reference data are available for Asian populations. In the present study population, we measured plasma Hcy concentrations in the same subjects at two different times in two different laboratories; one at the National University of Singapore in 1996-1997 and the other at Baylor Research Institute in 2010. High correlation between the two Hcy measurements (r = 0.70) indicates that the degradation of Hcy, and possibly SAM, might have been minimal during prolonged storage. Furthermore, degradation of plasma SAM would not result in the observed associations, given that it occurred in a non-differential manner.
In summary, the present study demonstrates that plasma choline, methionine and SAH were strongly associated with plasma SAM concentrations. Plasma choline may be associated with plasma SAM through OCM (via betaine and methionine), but also through unspecified mechanisms other than OCM. The common genetic variant of MAT1A showed interactions with gender and plasma methionine on plasma SAM concentrations. Improving plasma methionine concentrations may increase plasma SAM concentrations in a subset of a population, depending on this MAT1A genotype and gender. Future studies are warranted to confirm our findings.
Acknowledgements
The contributions of authors were as follows – MI-C, HHN, KR, and J-MY: study concept and design of the research; MI-C, HHN, and J-MY: data analysis and interpretation; MI-C, EA, TB, and J-MY: drafting of the manuscript; W-PK and J-MY: acquisition of data; EA and TB: assays for plasma concentrations of betaine, choline, Hcy, methionine, SAH and SAM; J-MY: study concept and design and obtaining funding to support the parent cohort of the present project.
We thank Siew-Hong Low of the National University of Singapore for supervising the field work of the Singapore Chinese Health Study, Kazuko Arakawa and Renwei Wang for the development and maintenance of the cohort study database, and Kenneth Beckman and Dinesha Walek at the University of Minnesota BioMedical Genomics Center (BMGC) for performing DNA extraction and genotyping. Finally, we acknowledge the founding, long-standing Principal Investigator of the Singapore Chinese Health Study – Mimi C. Yu.
This study was supported by National Cancer Institute (R01 CA55069, R35 CA53890, R01 CA80205, and R01 CA144034).
References
- 1.Kim YI. Folate and DNA methylation: a mechanistic link between folate deficiency and colorectal cancer? Cancer Epidemiol Biomarkers Prev. 2004;13:511–519. [PubMed] [Google Scholar]
- 2.Kim YI. Nutritional epigenetics: impact of folate deficiency on DNA methylation and colon cancer susceptibility. J Nutr. 2005;135:2703–2709. doi: 10.1093/jn/135.11.2703. [DOI] [PubMed] [Google Scholar]
- 3.Hoffman DR, Cornatzer WE, Duerre JA. Relationship between tissue levels of S-adenosylmethionine, S-adenylhomocysteine, and transmethylation reactions. Can J Biochem. 1979;57:56–65. doi: 10.1139/o79-007. [DOI] [PubMed] [Google Scholar]
- 4.Jaenisch R, Bird A. Epigenetic regulation of gene expression: how the genome integrates intrinsic and environmental signals. Nat Genet. 2003;33(Suppl):245–254. doi: 10.1038/ng1089. [DOI] [PubMed] [Google Scholar]
- 5.Gama-Sosa MA, Slagel VA, Trewyn RW, Oxenhandler R, Kuo KC, Gehrke CW, Ehrlich M. The 5-methylcytosine content of DNA from human tumors. Nucleic Acids Res. 1983;11:6883–6894. doi: 10.1093/nar/11.19.6883. [DOI] [PMC free article] [PubMed] [Google Scholar]
- 6.Issa JP. Aging, DNA methylation and cancer. Crit Rev Oncol Hematol. 1999;32:31–43. doi: 10.1016/s1040-8428(99)00019-0. [DOI] [PubMed] [Google Scholar]
- 7.Chalitchagorn K, Shuangshoti S, Hourpai N, Kongruttanachok N, Tangkijvanich P, Thongngam D, Voravud N, Sriuranpong V, Mutirangura A. Distinctive pattern of LINE-1 methylation level in normal tissues and the association with carcinogenesis. Oncogene. 2004;23:8841–8846. doi: 10.1038/sj.onc.1208137. [DOI] [PubMed] [Google Scholar]
- 8.Hoffmann MJ, Schulz WA. Causes and consequences of DNA hypomethylation in human cancer. Biochem Cell Biol. 2005;83:296–321. doi: 10.1139/o05-036. [DOI] [PubMed] [Google Scholar]
- 9.Goelz SE, Vogelstein B, Hamilton SR, Feinberg AP. Hypomethylation of DNA from benign and malignant human colon neoplasms. Science. 1985;228:187–190. doi: 10.1126/science.2579435. [DOI] [PubMed] [Google Scholar]
- 10.Suter CM, Martin DI, Ward RL. Hypomethylation of L1 retrotransposons in colorectal cancer and adjacent normal tissue. Int J Colorectal Dis. 2004;19:95–101. doi: 10.1007/s00384-003-0539-3. [DOI] [PubMed] [Google Scholar]
- 11.Saw SM, Yuan JM, Ong CN, Arakawa K, Lee HP, Coetzee GA, Yu MC. Genetic, dietary, and other lifestyle determinants of plasma homocysteine concentrations in middle-aged and older Chinese men and women in Singapore. Am J Clin Nutr. 2001;73:232–239. doi: 10.1093/ajcn/73.2.232. [DOI] [PubMed] [Google Scholar]
- 12.Olthof MR, van Vliet T, Boelsma E, Verhoef P. Low dose betaine supplementation leads to immediate and long term lowering of plasma homocysteine in healthy men and women. J Nutr. 2003;133:4135–4138. doi: 10.1093/jn/133.12.4135. [DOI] [PubMed] [Google Scholar]
- 13.Balaghi M, Horne DW, Wagner C. Hepatic one-carbon metabolism in early folate deficiency in rats. Biochem J. 1993;291:145–149. doi: 10.1042/bj2910145. [DOI] [PMC free article] [PubMed] [Google Scholar]
- 14.Miller JW, Nadeau MR, Smith J, Smith D, Selhub J. Folate-deficiency-induced homocysteinaemia in rats: disruption of S-adenosylmethionine's co-ordinate regulation of homocysteine metabolism. Biochem J. 1994;298:415–419. doi: 10.1042/bj2980415. [DOI] [PMC free article] [PubMed] [Google Scholar]
- 15.Lu SC, Martinez-Chantar ML, Mato JM. Methionine adenosyltransferase and S-adenosylmethionine in alcoholic liver disease. J Gastroenterol Hepatol. 2006;21(Suppl 3):S61–64. doi: 10.1111/j.1440-1746.2006.04575.x. [DOI] [PubMed] [Google Scholar]
- 16.LeGros L, Halim AB, Chamberlin ME, Geller A, Kotb M. Regulation of the human MAT2B gene encoding the regulatory beta subunit of methionine adenosyltransferase, MAT II. J Biol Chem. 2001;276:24918–24924. doi: 10.1074/jbc.M102816200. [DOI] [PubMed] [Google Scholar]
- 17.Cai J, Mao Z, Hwang JJ, Lu SC. Differential expression of methionine adenosyltransferase genes influences the rate of growth of human hepatocellular carcinoma cells. Cancer Res. 1998;58:1444–1450. [PubMed] [Google Scholar]
- 18.Ramani K, Yang H, Kuhlenkamp J, Tomasi L, Tsukamoto H, Mato JM, Lu SC. Changes in the expression of methionine adenosyltransferase genes and S-adenosylmethionine homeostasis during hepatic stellate cell activation. Hepatology. 2010;51:986–995. doi: 10.1002/hep.23411. [DOI] [PMC free article] [PubMed] [Google Scholar]
- 19.Chamberlin ME, Ubagai T, Mudd SH, Levy HL, Chou JY. Dominant inheritance of isolated hypermethioninemia is associated with a mutation in the human methionine adenosyltransferase 1A gene. Am J Hum Genet. 1997;60:540–546. [PMC free article] [PubMed] [Google Scholar]
- 20.Lai CQ, Parnell LD, Troen AM, Shen J, Caouette H, Warodomwichit D, Lee YC, Crott JW, Qiu WQ, Rosenberg IH, Tucker KL, Ordovas JM. MAT1A variants are associated with hypertension, stroke, and markers of DNA damage and are modulated by plasma vitamin B-6 and folate. Am J Clin Nutr. 2010;91:1377–1386. doi: 10.3945/ajcn.2009.28923. [DOI] [PMC free article] [PubMed] [Google Scholar]
- 21.Hankin JH, Stram DO, Arakawa K, Park S, Low SH, Lee HP, Yu MC. Singapore Chinese Health Study: development, validation, and calibration of the quantitative food frequency questionnaire. Nutr Cancer. 2001;39:187–195. doi: 10.1207/S15327914nc392_5. [DOI] [PubMed] [Google Scholar]
- 22.Ubbink JB, Hayward Vermaak WJ, Bissbort S. Rapid high-performance liquid chromatographic assay for total homocysteine levels in human serum. J Chromatogr. 1991;565:441–446. doi: 10.1016/0378-4347(91)80407-4. [DOI] [PubMed] [Google Scholar]
- 23.Stage FK, Carter HC, Nora A. Path Analysis: An Introduction and Analysis of a Decade of Research. Journal of Educational Research. 2004;98:5–12. [Google Scholar]
- 24.Stramentinoli G, Gualano M, Catto E, Algeri S. Tissue levels of S-adenosylmethionine in aging rats. J Gerontol. 1977;32:392–394. doi: 10.1093/geronj/32.4.392. [DOI] [PubMed] [Google Scholar]
- 25.van Driel LM, Eijkemans MJ, de Jonge R, de Vries JH, van Meurs JB, Steegers EA, Steegers-Theunissen RP. Body mass index is an important determinant of methylation biomarkers in women of reproductive ages. J Nutr. 2009;139:2315–2321. doi: 10.3945/jn.109.109710. [DOI] [PubMed] [Google Scholar]
- 26.nstitute of Medicine. Dietary Reference Intakes for Thiamin, Riboflavin, Niacin, Vitamin B6, Folate, Vitamin B12, Pantothenic Acid, Biotin, and Choline. Washington, D.C.: The National Academies Press; 1998. [PubMed] [Google Scholar]
- 27.Kim YI, Miller JW, da Costa KA, Nadeau M, Smith D, Selhub J, Zeisel SH, Mason JB. Severe folate deficiency causes secondary depletion of choline and phosphocholine in rat liver. J Nutr. 1994;124:2197–2203. doi: 10.1093/jn/124.11.2197. [DOI] [PubMed] [Google Scholar]
- 28.Jacob RA, Jenden DJ, Allman-Farinelli MA, Swendseid ME. Folate nutriture alters choline status of women and men fed low choline diets. J Nutr. 1999;129:712–717. doi: 10.1093/jn/129.3.712. [DOI] [PubMed] [Google Scholar]
- 29.Hung J, Abratte CM, Wang W, Li R, Moriarty DJ, Caudill MA. Ethnicity and folate influence choline status in young women consuming controlled nutrient intakes. J Am Coll Nutr. 2008;27:253–259. doi: 10.1080/07315724.2008.10719697. [DOI] [PubMed] [Google Scholar]
- 30.Abratte CM, Wang W, Li R, Moriarty DJ, Caudill MA. Folate intake and the MTHFR C677T genotype influence choline status in young Mexican American women. J Nutr Biochem. 2008;19:158–165. doi: 10.1016/j.jnutbio.2007.02.004. [DOI] [PMC free article] [PubMed] [Google Scholar]
- 31.Bailey RL, Dodd KW, Gahche JJ, Dwyer JT, McDowell MA, Yetley EA, Sempos CA, Burt VL, Radimer KL, Picciano MF. Total folate and folic acid intake from foods and dietary supplements in the United States: 2003-2006. Am J Clin Nutr. 2010;91:231–237. doi: 10.3945/ajcn.2009.28427. [DOI] [PMC free article] [PubMed] [Google Scholar]
- 32.Finkelstein JD, Kyle WE, Martin JJ. Abnormal methionine adenosyltransferase in hypermethioninemia. Biochem Biophys Res Commun. 1975;66:1491–1497. doi: 10.1016/0006-291x(75)90527-6. [DOI] [PubMed] [Google Scholar]
- 33.Gaull GE, Tallan HH, Lonsdale D, Przyrembel H, Schaffner F, von Bassewitz DB. Hypermethioninemia associated with methionine adenosyltransferase deficiency: clinical, morphologic, and biochemical observations on four patients. J Pediatr. 1981;98:734–741. doi: 10.1016/s0022-3476(81)80833-5. [DOI] [PubMed] [Google Scholar]
- 34.Yi P, Melnyk S, Pogribna M, Pogribny IP, Hine RJ, James SJ. Increase in plasma homocysteine associated with parallel increases in plasma S-adenosylhomocysteine and lymphocyte DNA hypomethylation. J Biol Chem. 2000;275:29318–29323. doi: 10.1074/jbc.M002725200. [DOI] [PubMed] [Google Scholar]
- 35.Kerins DM, Koury MJ, Capdevila A, Rana S, Wagner C. Plasma S-adenosylhomocysteine is a more sensitive indicator of cardiovascular disease than plasma homocysteine. Am J Clin Nutr. 2001;74:723–729. doi: 10.1093/ajcn/74.6.723. [DOI] [PubMed] [Google Scholar]
- 36.Loehrer FM, Tschopl M, Angst CP, Litynski P, Jager K, Fowler B, Haefeli WE. Disturbed ratio of erythrocyte and plasma S-adenosylmethionine/S-adenosylhomocysteine in peripheral arterial occlusive disease. Atherosclerosis. 2001;154:147–154. doi: 10.1016/s0021-9150(00)00449-4. [DOI] [PubMed] [Google Scholar]
- 37.Barbosa PR, Stabler SP, Trentin R, Carvalho FR, Luchessi AD, Hirata RD, Hirata MH, Allen RH, Guerra-Shinohara EM. Evaluation of nutritional and genetic determinants of total homocysteine, methylmalonic acid and S-adenosylmethionine/ S-adenosylhomocysteine values in Brazilian childbearing-age women. Clin Chim Acta. 2008;388:139–147. doi: 10.1016/j.cca.2007.10.023. [DOI] [PubMed] [Google Scholar]
- 38.Struys EA, Jansen EE, de Meer K, Jakobs C. Determination of S-adenosylmethionine and S-adenosylhomocysteine in plasma and cerebrospinal fluid by stable-isotope dilution tandem mass spectrometry. Clin Chem. 2000;46:1650–1656. [PubMed] [Google Scholar]
- 39.Melnyk S, Pogribna M, Pogribny IP, Yi P, James SJ. Measurement of plasma and intracellular S-adenosylmethionine and S-adenosylhomocysteine utilizing coulometric electrochemical detection: alterations with plasma homocysteine and pyridoxal 5'-phosphate concentrations. Clin Chem. 2000;46:265–272. [PubMed] [Google Scholar]
- 40.Gellekink H, van Oppenraaij-Emmerzaal D, van Rooij A, Struys EA, den Heijer M, Blom HJ. Stable-isotope dilution liquid chromatography-electrospray injection tandem mass spectrometry method for fast, selective measurement of S-adenosylmethionine and S-adenosylhomocysteine in plasma. Clin Chem. 2005;51:1487–1492. doi: 10.1373/clinchem.2004.046995. [DOI] [PubMed] [Google Scholar]