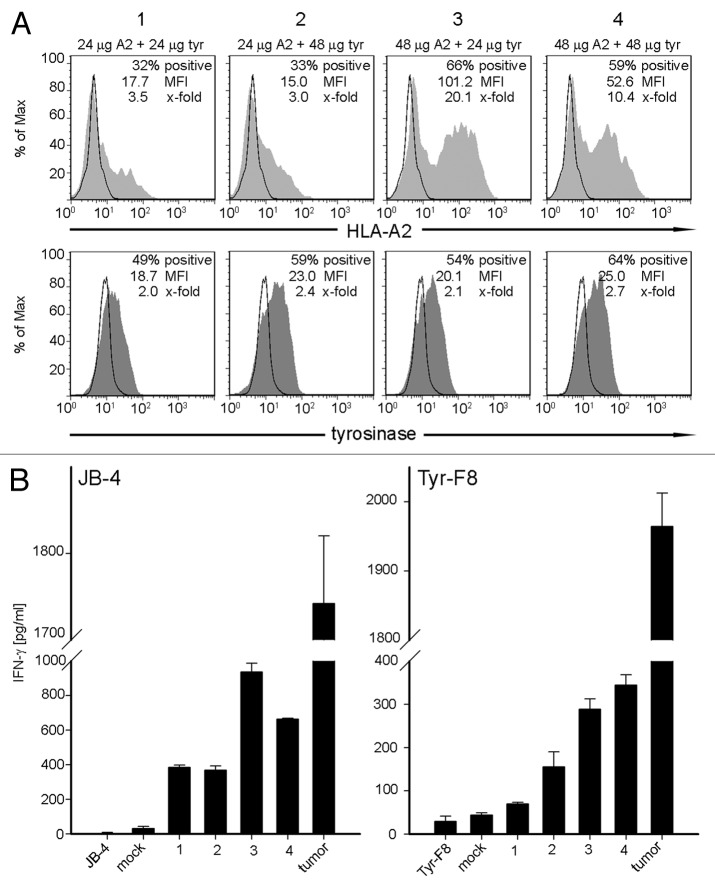
Figure 3. Co-expression of two different ivt-RNA species encoding HLA-A2 and tyrosinase. mDC are electroporated with four different ivt-RNA combinations: (1) 24 µg HLA-A2 and 24 µg tyrosinase ivt-RNA, (2) 24 µg HLA-A2 and 48 µg tyrosinase ivt-RNA, (3) 48 µg HLA-A2 and 24 µg tyrosinase ivt-RNA and (4) 48 µg HLA-A2 and 48 µg tyrosinase ivt-RNA are mixed and co-transfected into mDC of an HLA-A2- donor. (A) Surface staining of HLA-A2 is performed at 6 h and intracellular staining of tyrosinase at 3 h after transfection and analyzed by flow cytometry. HLA-A2 expression is represented by filled curves, corresponding tyrosinase expression of the same sample is shown beneath by filled curves. Mock-control mDC are included in the respective histograms by open curves. Percent positive cells, MFI and x-fold expression are shown in the upper right corner of each histogram. (B) Stimulatory capacity of the mDC loaded with different concentrations of HLA-A2 and tyrosinase ivt-RNA is analyzed by induction of IFNγ secretion of specific T cell clones. Columns represent the amount of IFNγ (pg/ml) secreted by a tyrosinase-independent HLA-A2 allo-reactive CTL (JB4) and an HLA-A2-restricted tyrosinase peptide-specific CTL (Tyr-F8) after co-incubation with ivt-RNA-pulsed DC, 24 h after electroporation. IFNγ is quantified in culture supernatants by ELISA. Mean values and mean deviations are derived from duplicate measurements. IFNγ secretion of T cells alone and in co-culture with non-transfected mock mDC serve as negative controls. Maximal IFNγ release of the CTL is observed in co-cultures with the tumor cell line Mel-93.04A12 as the positive control.

An official website of the United States government
Here's how you know
Official websites use .gov
A
.gov website belongs to an official
government organization in the United States.
Secure .gov websites use HTTPS
A lock (
) or https:// means you've safely
connected to the .gov website. Share sensitive
information only on official, secure websites.
