Abstract
Objective:
To use statistical control charts in a series of audits to improve the acceptance and consistant use of guidelines, and reduce the variations in prescription processing in primary health care.
Methods:
A series of audits were done at the main satellite of King Saud Housing Family and Community Medicine Center, National Guard Health Affairs, Riyadh, where three general practitioners and six pharmacists provide outpatient care to about 3000 residents. Audits were carried out every fortnight to calculate the proportion of prescriptions that did not conform to the given guidelines of prescribing and dispensing. Simple random samples of thirty were chosen from a sampling frame of all prescriptions given in the two previous weeks. Thirty six audits were carried out from September 2004 to February 2006. P-charts were constructed around a parametric specification of non-conformities not exceeding 25%.
Results:
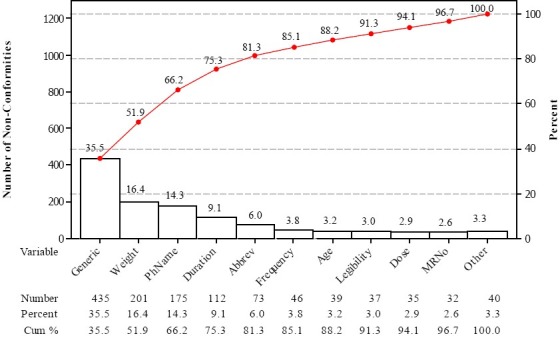
Of the 1081 prescriptions, the most frequent non-conformity was failure to write generic names (35.5%), followed by the failure to record patient's weight (16.4%), pharmacist's name (14.3%), duration of therapy (9.1%), and the use of inappropriate abbreviations (6.0%). Initially, 100% of prescriptions did not conform to the guidelines, but within a period of three months, this came down to 40%.
Conclusions:
A process of audits in the context of statistical process control is necessary for any improvement in the implementation of guidelines in primary care. Statistical process control charts are an effective means of visual feedback to the care providers.
Keywords: Statistical Process Control, Audit, Prescribing, Prescription, Guidelines, Implementation, Proportion nonconforming, Nonconformity, p-charts
INTRODUCTION
The quality of service in primary care is important in influencing and shaping patient satisfaction. It improves the delivery of care at this level and improves health outcomes.1 The provision of clear, high quality evidence based guidelines and effective strategies for their implementation2,3 are necessary for any systematic, effective and efficient improvement in the quality of care in clinical practice.4 Failure to implement these guidelines, on the other hand, is associated with poor outcomes.5
In order to bring about change in clinical practice, it is necessary to generate local support for the implementation of guidelines, a vital part of development.6 Any obstacles to implementation should be properly dealt with7 systems of clinical audits carried out and information feedback provided to care providers.6,8,9
Short-term success in the implementation of guidelines may not guarantee continued provision of good care.10,11 Therefore, it is necessary to put in place a dependable system of sustained improvement. Frequent serial audits, commensurate with the volume of work in the service concerned, as well as a simplified, systematic feedback given to those involved in care, can provide this system of sustained improvement.
Although audits and feedbacks are widely used in healthcare to improve professional practice,12 analysis and interpretation of results of audits may be difficult unless methods used take into account the random variations inherent in any process.13 The use of scientific techniques that take such variations into account is important for the monitoring of clinical practice14 to detect the reaons for variations in performance in order to minimize them by making modifications to the service and15 providing a mechanism for continuous, concurrent evaluation of reality.16 According to given clinical contexts, these techniques include Sequential Probability Ratio Test14 and Statistical Process Control.17,18
In most primary care facilities, there is no system of regular, routine audits in the different service components. Any audits done are sporadic unrelated initiatives. Whatever assessments and reviews there are, often subjective with no explicit reference to predetermined standards of practice.19
In order to improve the process of care in different areas of practice, we conducted a series of audits focusing on clearly defined processes and standards. These were based on guidelines provided by parent departments and the feedback of results given to all employees involved in direct patient care.
This current series of audits was initiated as a result of observations made by colleagues in the pharmaceutical services on the lack of conformity by most clinicians to the given guidelines. Our objective was to induce the required behavioral change in clinical practice by providing regular feedbacks to care providers on the status of their practice using scientifically sound methodology that recognizes random variation.
In this paper, we present the results of audits on prescribing and dispensing practices in the main satellite of King Saud Housing Family and Community Medicine Center, one of the primary care access points of National Guard Health Affairs in Riyadh.
METHODS
In the main clinic, one of the three satellites for the center, three general practitioners provide outpatient services for about 3,000 patients. Each physician generates more than 300 prescriptions per weeky. Six pharmacists provide dispensing services for routine and urgent care facilities in the center.
For the purpose of these audits, compliance with all components of the guidelines of prescribing and dispensing provided by the pharmaceutical services of King Fahad National Guard Hospital was used as the criterion for appropriate prescription processing. The guidelines consist of 14 components: recording file number, patient's age, weight , diagnosis, and generic drug name; specification of dose, frequency, and duration; avoidance of non-standard abbreviations, absence of contraindications (including interactions), recording of dispensing pharmacist's and prescribing doctor's names, date of prescription and legibility of handwriting.
Concerns on the lack of weighting the non-conformities according to their seriousness and the involvement of more than one component of care i.e. general practice clinic and pharmacy were discussed. By a consensus of the physicians and the pharmacists, a decision was taken to use the whole set of instructions in the guidelines.
Conformity to the given criterion, a binary outcome variable subject to random and systematic variations, was studied by constructing p-charts using the formula[ ], with the center line at 0.25, upper control line at 0.49, and lower control line at 0.01, based on the initial parametric target of proportion of non-conformities not exceeding 25% of prescriptions, a figure that was arbitrarily determined in consultation with management.
Sample size was set at 30, as this number satisfied the condition for sufficiency of sample size in that both n(p) and n(1-p) … 30×0.25, 30×0.75, are above 5.20 Based on the work flow and staff availability, it was decided that fortnightly audits should be carried out.
A questionnaire was prepared and a database created using Epidata.21 A decision on the appropriateness of prescription processing was generated automatically by the database program based on the responses provided to the 14 binary yes-no variables. Non-conformity to any of the given components would render a prescription “non-conforming to the criterion of appropriate processing.” The database was deployed in the pharmacy, and pharmacists were trained to enter data and analyse them using EpiInfo.22
A simple random sample of 30 prescriptions was chosen every two weeks from a sampling frame of all prescriptions during the period, using a computer program. A questionnaire was filled for each prescription by a pharmacist; data were entered in the database and checked by another pharmacist for accuracy of information. Although information about individual performance of concerned employees was available, individually tailored feedback was not implemented. The only intervention consisted of an explanation of Statistical Process Control Charts and Pareto charts of non-conformities for the last audit to all care providers in a group and an exhibition of charts for them at the work place. This report is based on data generated from 36 audits carried out from September 2004 to February 2006.
DATA ANALYSIS
Proportions are reported as percentages. Exact binomial confidence intervals are used for the estimation of binary outcome parameters. Cuzick's test P-Value is reported for trend across ordered groups. Analyses were carried out with Epi-Info 6.04d22 and Stata Version 8.2.23
RESULTS
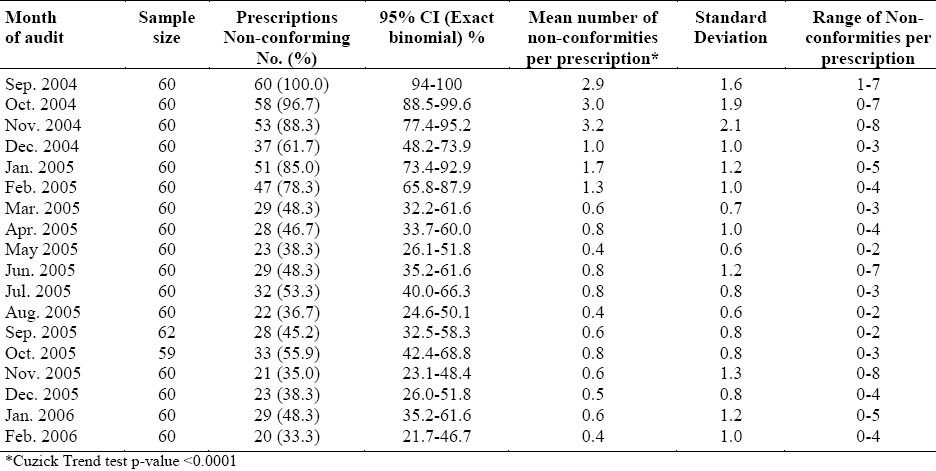
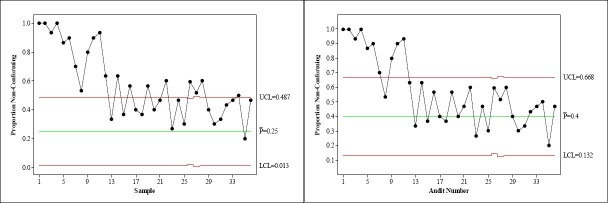
At the end of the audit period, complete information on 1081 prescriptions was available for analysis. Initially, 100% of the prescriptions studied did not non-conform to the defined criterion of appropriate processing of prescriptions. A noticeable decline in non-conformities was observed as a result of regular weekly feedback of the situation to physicians (Table 1, Figure 1). Within a period of three months, the proportion, although still not in control at the given level of 25%, had fallen to a level that was in control at 40%, with a maximum run of consecutive points on one side of center line at three 3 (Figure 1).
Table 1.
Average number of non-conformities per prescription by audits at King Saud City Family & Community Medicine Center, National Guard Health Affairs, Riyadh (September 2004-February 2006)

Figure 1.
Attribute Chart (p-chart) for proportion of prescription nonconforming with the given guidelines, compared with Center Lines at 0.25 and 0.4
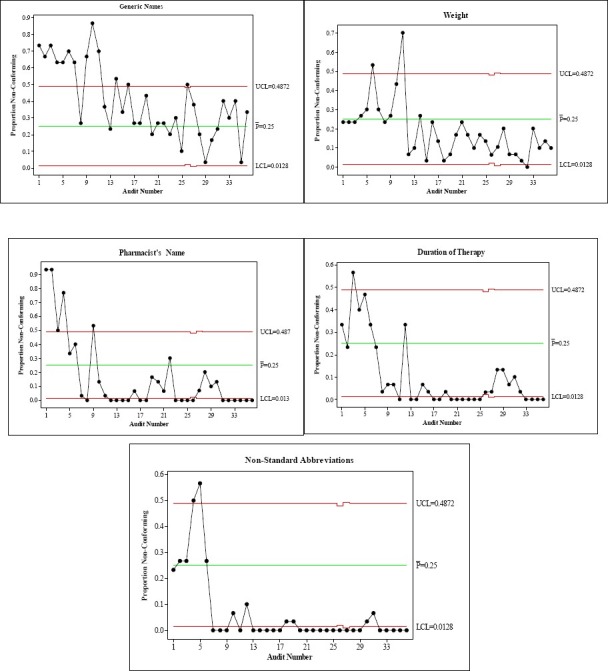
Regarding the non-conformities, failure to write generic names (35.5%), patient weight (16.4%), pharmacist's name (14.3%), duration of therapy (9.1%) and the use of inappropriate abbreviations (6.0%) accounted for more than 81% of non-conformities (Figure 2). Mean non-conformities per prescription showed a significant decrease (p-value < 0.0001) over time, falling from 2.9 non-conformities per prescription at first audit to only 0.4 per prescription in the last audit (Table 1). Regarding individual non-conformities, recording the generic drug name was the most resistant to change (Figure 3), followed by the recording of the patient's weight. Recording pharmacist's identity, duration of therapy, and the use of non-standard abbreviations had improved much earlier. The first two, generic drug name and patients weight, were the most resistant to change probably because of the need for improvements in physicians’ knowledge, and in nursing services routines. A concurrent collaborative focus of continuing education might have produced quicker and better results.
Figure 2.

Pareto chart of Non-conformities with the given guidelines (N=1225)
Figure 3.

Attribute charts (p-chart) showing variation in improvement of individual non-conformities
DISCUSSION
Implementation of guidelines in healthcare has generally been reported as fragmented and inconsistent24 and still remains a significant challenge for various healthcare organizations.25–27 Various factors are responsible for this phenomenon. These include the lack of training of the care providers in quality management,28 lack of resources, lack of awareness of the details of the guidelines, and the lack of acceptance of the given recommendations25 by those involved in the process of care. The initial problems of learning to use statistical techniques at the work place may also be an obstacle, although experience tells us that this may not be such a daunting task.29
As audits coupled with timely, individualized, and non-punitive feedback to care providers have resulted in better adherence to clinical practice guidelines,30 a system of regular feedbacks of the status of practice to the care providers can be an effective, affordable, and scientifically sound tool that decision makers at different levels of administrative hierarchy can utilize to facilitate improvement.
A surprising initial 100% level of non-compliance was discovered in spite of the clear brief guidelines given to the different categories of care providers in the service more than a year before the process of audit was started.
In addition, other measures such as properly designed, recorded and archived prescription sheets, a well-systematized communication of pharmacists with physicians regarding their concerns about prescriptions, and an ongoing program of continuing medical education for various categories of staff are necessary.
This high proportion of non-conformity fell to 40% within a period of three months of regular audits and feedbacks. Our general feedback process consisted of the presentation of the p-charts and Pareto charts to a group of care providers without any individually tailored feedbacks of interviews. It is our feeling that any individual communication and counseling might have resulted in an even better outcome of achieving the given target of non-conformities of less than 25%.
The use of Statistical Process Control Charts as tools to detect and analyze process variation is a well-known technique. We found that, after we explained their structure to those involved in the process of prescribing and dispensing, the charts provided a very effective visual feedback by clearly depicting sample results compared with the targeted parameter.
The whole initiative was generated, managed, and maintained locally by physicians, nurses, and pharmacists, with no help from outside the practice. We strongly recommend incorporating such initiatives routinely in the functions of different components in primary care.
CONCLUSION
Ongoing audit processes should be incorporated in primary care routines. Statistical Process Control Charts put the audits in perspective and can provide a visual feedback of audit results to care providers in an effective, efficient and sustainable manner by means of local resource.
ACKNOWLEDGMENTS
We thank the staff of King Saud City Family & Community Medicine Center for their dedication and hard work in pursuit of their commitment to continually provide the best quality care to their clients
REFERENCES
- 1.McElduff P, Lyratzopoulos G, Edwards R, Heller RF, Shekelle P, Roland M. Will changes in primary care improve health outcomes.Modelling the impact of financial incentives introduced to improve quality of care in the UK? Qual Saf Health Care. 2004;13(3):191–7. doi: 10.1136/qshc.2003.007401. [DOI] [PMC free article] [PubMed] [Google Scholar]
- 2.Randall G, Taylor DW. Clinical practice guidelines: the need for improved implementation strategies. Healthc Manage Forum. 2000;13(1):36–42. doi: 10.1016/S0840-4704(10)60731-4. [DOI] [PubMed] [Google Scholar]
- 3.Ockene JK, Zapka JG. Provider education to promote implementation of clinical practice guidelines. Chest. 2000;118(2 Suppl):33S–9S. doi: 10.1378/chest.118.2_suppl.33s. [DOI] [PubMed] [Google Scholar]
- 4.Wright J, Bibby J, Eastham J, Harrison S, McGeorge M, Patterson C, et al. Multifaceted implementation of stroke prevention guidelines in primary care: cluster-randomised evaluation of clinical and cost effectiveness. Qual Saf Health Care. 2007;16(1):51–9. doi: 10.1136/qshc.2006.019778. [DOI] [PMC free article] [PubMed] [Google Scholar]
- 5.Gomez-Doblas JJ. Implementation of Clinical Guidelines. Rev Esp Cardiol. 2006;59(Suppl 3):29–35. doi: 10.1157/13096255. [DOI] [PubMed] [Google Scholar]
- 6.Conroy M, Shannon W. Clinical guidelines: their implementation in general practice. Br J Gen Pract. 1995;45(396):371–5. [PMC free article] [PubMed] [Google Scholar]
- 7.Moulding NT, Silagy CA, Weller DP. A framework for effective management of change in clinical practice: dissemination and implementation of clinical practice guidelines. Qual Health Care. 1999;8(3):177–83. doi: 10.1136/qshc.8.3.177. [DOI] [PMC free article] [PubMed] [Google Scholar]
- 8.Hutchinson A. The philosophy of clinical practice guidelines: purposes, problems, practicality and implementation. J Qual Clin Pract. 1998;18(1):63–73. [PubMed] [Google Scholar]
- 9.Walker NM, Ward NJ, Richards RH. Audit of elective paediatric clinic referrals from primary care February 2002-September 2006. J Pediatr Orthop B. 2007;16(6):447–50. doi: 10.1097/BPB.0b013e3282e61ad2. [DOI] [PubMed] [Google Scholar]
- 10.Brand C, Landgren F, Hutchinson A, Jones C, Macgregor L, Campbell D. Clinical practice guidelines: barriers to durability after effective early implementation. Intern Med J. 2005;35(3):162–9. doi: 10.1111/j.1445-5994.2004.00763.x. [DOI] [PubMed] [Google Scholar]
- 11.Grol R. Successes and failures in the implementation of evidence-based guidelines for clinical practice. Med Care. 2001;39(8 Suppl 2):II46–54. doi: 10.1097/00005650-200108002-00003. [DOI] [PubMed] [Google Scholar]
- 12.Jamtvedt G, Young JM, Kristoffersen DT, O’Brien MA, Oxman AD. Audit and feedback: effects on professional practice and health care outcomes. Cochrane Database Syst Rev. 2006;(2):CD000259. doi: 10.1002/14651858.CD000259.pub2. [DOI] [PubMed] [Google Scholar]
- 13.Benneyan JC, Lloyd RC, Plsek PE. Statistical process control as a tool for research and healthcare improvement. Qual Saf Health Care. 2003;12(6):458–64. doi: 10.1136/qhc.12.6.458. [DOI] [PMC free article] [PubMed] [Google Scholar]
- 14.Spiegelhalter D, Grigg O, Kinsman R, Treasure T. Risk-adjusted sequential probability ratio tests: applications to Bristol, Shipman and adult cardiac surgery. Int J Qual Health Care. 2003;15:7–13. doi: 10.1093/intqhc/15.1.7. [DOI] [PubMed] [Google Scholar]
- 15.Dey ML, Sluyter GV, Keating JE. Statistical process control and direct care staff performance. J Ment Health Adm. 1994;2(2):201–9. doi: 10.1007/BF02521327. [DOI] [PubMed] [Google Scholar]
- 16.Sellick JA., Jr The use of statistical process control charts in hospital epidemiology. Infect Control Hosp Epidemiol. 1993;14(11):649–56. doi: 10.1086/646659. [DOI] [PubMed] [Google Scholar]
- 17.Atkinson S. Applications of statistical process control in health care. Manag Care Q. 1994;2(3):57–69. [PubMed] [Google Scholar]
- 18.Thor J, Lundberg J, Ask J, Olsson J, Carli C, Harenstam KP, et al. Application of statistical process control in healthcare improvement: systematic review. Qual Saf Health Care. 2007;16(5):387–99. doi: 10.1136/qshc.2006.022194. [DOI] [PMC free article] [PubMed] [Google Scholar]
- 19.Lim T. Statistical process control tools for monitoring clinical performance. Int J Qual Health Care. 2003;15(1):3–4. doi: 10.1093/intqhc/15.1.3. [DOI] [PubMed] [Google Scholar]
- 20.Smith GM. Statistical Process Control and Quality Improvement. Fifth ed. Pearson Education; 2004. [Google Scholar]
- 21.Lauritsen J, Bruus M. EpiData (version 3). A comprehensive tool for validated entry and documentation of data. The EpiData Association, Odense Denmark. 2003 - 2004 [Google Scholar]
- 22.Dean A, Dean J, Coulombier D, Brendel K, Smith D, Burton A, et al. Epi Info, Version 6: a word processing, database, and statistics program for epidemiology on IBM microcomputers. Atlanta, Georgia, USA: Center for Disease Control and Prevention; 1995. [Google Scholar]
- 23.Stata Statistical Software, College Station. 8.2 ed. TX: Stata Corporation; 2005. StataCorp. [Google Scholar]
- 24.Ploeg J, Davies B, Edwards N, Gifford W, Miller PE. Factors influencing best-practice guideline implementation: lessons learned from administrators, nursing staff, and project leaders. Worldviews Evid Based Nurs. 2007;4(4):210–9. doi: 10.1111/j.1741-6787.2007.00106.x. [DOI] [PubMed] [Google Scholar]
- 25.Clark M. Barriers to the implementation of clinical guidelines. J Tissue Viability. 2003;13(2):62–4. doi: 10.1016/s0965-206x(03)80036-0. [DOI] [PubMed] [Google Scholar]
- 26.Burnier M. Blood pressure control and the implementation of guidelines in clinical practice: can we fill the gap? J Hypertens. 2002;20(7):1251–3. doi: 10.1097/00004872-200207000-00002. [DOI] [PubMed] [Google Scholar]
- 27.Solberg LI. Guideline implementation: why don’t we do it? (81, 2).Am Fam Physician. 2002;65(2):176. [PubMed] [Google Scholar]
- 28.Ross TK. A statistical process control case study. Quality Management in Health Care. 2006;15(4):221–36. doi: 10.1097/00019514-200610000-00004. [DOI] [PubMed] [Google Scholar]
- 29.VanderVeen LM. Statistical process control: a practical application for hospitals. J Healthc Qual. 1992;14(2):20–5. doi: 10.1111/j.1945-1474.1992.tb00018.x. [DOI] [PubMed] [Google Scholar]
- 30.Hysong SJ, Best RG, Pugh JA. Audit and feedback and clinical practice guideline adherence: Making feedback actionable. Implement Sci. 2006;1:9. doi: 10.1186/1748-5908-1-9. [DOI] [PMC free article] [PubMed] [Google Scholar]


