

Abstract
Lafora disease (LD) is caused by mutations in either the laforin or malin gene. The hallmark of the disease is the accumulation of polyglucosan inclusions called Lafora Bodies (LBs). Malin knockout (KO) mice present polyglucosan accumulations in several brain areas, as do patients of LD. These structures are abundant in the cerebellum and hippocampus. Here, we report a large increase in glycogen synthase (GS) in these mice, in which the enzyme accumulates in LBs. Our study focused on the hippocampus where, under physiological conditions, astrocytes and parvalbumin-positive (PV+) interneurons expressed GS and malin. Although LBs have been described only in neurons, we found this polyglucosan accumulation in the astrocytes of the KO mice. They also had LBs in the soma and some processes of PV+ interneurons. This phenomenon was accompanied by the progressive loss of these neuronal cells and, importantly, neurophysiological alterations potentially related to impairment of hippocampal function. Our results emphasize the relevance of the laforin–malin complex in the control of glycogen metabolism and highlight altered glycogen accumulation as a key contributor to neurodegeneration in LD.
Keywords: glycogen synthase, glycogen, Lafora, malin, neurodegeneration
INTRODUCTION
Glycogen is the principal storage form of glucose in animal and human cells. It is mainly produced in the liver and muscles, and glycogen levels in the brain are low compared to these two tissues. In the brain, this polysaccharide is stored in astrocytes, while most neurons do not accumulate it under normal conditions (Cataldo & Broadwell, 1986; Wender et al, 2000).
Glycogen is produced by glycogen synthase (GS), the only enzyme able to synthesize glucose polymers in mammals, and degraded by glycogen phosphorylase (GP). Mammals express two isoforms of GS encoded by GYS1 and GYS2. The latter encodes the liver isoform (LGS) and its expression is restricted to the liver, while the former encodes the muscle isoform (MGS) and is widely expressed excluding the liver. MGS is regulated by phoshorylation at nine serine residues located in the amino- and carboxy-terminal domains of the enzyme. Phoshorylation by several kinases, including GSK3, induces the inactivation of the enzyme, while dephosphorylation causes its activation (Skurat et al, 1994). GS is also allosterically activated by glucose-6-phosphate (G6P) in the brain (Goldberg & O'Toole, 1969) and in other tissues (Bouskila et al, 2010; Villar-Palasi & Guinovart, 1997). High levels of G6P fully activate GS even when the enzyme is phosphorylated.
In the brain, MGS is fully functional in astrocytes; neurons also express this isoform but it is kept in an inactive state under normal conditions. Both the muscle (MGP) and the brain (BGP) isoforms of GP are expressed in brain. Interestingly, astrocytes express both MGP and BGP while most neurons do not express GP (Pfeiffer-Guglielmi et al, 2003; Vilchez et al, 2007). Despite the apparent lack of glycogen metabolism in these cells, in some diseases poorly branched and insoluble glycogen, the so-called polyglucosan bodies (PGBs), accumulate in neurons [Adult Polyglucosan Body Disease (APBD, OMIM263570), Andersen Disease (GSD IV, OMIM232500) and Lafora Disease (LD; EPM2, OMIM254780)].
Lafora disease (LD) typically manifests during adolescence with generalized tonic-clonic seizures, myoclonus, absences, drop attacks or partial visual seizures. As the disease progresses, afflicted individuals suffer a rapidly progressing dementia with apraxia, aphasia, and visual loss, leading to a vegetative state and death usually in the first decade from the onset of the initial symptoms. The hallmark of LD is the presence of large inclusions of PGBs, the so-called Lafora bodies (LBs), in the somas and processes of neurons in the brain and in other tissues such as muscle and heart (Cavanagh, 1999). The mechanism by which this abnormal glycogen accumulates remains unclear. LD is inherited as an autosomal recessive disorder and has been associated with mutations in two genes: EPM2A, which encodes laforin, a dual-specificity protein phosphatase with a functional carbohydrate-binding domain; and EPM2B, which encodes malin, an E3 ubiquitin ligase. Malin ubiquitinates and promotes the degradation of laforin (Gentry et al, 2005). Individuals with mutations in EPM2A or EPM2B are neurologically and histologically indistinguishable. In spite of the long recognized aberrant accumulation of glycogen in LD, a direct link between glycogen metabolism and this neurodegenerative disease has remained elusive for decades and is still a matter of controversy.
The role of the laforin phosphatase activity in the etiopathology of LD has been widely debated. Laforin has been reported to dephosphorylate, and thus activate, glycogen synthase kinase 3 (GSK3) (Lohi et al, 2005). GSK3 activation inhibits glycogen synthesis by GS phosphorylation. Laforin has also been described to release the phosphate incorporated into glycogen by GS during its synthesis (Tagliabracci et al, 2008, 2011, 2007). So mutations in laforin would cause the overactivation of glycogen synthesis and increased phosphate content, which would alter glycogen structure, making it more prone to LB formation. Nevertheless, these hypotheses based only on the phosphatase activity of laforin fail to explain how malin deficiency causes LD.
We previously demonstrated that the laforin–malin complex blocks glycogen accumulation in cultured neurons by inducing the proteasome-dependent degradation of MGS and protein targeting to glycogen (PTG), a protein phosphatase-1 regulatory subunit responsible for the activation of MGS by dephosphorylation (Vilchez et al, 2007). In addition, PTG overexpression in cultured neurons induces the accumulation of poorly branched glycogen and cell death. Thus, we proposed that altered glycogen metabolism caused by either laforin or malin deficiency underlies LB formation and neurodegeneration in LD. Laforin disruption in mice is described to cause neurodegeneration, myoclonus epilepsy and impaired behavioural response together with LB formation (Ganesh et al, 2002) and increased levels of MGS protein are found in the brain of this model (Tagliabracci et al, 2008).
Reports on 3-month-old (DePaoli-Roach et al, 2010) and 6-month-old (Turnbull et al, 2010) mouse models of malin deficiency have recently been published. Neither describes neurological alterations. Here, we have extended the study of malin-deficient mice to 11 months. At this age, they presented neurodegeneration, increased synaptic excitability, and propensity to suffer myoclonic seizures together with increased levels of MGS in the brain. Our study analyses the hippocampal cell type-specific progression of LB appearance and it is the first to report the early presence of LBs in astroglial cells. We describe the expression of MGS and malin in a particular subset of interneurons (PV+ cells), the later appearance of LB in these cells, and their degeneration and progressive loss. In addition, we report on the hippocampal functional impairment of the malin KO animals.
RESULTS
Malin KO mice accumulate poorly branched glycogen in LBs
We bred malin KO mice up to about 1 year of age. These animals accumulated LBs, the hallmark of LD. LBs were present in several areas of the brain, being most abundant in the hippocampus and cerebellum (Fig 1A). No comparable structures in corresponding regions of control littermate animals were found. LB accumulation was not exclusive to the brain, as they were also detected in some fibres of skeletal muscle and heart (Supporting Information Fig 1). The inclusions increased in number and size with age, as can be seen by comparing 4- and 11-month-old mice (Figs 1A and 7B). Moreover, in the older mice, LBs were detected in regions of the brain that were unaffected at 4 months (Fig 1A). This result is consistent with the accumulative nature of LD.
Figure 1. Histological localization of LBs in malin KO mouse brains.

LBs are MGS-positive.
- Periodic acid-Schiff staining (PAS) and immunostaining with an antibody against muscle glycogen synthase (MGS) are shown for the hippocampus and cerebellum of 4- and 11-month-old malin KO and 11-month-old WT littermate controls. Scale bar = 100 µm, 4X = 4-fold magnification.
- Representative orthogonal confocal sections of LBs showing co-localization (yellow) of polyglucosan (red) and MGS (green) in malin KO brains. Scale bar = 10µm.
Figure 7. Malin KO mice show degeneration of PV+ interneurons in the hippocampus.
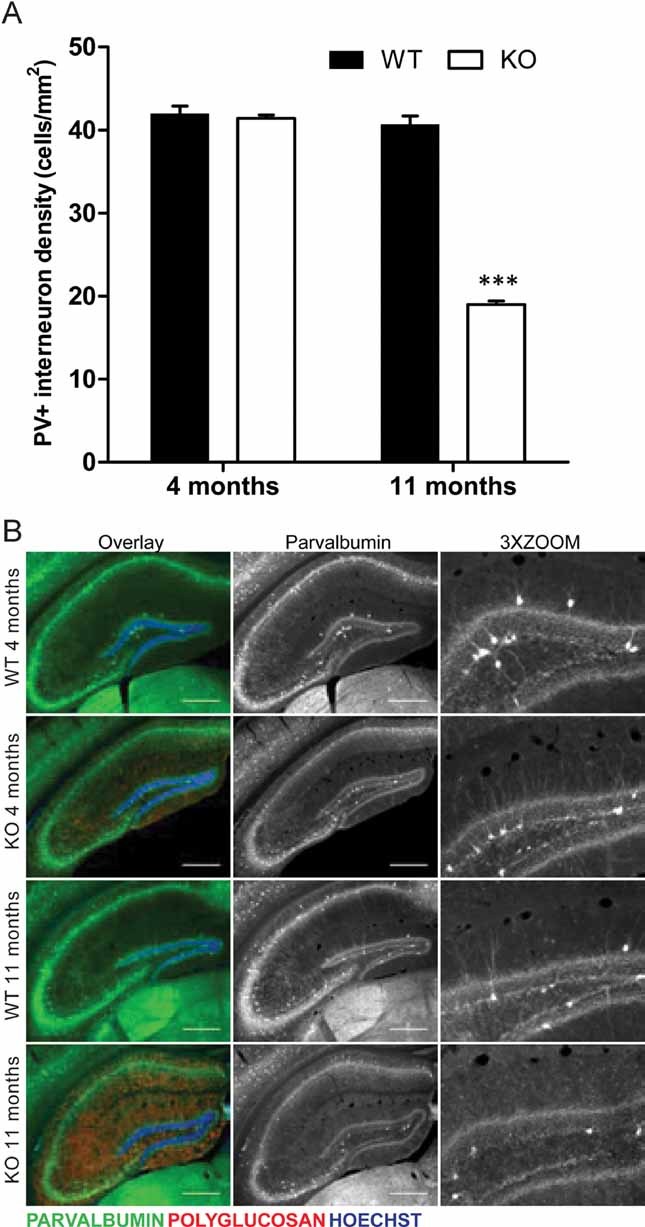
Immunofluorescence analyses are shown for hippocampus of 4- and 11-month-old malin KO mice and WT littermate controls. Antibodies were used against parvalbumin (green) and polyglucosan (red). Hoechst (blue) was used for nuclear staining.
- Density of hippocampal PV+ somas. 11-month-old malin KO mice show a 50% loss of PV+ interneurons while no difference is observed in 4-month-old malin KO animals when compared with controls. Scale bar = 400 µm. 3X ZOOM = 3-fold magnification. Data are expressed as mean ± SEM. ***p < 0.001.
- Representative images of hippocampus sections are shown as overlay of the three channels (Overlay) and the split of parvalbumin channel in greyscale (Parvalbumin). A clear decrease in the processes branching from PV+ interneurons can be observed in the 11-month-old malin KO hippocampus.
LBs are insoluble inclusions characterized by poorly branched glycogen-like polymers (Chan et al, 2005; Delgado-Escueta, 2007; Ganesh et al, 2006). We measured glycogen content in whole brain homogenates of 11-month-old malin KO animals, where the presence of LBs was most prominent. These brains showed a 2.5-fold increase in glycogen content (Fig 2A). In addition, low speed centrifugation was performed to analyse the distribution of this polysaccharide between the soluble and insoluble fractions. The increment in glycogen detected corresponded to that present in the insoluble fraction while no significant changes were found in the soluble fraction.
Figure 2. Analysis of glycogen in malin KO mouse brains.
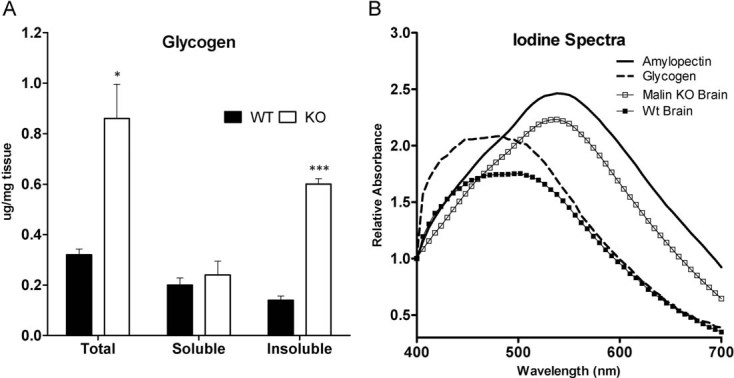
Glycogen is increased and accumulated in the pellet. Brain extracts from 11-month-old wild-type (WT) and malin knock-out (KO) mice were analysed. Total homogenates and the soluble and insoluble fractions resulting from low speed centrifugation were used for the biochemical analysis.
- Glycogen content. Data are expressed as mean ± SEM. *p < 0.05. ***p < 0.001. WT (n = 6), KO (n = 6).
- Iodine spectra of glycogen purified from total brain homogenates. Amylopectin from corn and glycogen from mouse liver are shown for reference.
The degree of glycogen branching in KO brains was measured by recording the visible absorption spectrum of purified glycogen in the presence of iodine. The lower the branching of the glucose polymer, the greater the displacement of its absorption maximum to longer wavelengths (Krisman, 1962). Glycogen isolated from a pool of KO brains was clearly less branched (peak at 537 nm) than that from control brains (peak at 492 nm) (Fig 2B).
Malin KO mice accumulate MGS in LBs
Malin has been reported to be involved in the proteasomal clearance of laforin (Gentry et al, 2005) and MGS (Vilchez et al, 2007). Therefore, we analysed the MGS content and distribution in brain sections from WT and malin KO mice. For this purpose, we used 4- and 11-month-old animals to evaluate the progression with age. The polyglucosan inclusions were immunostained for MGS (Fig 1B), thereby indicating that LBs contain the GS protein and its catalytic product (Fig 1). Western blot analysis showed highly increased MGS in total homogenate from malin KO brains compared to controls. The levels of this protein were increased in the insoluble fraction, thus strengthening the results obtained from histochemistry. As polyglucosan inclusions apparently increased in number and size with age, we also analysed the levels of other glycogen-binding proteins as laforin, glycogenin—the priming enzyme for glycogen synthesis—and GP. The levels of laforin (Fig 3A), glycogen phosphorylase muscle (MGP) and brain (BGP) isoforms, and glycogenin (Supporting Information Fig 3) were also found to be increased and accumulated in the insoluble fraction. Interestingly, MGP levels were also increased in the soluble fraction where MGS, laforin, and BGP levels remained unchanged.
Figure 3. Analysis of MGS in malin KO mouse brains.
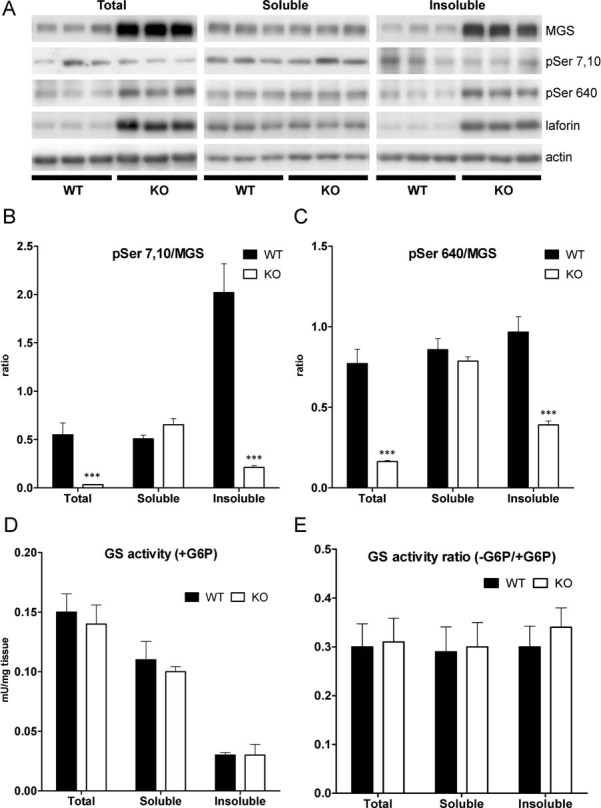
MGS protein is increased and accumulated in the insoluble fraction. Brain extracts from 11-month-old wild-type (WT) and malin knock-out (KO) mice were analysed. Total homogenates and the soluble and insoluble fractions resulting from low speed centrifugation were used for the biochemical analysis.
- A. Western blotting for MGS, GS phospho-serine 7 and 10 (pSer 7,10), GS phospho-serine 640 (pSer 640) and laforin. Actin was used as loading control.
- B,C. GS phoshorylation state. Densitometries from Western blot analysis are expressed as ratio of the signals from the enzyme phosphorylated at specific sites to total protein.
- C. Glycogen synthase (GS) activity measured in the presence of G6P.
- D. GS activity ratio (−G6P/+G6P). Data are expressed as mean ± SEM. *p < 0.05. ***p < 0.001. WT (n = 6), KO (n = 6).
Analysis of the GS phoshorylation state using specific antibodies for the N-terminal and C-terminal phoshorylation sites showed that, while the enzyme in the soluble fraction did not show changes between KO and WT mice, the enzyme present in the insoluble fraction was less phosphorylated in KO mice compared to WT in Serine residues 7 and 10 (Fig 3A and B) and 640 (Fig 3A and C), corresponding to a more active form of GS.
We also measured GS enzymatic activity in total homogenates and in the soluble and insoluble fractions. GS activity in the presence of G6P (Fig 3D) is usually taken as a measure of total GS. Surprisingly, despite the large increase in GS protein levels seen by Western blot analysis, no significant differences in total GS activity were found by activity measurements. This result indicated that MGS protein accumulated in LBs does not show activity even in presence of its allosteric activator (G6P) in the conditions assayed. The ± G6P activity ratio, an indicator of the activation state of the enzyme, was also unchanged in all fractions (Fig 3E).
Cell-type specific progression of LB appearance
The histological study of mouse brains with antibodies against MGS showed that, in addition to astrocytes, PV+ interneurons of the hippocampus also express MGS (Fig 4A). These cells can be found in the DG, CA1-2 and CA3 (not shown).
Figure 4. Hippocampal interneurons and astrocytes express MGS and malin.

Hippocampal astrocytes and interneurons from dentate gyrus (DG) and CA1 regions of WT (A) and malin heterozygous (B) hippocampi of same-aged mice are shown.
- Immunostaining with an antibody against MGS (brown).
- Representative orthogonal confocal sections showing immunostaining with antibodies against glial fibrillary acidic protein (GFAP) (red), parvalbumin (PV) (magenta) and βgal (cyan). Scale bar = 20 µm.
In the KO mice, the only exon of EPM2B is substituted by a selection cassette containing the βgal gene (Supporting Information Fig 2). Consequently, malin heterozygous mice express βgal under the control of the endogenous promoter of EPM2B. To overcome the lack of an antibody recognizing the endogenous malin protein, we used βgal as a reporter of malin expression in these animals. βgal immunodetection showed that, among other cells, some astrocytes and all PV+ interneurons express malin in the hippocampus, one of the most affected regions of the malin KO brain (Fig 4B).
While 4-month-old KO brains showed mainly astrocyte-associated LB accumulation (Figs 5 and 6A), 11-month-old counterparts showed LBs in astrocytes (Figs 5 and 6A) and in the cell bodies of neurons (Fig 5). Neuronal LBs were very conspicuous in the neuronal somata of hippocampal PV+ interneurons and were occasionally found in their dendritic processes (Fig 6B).
Figure 5. Age-associated progression of LB formation in the malin KO hippocampus.

Confocal images are shown for DG and CA1 hippocampal regions of 4- and 11-month-old malin KO mice and 11-month-old WT littermate controls. Antibodies were used against parvalbumin (green), polyglucosan (red) and GFAP (white). Hoechst (blue) was used for nuclear staining. 4-month-old malin KO mice show mainly astrocyte-associated polyglucosan accumulation (arrowheads). 11-month-old malin KO animals show both astrocyte-associated (arrowheads) and interneuronal intracellular (arrows) accumulation. Control mice do not show comparable polyglucosan accumulation. Scale bar = 10 µm.
Figure 6. Localization of LBs in hippocampal astroglia, microglia and neurons.
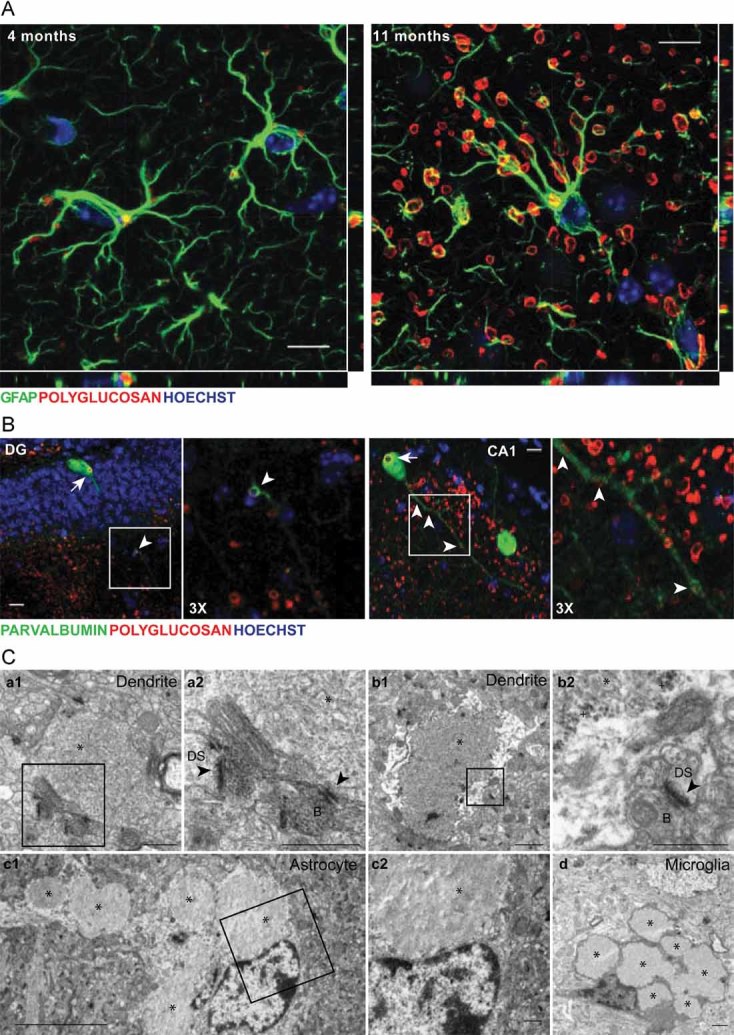
Representative images from 4-month-old (A) and 11-month-old (A–C) malin KO hippocampus.
- Orthogonal confocal sections are shown for astrocytes containing polyglucosan accumulation in the hippocampus of 4- and 11-month-old KO mice. Antibodies were used against GFAP (green) and polyglucosan (red). Hoechst (blue) was used for nuclear staining. Scale bar = 10 µm.
- Confocal images are shown for DG and CA1 hippocampal regions. Antibodies were used against parvalbumin (green) and polyglucosan (red). Hoechst (blue) was used for nuclear staining. Polyglucosan accumulation can be observed within the somas (white arrows) and some processes (white arrowheads) of PV+ interneurons. Scale bar = 10 µm. 3X = 3-fold magnification.
- Electron microscopy images are shown for CA1. Micrographs depict the presence of LBs and glycogen granules in dendrites (a1, a2, b1, b2). LBs were also found in astrocytes (c1, c2). Microglial cells with some engulfed LBs were observed (d). *, Lafora Body; +, glycogen granule; black arrowhead: postsynaptic density; B: synaptic bouton; DS: dendritic spine. a2, b2 and c2 are magnifications of the boxes in a1, b1 and c1. Scale bars are 5 µm in c1 and 0.5 µm in a1, a2, b1, b2, c2 and d.
To substantiate the above findings, we performed an electron microscopy study on hippocampal tissue from 11-month-old KO mice. Astrocytes often displayed LBs in their cytoplasm (Fig 6C c1 and c2), in agreement with the light microscopy observations (Fig 6A). We focused our attention on the dendritic profiles of the CA1 and DG. Dendrites were identified by the large number of microtubules organized in bundles and by the presence of synaptic contacts on their surface (Fig 6C a2) or on dendritic spines arising from them (Fig 6C b2). We found dendrites filled by large LBs, which distorted their size and fine structure (Fig 6C a1, a2, b1 and b2). In some cases, glycogen granules were identifiable at the periphery of these LBs. In addition, we frequently observed dark, electron-dense cells displaying the typical fine structural features of microglial cells, which engulfed large numbers of LBs (Fig 6C d). We thus concluded that LBs accumulate in glial cells and in neurons.
Degeneration of PV+ interneurons in the malin KO hippocampus
To study the effect of LB accumulation on PV+ interneurons, we counted the number of these neurons in the hippocampus at 4 and 11 months of age. We found a marked reduction in the number of PV+ neurons in the hippocampus of 11-month-old KO mice; a decrease that was not detected at 4 months of age (Fig 7A). Decreased immunolabelling of PV+ dendrites was also observed, which may suggest an impairment of dendritic arbors (Fig 7B). Since the induction of polyglucosan accumulation causes neuronal death by apoptosis in primary cultures (Vilchez et al, 2007), we analysed whether the net neuronal loss caused by malin deficiency correlated with increased rates of apoptosis. Although no clear neuronal apoptotic features were found by TUNEL, Caspase-3 activation or FluoroJadeB staining (not shown), 11-month-old KO hippocampi showed a clear increase in GFAP+ cells (Supporting Information Fig 4). This gliosis has been reported to be associated to neuronal loss in other model of LD (Turnbull et al, 2011) and it is in concordance with the observed loss of PV+ interneurons in malin KO hippocampi.
Behavioural alterations in malin KO mice
Malin KO mice developed normally and were fertile. They displayed normal gait and showed no significant differences to WT mice in the Rotarod test or in the Beam walking test. They did not present any sign of cerebellar ataxia (data not shown). Exploratory behaviour of the KO mice was evaluated in an Open Field Test (Supporting Information Fig 5). At 11 months of age, these animals were hyperactive and showed an increase in exploratory behaviour. Significant differences were found in the time spent in the centre of the arena, the distance run and the number of rearings. These results indicate that KO mice have reduced anxiety.
Operant conditioning is an excellent learning test to determine associative learning capabilities of alert behaving mice, as well as other cognitive and motor abilities (Madronal et al, 2010). Collected results indicate that both WT and KO mice acquired a fixed-ratio (1:1) schedule (i.e. to press the lever one time to obtain a food pellet as reward) in the same number of sessions (WT, 5.2 ± 0.3 days; KO, 4.7 ± 0.2 days, p = 0.282, Student's t-test). From the 6th–10th sessions, both groups of animals obtained a similar number of pellets per session (WT, 23.2 ± 2.1; KO, 22.1 ± 2.6, p = 0.152, Student's t-test; not illustrated). In accordance, learning capabilities of KO mice were similar to that presented by their littermate controls.
Functional properties of hippocampal CA3-CA1 synapses in alert behaving WT and KO mice
Available in vivo recording techniques allow the study of hippocampal synapses in awake mice (Gruart et al, 2006; Madronal et al, 2009). Both WT and transgenic KO mice presented increases in the slope of fEPSP evoked at the CA1 area following the presentation of paired pulses (40 ms of inter-pulse interval) of increasing intensity at the ipsilateral Schaffer collaterals (Fig 8A). Nevertheless, KO mice presented significantly larger fEPSP amplitudes than WT animals at high stimulus intensities (>0.2 mA), suggesting an enhanced synaptic excitability.
Figure 8. Electrophysiological properties of hippocampal synapses in WT and KO alert behaving mice.
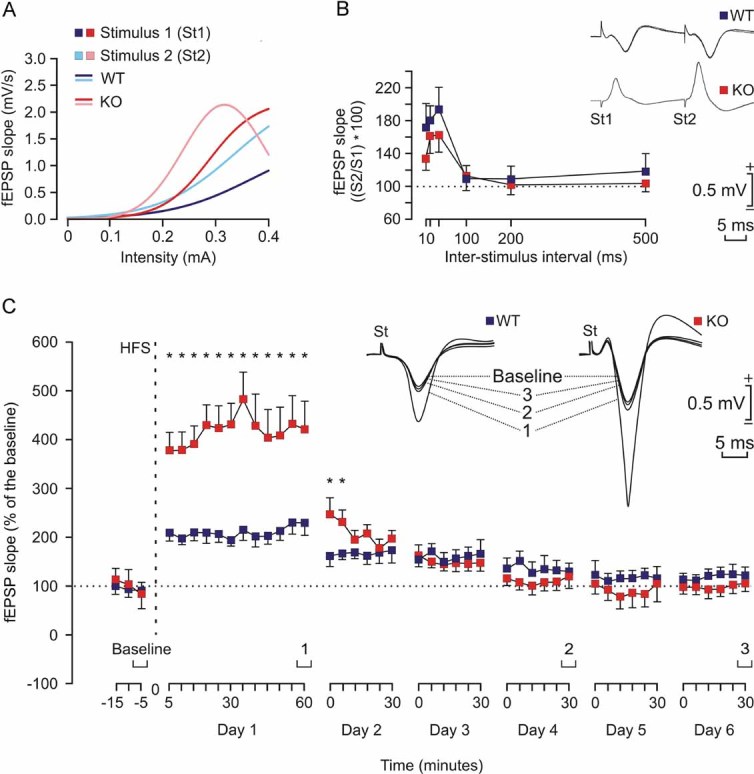
- Input/output curves of fEPSPs evoked at the CA1 area by paired (40 ms of interval) pulses presented to Schaffer collaterals at increasing intensities (in mA) in WT (1st pulse, dark blue; 2nd pulse, light blue) and KO (1st pulse, dark red; 2nd pulse, light red) mice (n = 4 animals/group). The best nonlinear adjustments (r ≥ 0.99; p ≤ 0.001) to the collected data are illustrated. KO mice presented significantly larger (p < 0.01) input/output curves than WT animals.
- There were no significant differences in paired-pulse facilitation between WT (blue) and KO (red) mice. The data shown are mean ± SEM slopes of the 2nd fEPSP expressed as a percentage of the 1st for six (10, 20, 40, 100, 200, 500) inter-pulse intervals. Some fEPSP paired traces (20 ms of inter-pulse interval) collected from representative WT and KO mice are illustrated.
- The two graphs illustrate the time course of LTP evoked in the CA1 area (fEPSP mean ± SEM) following high frequency stimulation HFS for WT (blue) and KO (red) mice. The HFS was presented after 15 min of baseline recordings, at the time marked by the dashed line. LTP evolution was followed for up to 6 days. The fEPSP is given as a percentage of the baseline (100%) slope. Although the two groups presented a significant increase (ANOVA, two-tailed) in fEPSP slope following HFS when compared with baseline records, values collected from the KO group were significantly (*p < 0.001) larger than those collected from WT mice at the indicated times.
We also looked for facilitation at the CA3-CA1 synapse. It is known that the synaptic facilitation evoked by the presentation of a pair of pulses is a typical presynaptic short-term plastic property of the hippocampal CA3-CA1 synapse, which has been related to the process of neurotransmitter release (Zucker & Regehr, 2002). But, as illustrated in Fig 8B, no significant differences between the two groups were observed at any of the selected intervals. In accordance, it can be suggested that short-term plastic processes are not affected in malin KO animals.
Comparison of long-term potentiation evoked in alert behaving WT and malin KO mice
For the long-term potentiation (LTP) study, and in order to obtain a baseline, WT and KO mice were stimulated every 20 s for ≥15 min at Schaffer collaterals (Fig 8C). When a stable baseline was obtained, mice were presented with the HFS protocol (see Materials and Methods section). After HFS, the same single stimulus used to generate the baseline records was presented at the initial rate (3/min) for another 60 min. Recording sessions were repeated up to 5 days later for 30 min each. Both groups presented a significant LTP, but with some differences between them. Indeed, the LTP response presented by KO mice was significantly larger than that presented by controls for more than 24 h. Thus, it can be proposed that KO mice present larger and longer-lasting LTPs than their respective littermate controls, a fact that could be ascribed to their enhanced synaptic excitability, but that is not translated into an increased ability for associative learning tasks.
Effects of kainic acid injection in malin KO mice
The C57BL6 strains are seizure-resistant in comparison to other mouse genetic backgrounds (McLin & Steward, 2006) and as indicated, malin KO were generated on a C57BL6 background. We investigated the susceptibility of both WT and KO mice to a single i.p. injection of kainic acid. As illustrated in Fig 9A, all injected KO mice presented spontaneous hippocampal seizures, accompanied on occasions (2 out of 6) by myoclonus. In contrast, no WT animal displayed clonic hippocampal seizures. Interestingly, the presence of seizures significantly reduced the amplitude and slope of fEPSPs evoked at the CA3-CA1 synapse (Fig 9B). Train stimulation of Schaffer collaterals evoked long-lasting after-discharges in KO, but not in WT, mice (Fig 9C). Finally, the presence of spontaneous clonic seizures and/or of experimentally evoked after-discharges reduced significantly the theta rhythm normally present in the hippocampus of awake mice (Fig 9D). In short, malin KO animals presented a propensity to generate hippocampal seizures not noticed in controls, following a single injection of kainic acid.
Figure 9. Effects of kainic acid injection in malin KO mice.
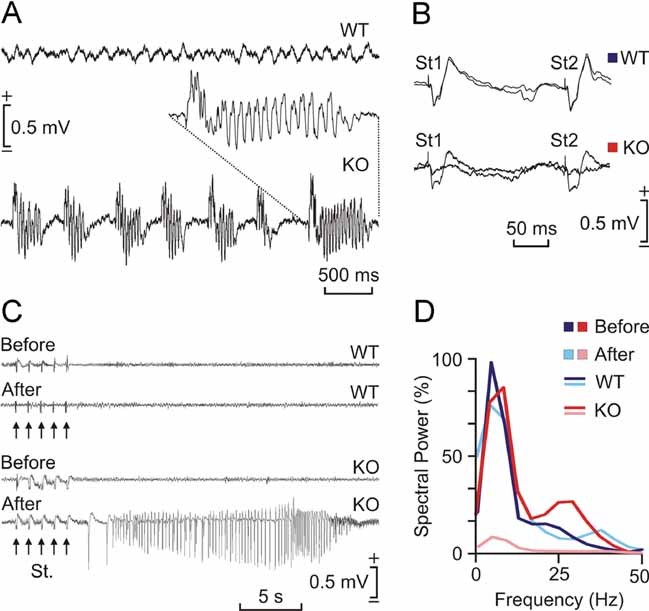
- Representative hippocampal EEG recordings carried out in a WT (top) and in a KO mice 30 min after kainic acid injection (8 mg/kg, i.p.). Note the presence of repetitive clonic seizures in the KO animal. The inset shows an enlargement of a typical seizure.
- Representative hippocamapal CA3-CA1 fEPSPs collected from a WT and a KO animal before and after kainic acid injection. Note that the presence of clonic seizures reduced significantly the amplitude of the evoked fEPSP in the KO mouse.
- Differential effects of train stimulation (St.: five 200 Hz, 100 ms trains of pulses at a rate of 1/s) of WT and KO mice before and after kainic acid injection. Note the long-lasting seizure evoked in the KO animal when stimulated following kainic acid injection.
- Spectral analysis of hippocampal EEG recordings collected from WT and KO mice before (WT, dark red; KO, dark blue) and after (WT, light red; KO, light blue) kainic injection. Note that the presence of repetitive seizures cancel out the normal theta (4–8 Hz) present in hippocampal EEG in behaving mice.
DISCUSSION
Here, we generated malin KO mice as an animal model of LD. We used this model to address fundamental questions regarding the role of malin in the control of glycogen metabolism and the impact of its demise at the histological, biochemical and behavioural level. In relation to recent publications on the same subject, we have extended the characterization of the model up to 11 months of age, a point at which the neurological consequences of the defect are already clearly visible. Our results point out the importance of the regulation of MGS by laforin and malin and highlight a key role of glycogen metabolism in the etiopathology of LD.
The KO animals showed LBs in several brain regions, these bodies being most conspicuous in the cerebellum and hippocampus. Glycogen content in the brains of these animals more than doubled that of the WT. This increase was accounted for solely by the polysaccharide present in the insoluble fraction. This observation thus supports the notion that the increase corresponds to the polyglucosan content of LBs. However, LBs contained not only polyglucosan but also MGS, the enzyme responsible for its synthesis. The accumulation of LBs occurs even with increased levels of soluble GP. These results can be understood as a response to polyglucosan accumulation and suggest that the aberrant glycogen synthesized in malin KO brains is resistant to GP degradation. In addition, in concordance with the apparent increase in the number of LBs, we also found increased levels of glycogenin in the insoluble fraction of KO brains, suggesting that this enzyme is also required for the initiation of polyglucosan synthesis.
It has been reported that phosphate is introduced into glycogen by catalytic error of GS and removed from it by the phosphatase activity of laforin. The hyperphosphorylation of glycogen would lead to a reduction of its solubility, this feature being the underlying determinant of LD according to recent publications (Tagliabracci et al, 2008, 2011; Turnbull et al, 2010). In the malin KO mice, although an increase of total laforin levels has been reported, a decrease in soluble laforin has been suggested to be responsible for the formation of LBs (DePaoli-Roach et al, 2010). Our data demonstrate that although laforin was augmented in the insoluble fraction, it remained unchanged in the soluble fraction. Therefore, a decrease in the amount of soluble laforin cannot be invoked as the cause of LB accumulation in our model.
In agreement with the impressive accumulation of MGS observed by immunostaining, Western blot analysis of malin KO brain extracts showed that total MGS was dramatically increased and accumulated in the insoluble fraction. We found that the enzyme in the LBs was less phosphorylated and therefore expected to be more active. However, we did not detect increased GS activity even in the presence of G6P. This imbalance between total protein amounts and activity has previously been reported for the other model of LD, the laforin KO (Tagliabracci et al, 2008). These results could be explained by GS being unable to exert its activity under the assay conditions because it is trapped in the LBs. Alternatively, GS accumulated in the LBs could be truly inactivated through structural changes, aggregation or unknown posttranslational modifications that prevented it from undergoing the allosteric activation induced by an excess of G6P. To the best of our knowledge, LD models are the only examples in which accumulations of this abnormal MGS have been described. So the mechanism by which the activity of this enzyme is impaired could be a unique characteristic of the disease and opens new questions on the regulation of glycogen metabolism.
The MGS accumulation observed in malin KO brains (11 months) is also comparable to that described for laforin KO brains at the same age (9–12 months) (Tagliabracci et al, 2008). Recent work (Turnbull et al, 2011) shows that PTG depletion prevents LB formation and the epileptic phenotype of laforin KO mice. Taken together, these observations reinforce the notion that the malin–laforin complex is involved in the degradation of PTG and MGS (Vilchez et al, 2007).
Although the presence of LBs in glial cells of patients was a matter of debate at the beginning of the 20th century (del Río-Hortega, 1925; Lafora, 1913), to the best of our knowledge, our study is the first to demonstrate astroglial LBs. This finding solves a long established paradox in LD. Research into this disease has been focused on neurons and the presence of LBs in these cells is considered the hallmark of LD. However, the presence of aberrant glycogen depositions in neurons but not in astrocytes is paradoxical as astrocytes, but not neurons, are considered to be the glycogenic cells in the brain. The immunohistological studies of the hippocampus, one of the most affected zones in the malin KO brains, showed that astrocytes and PV+ interneurons express MGS and malin and that both types of cells accumulate LBs when malin is knocked out. This finding supports the idea that LBs are formed as a result of the deregulation of glycogen machinery. Interestingly, polyglucosan accumulation appeared first in astrocytes. The chronology of the appearance of LBs correlates with the degenerative character of LD as the increase in polyglucosan deposits in PV+ somas coincided with loss of these interneurons. These observations are in agreement with previous results from our group suggesting that neurons are much more sensitive than astrocytes to cell death induced by glycogen overaccumulation (Vilchez et al, 2007).
Hippocampal PV+ cells are inhibitory interneurons. They contribute in the generation of synchronous population discharge patterns and their impairment is thought to be involved in epileptogenesis and seizure activity (Magloczky & Freund, 2005). In fact, a decrease in their number occurs in some cases of epilepsy (Castro et al, 2011; Dinocourt et al, 2003), Alzheimer's disease (Brady & Mufson, 1997; Takahashi et al, 2010), Creutzfeldt-Jakob disease (Guentchev et al, 1997), schizophrenia (Nullmeier et al, 2011; Zhang & Reynolds, 2002), and other disorders such as Ammon's horn sclerosis (Zhu et al, 1997) and dementia with Lewis bodies (Bernstein et al, 2011). Our results suggest that malin KO mice undergo late-onset degeneration of PV+ interneurons, which correlates with intracellular LB formation. Therefore, although the loss of PV immunoreactivity cannot be ruled out as it has been also described in some cases of epileptic hippocampus (Arellano et al, 2004; Sloviter, 1991; Wittner et al, 2005), the enhanced synaptic excitability and the propensity to myoclonic seizures that we observed in these animals could be attributed to the loss of hippocampal PV+ interneurons. The induction of glycogen accumulation in neuron primary cultures causes death by apoptosis (Vilchez et al, 2007). Thus, the loss of interneurons could be attributed to the accumulation of this polysaccharide. Given that we did not detect this neurodegeneration when LBs were extra-neuronal (4 months), we propose that the neuronal accumulation of MGS protein and its synthetic product polyglucosan is crucial for the progression of LD.
In spite of the severe neurodegeneration found in the malin KO mice, apoptotic neurons were not found in our preparations. The same observation has been made in the brain of laforin KO mice, other model of LD (Ganesh et al, 2002). The study of neurodegenerative diseases like Alzheimer's, Huntington's and Amyotrophic Lateral Sclerosis has shown that it is very difficult to detect apoptosis in vivo (Mattson, 2000). This is because apoptosis usually occurs quite rapidly (within hours), thus hindering the detection of cells showing classic features of this process in a neurodegenerative event that takes months.
Taken together, our results provide important insights into the molecular basis of LD. First, they confirm in vivo the role of malin in regulating MGS and glycogen accumulation. Second, they provide the first evidence of LB presence in astroglial cells. And finally, they link the expression of malin and MGS with a particular subset of neurons, the formation of LBs in these cells, their progressive loss, and the neurological decline associated with LD. We propose that the failure of MGS regulation is a key point for the progression of LD, thus making MGS a possible target for the treatment of this devastating disease.
MATERIALS AND METHODS
Chemicals and reagents
Amyloglucosidase, α-amylase (from human saliva) and 3,3′-diaminobenzidine tetrahydrochloride (DAB) were from Sigma–Aldrich. Antibodies against MGS (from Cell Signalling and Epitomics), pSer640-GS (from Cell Signaling), pSer7,10-GS (from Kinasource), glycogenin (from Abnova), actin (from Sigma), glial fibrillary acidic protein (GFAP, from Millipore and Dako), parvalbumin (from Swant), β-galactosidase (βgal, from Promega), polyglucosan (from Kamiya) and laforin (a gift from Dr. Santiago Rodríguez de Córdoba) were used in this study. Antibodies to GP isoforms were produced by Eurogentec. Guinea Pigs were immunized against a synthetic peptide corresponding to the C-terminus (amino acids 826-841) of muscle glycogen phosphorylase (MGP). Chickens were immunized against a synthetic peptide corresponding to the C-terminus (amino acids 826–842) of mouse brain glycogen phosphorylase (BGP) (Vilchez et al, 2007).
Generation of EPM2B KO mice
EPM2B-disrupted ES C57BL/6N (10571D-E2) cells were obtained from the Knockout Mouse Project Repository (KOMP), University of California, Davis, CA. In these cells, the complete EPM2B coding region plus 391 nucleotides of the 3′-untranslated region are replaced with a cassette containing the LacZ and NeoR genes. LacZ is fused in-frame at the EPM2B ATG (Supporting Information Fig 2A). After confirmation of targeting by PCR analyses (Supporting Information Fig 2B), the cells were injected into C57BL/6J blastocysts, and these were then implanted in the uterus of pseudo-pregnant C57BL/6J females for the generation of chimeric mice. One chimeric male positive for the disruption was mated with C57BL/6J females to test for germline transmission. Heterozygous F1 mice were intercrossed to generate the animals used in this study. WT, heterozygous and homozygous null mice were identified by PCR genotyping using oligonucleotide primer pairs for both the 5′-end and the 3′-end of the EPM2B-disrupted region (Supporting Information Fig 2B). Further confirmation of the disruption was obtained by RT-PCR of EPM2B mRNA (Supporting Information Fig 2C).
Animal studies
All procedures were approved by the Barcelona Science Park's Animal Experimentation Committee and were carried out in accordance with the European Community Council Directive and National Institutes of Health guidelines for the care and use of laboratory animals. Mice were allowed free access to a standard chow diet and water and maintained on a 12-h/12-h light/dark cycle under specific pathogen-free conditions in the Animal Research Center at the Barcelona Science Park. After weaning at 3 weeks of age, tail clippings were taken for genotyping by PCR.
Behavioural and electrophysiological tests
Methodological information regarding the open field test, the operant conditioning procedures, the input/output curves, the electroencephalographic (EEG) recordings and the kainate injection and recording of seizure activities can be found in Supporting Information Methods.
Sample preparation, homogenation and fractionation for biochemical analysis
The animals used for biochemical analysis were anesthetized and sacrificed by decapitation. Heads were directly froze on liquid nitrogen and stored at −80°C until use. Tissue samples were added to 10 volumes of ice-cold homogenization buffer containing 10 mM Tris-HCl (pH 7), 150 mM KF, 15 mM EDTA, 15 mM 2-mercaptoethanol, 0.6 M sucrose, 25 nM okadaic acid, 1 mM sodium orthovanadate, 10 µg/ml leupeptin, 10 µg/ml aprotinin, 10 µg/ml pepstatin, 1 mM benzamidine and 1 mM phenylmethanesulfonyl fluoride. They were then homogenized (Polytron) at 4°C. For sample fractionation, homogenates were centrifuged at 13000 × g for 15 min at 4°C. Sediments were resuspended with the same volume as supernatant of the corresponding buffer. Total homogenates, supernatants and sediments were recovered for GS activity, Western blotting and glycogen determination. Insoluble fractions were treated with amylase 110 U/ml for 3 h at 37°C to analyse glycogenin by Western blotting.
Glycogen synthase activity determination
Glycogen synthase activity was measured in total homogenates, supernatants and sediments in the presence of 4.4 mM UDP-glucose and absence or presence of 6.6 mM G6P, representing active or total activity, respectively, as previously described (Thomas et al, 1968).
Glycogen analysis
Total homogenates, supernatants and sediments were boiled in 30% KOH for 15 min and glycogen was determined by an amyloglucosidase-based assay as described in Chan and Exton (Chan & Exton, 1976). To assess glycogen branching, we used the method described by Krisman (Krisman, 1962).
Histology
Animals were anesthetized and perfused transcardiacally with phosphate buffered saline (PBS) containing 4% of paraformaldehyde. Brains were removed, postfixed with PBS-4% paraformaldehyde, cryoprotected with PBS-30% sucrose and frozen. To obtain tissue sections, brains were sectioned coronally at 30 µm, distributed in 10 series, and maintained at −20°C in PBS-30% glycerol-30% ethylene glycol for free-floating processing. In the case of animals used in electrophysiological experiments, selected sections including the dorsal hippocampus were mounted on gelatinized glass slides and stained using the Nissl technique with 0.1% toluidine blue, to determine the location of stimulating and recording electrodes.
The paper explained
PROBLEM
Lafora disease (LD) is a fatal progressive epilepsy caused by mutations in either EPM2A, which encodes laforin, or EMP2B, which encodes malin. At the beginning of the 20th century, more than 80 years before the discovery of the genes causing this disease, the presence of abnormal glycogen inclusions (later referred to as LBs) in neurons of the patients was described as the hallmark of the disease. However, the mechanism behind the formation of abnormal glycogen in LD is still a matter of debate, as is the link between LB formation and neurodegeneration. We approached these questions by studying malin-deficient mice.
RESULTS
Our work is centred on the hippocampus, one of the most affected areas of the brain in LD. Here, we describe the expression of GS—the only enzyme able to produce glycogen in mammals—and malin in astrocytes and interneurons, and we analyse the progressive appearance of LBs in these cells in the malin-deficient mouse. We found a dramatic increase in GS in the brain of this animal model. The enzyme accumulated on LBs in an insoluble non-active form. Here, we have found a link between the late formation of LBs in a particular subset of interneurons, their degeneration and the characteristic neuropathology associated with LD. Furthermore, this is the first study to report the presence of LBs in astrocytes.
IMPACT
Our findings provide new insights into the etiology of LD. Although glycogen is stored normally in astrocytes, evidence of LBs in these cells has never been reported. The detection of LBs in glial cells widens our vision by showing that the formation of aberrant glycogen is not limited to neurons. We highlight the high susceptibility of neurons, a cell type that does not normally store glycogen, to cell death induced by the accumulation of this polysaccharide and conclude that the malin/laforin complex is crucial for GS regulation and glycogen accumulation. We propose that GS is a potential target for the treatment of LD.
Electron microscopy
Animals were perfused with 2% glutaraldehyde-2% paraformaldehyde in 0.12 M phosphate buffer. After post-fixation in the same solution overnight, tissue slices were transferred to 2% osmium tetroxide, stained with 2% uranyl acetate, dehydrated and finally embedded in Araldite. Ultrathin sections from medial hippocampal samples were collected on formvar-coated slot grids and stained with lead citrate. Electron micrographs were taken using a Tecnai Spirit transmission electron microscope.
Immunocytochemistry
For immunodetection of antigens, sections were washed in PBS and PBS-0.1% Triton X-100, blocked for 2 h at RT with PBS containing 10% of normal goat serum (NGS), 0.2% of gelatin, and F(ab′)2 fragment anti-mouse IgG when required. Primary antibodies were incubated overnight at 4°C with PBS–5% NGS. For immunohistofluorescence, dye-labelled secondary antibodies and Hoechst 33342 were incubated for 2 h at RT in PBS-5% NGS, mounted in Mowiol and stored at −20°C. Confocal images were taken with a Leica SP5 microscope. For immunohistochemistry, sequential incubation with biotinylated secondary antibodies and streptavidin-HRP was performed in PBS-5% NGS. Bound antibodies were visualized by reaction using 0.03% diaminobenzidine and 0.002% H2O2, and sections were dehydrated and mounted (Eukitt). For PAS staining, selected brain sections were oxidized with 5% periodic acid for 10 min, stained with Schiff reagent for 30 min, dehydrated and mounted (Eukitt).
Cell counting
For quantification in the hippocampus, the number of parvalbumin-positive (PV+) cells was counted every 10th section for each animal; data were normalized to the area counted in 30-µm-thick sections (n = 8–10 sections per animal, 3 animals per group). Areas measured for quantification were determined using ImageJ software.
Statistical analysis
Data are expressed as mean ± SEM. Statistical significance was determined by unpaired Student's t-test using GraphPad Prism software (version 5; GraphPad Software, Inc.). Statistical significance was assumed at p ≤ 0.05.
Acknowledgments
The authors thank Anna Adrover, Emma Veza, Montserrat Climent and Natàlia Plana (IRB Barcelona), Marisa Larramona (Barcelona Science Park) and María Sánchez-Enciso (Pablo de Olavide University) for their technical assistance. Thanks also go to Stephen Forrow (IRB Barcelona Mouse Mutant Core Facility) and Julian Colombelli, Lídia Bardia and Anna Lladó (IRB Barcelona Advanced Digital Microscopy Core Facility) and Carmen López (University of Barcelona Electron Microscopy Unit) for advice, Joaquim Calbó and Florencia Tevy for critical review and to Tanya Yates for correcting the English version of the manuscript. This work was supported by the Ministerio de Ciencia y Innovación, Spain [grant numbers BFU2008-00769, BFU2008-03390/BMC, and BFU2008-00899], the Instituto de Salud Carlos III [PhD fellowship number FI06/00375] to [JV], the Torres Quevedo programme [PTQ-08-03-07880] to [AS] and a grant from the Fundación Marcelino Botín and the CIBER de Diabetes y Enfermedades Metabólicas Asociadas (ISCIII, Ministerio de Ciencia e Innovación).
Supporting information is available at EMBO Molecular Medicine online.
The authors declare that they have no conflict of interest.
Author contributions
JVO participated in the design and coordination of the study, carried out the histological analyses of brains, the quantification of PV+ interneurons, and the glycogen branching assay and drafted the manuscript; JD conceived the study, participated in its design and coordination, generated, bred and genotyped the mice, carried out the histological analyses of muscle and heart, performed the behavioural studies and helped to draft the manuscript; MGR carried out the biochemical studies; CB performed the electron microscopy study; JMDG and AG performed the operant conditioning test and the electrophysiological studies; IS helped to analyse the mice; LP helped to study the brain MGS expression; AS helped to perform the histological analyses; XC and ES participated in the coordination of the study; JJG directed the study. All the authors read and approved the final manuscript.
For more information
OMIM Lafora Disease:
http://www.ncbi.nlm.nih.gov/omim/254780
Genes:
Malin: http://www.ncbi.nlm.nih.gov/gene/378884
Supplementary material
Detailed facts of importance to specialist readers are published as ”Supporting Information”. Such documents are peer-reviewed, but not copy-edited or typeset. They are made available as submitted by the authors.
References
- Arellano JI, Munoz A, Ballesteros-Yanez I, Sola RG, DeFelipe J. Histopathology and reorganization of chandelier cells in the human epileptic sclerotic hippocampus. Brain. 2004;127:45–64. doi: 10.1093/brain/awh004. [DOI] [PubMed] [Google Scholar]
- Bernstein HG, Johnson M, Perry RH, LeBeau FE, Dobrowolny H, Bogerts B, Perry EK. Partial loss of parvalbumin-containing hippocampal interneurons in dementia with Lewy bodies. Neuropathology. 2011;31:1–10. doi: 10.1111/j.1440-1789.2010.01117.x. [DOI] [PubMed] [Google Scholar]
- Bouskila M, Hunter RW, Ibrahim AF, Delattre L, Peggie M, van Diepen JA, Voshol PJ, Jensen J, Sakamoto K. Allosteric regulation of glycogen synthase controls glycogen synthesis in muscle. Cell Metab. 2010;12:456–466. doi: 10.1016/j.cmet.2010.10.006. [DOI] [PubMed] [Google Scholar]
- Brady DR, Mufson EJ. Parvalbumin-immunoreactive neurons in the hippocampal formation of Alzheimer's diseased brain. Neuroscience. 1997;80:1113–1125. doi: 10.1016/s0306-4522(97)00068-7. [DOI] [PubMed] [Google Scholar]
- Castro OW, Furtado MA, Tilelli CQ, Fernandes A, Pajolla GP, Garcia-Cairasco N. Comparative neuroanatomical and temporal characterization of FluoroJade-positive neurodegeneration after status epilepticus induced by systemic and intrahippocampal pilocarpine in Wistar rats. Brain Res. 2011;1374:43–55. doi: 10.1016/j.brainres.2010.12.012. [DOI] [PubMed] [Google Scholar]
- Cataldo AM, Broadwell RD. Cytochemical identification of cerebral glycogen and glucose-6-phosphatase activity under normal and experimental conditions. II. Choroid plexus and ependymal epithelia, endothelia and pericytes. J Neurocytol. 1986;15:511–524. doi: 10.1007/BF01611733. [DOI] [PubMed] [Google Scholar]
- Cavanagh JB. Corpora-amylacea and the family of polyglucosan diseases. Brain Res Brain Res Rev. 1999;29:265–295. doi: 10.1016/s0165-0173(99)00003-x. [DOI] [PubMed] [Google Scholar]
- Chan TM, Exton JH. A rapid method for the determination of glycogen content and radioactivity in small quantities of tissue or isolated hepatocytes. Anal Biochem. 1976;71:96–105. doi: 10.1016/0003-2697(76)90014-2. [DOI] [PubMed] [Google Scholar]
- Chan EM, Andrade DM, Franceschetti S, Minassian B. Progressive myoclonus epilepsies: EPM1, EPM2A, EPM2B. Adv Neurol. 2005;95:47–57. [PubMed] [Google Scholar]
- del Río-Hortega P. Papel de la microglía en la formación de los cuerpos amiláceos del tejido nervioso. Boletín Sociedad Española Historia Natural. 1925;25:127–141. [Google Scholar]
- Delgado-Escueta AV. Advances in lafora progressive myoclonus epilepsy. Curr Neurol Neurosci Rep. 2007;7:428–433. doi: 10.1007/s11910-007-0066-7. [DOI] [PubMed] [Google Scholar]
- DePaoli-Roach AA, Tagliabracci VS, Segvich DM, Meyer CM, Irimia JM, Roach PJ. Genetic depletion of the malin E3 ubiquitin ligase in mice leads to lafora bodies and the accumulation of insoluble laforin. J Biol Chem. 2010;285:25372–25381. doi: 10.1074/jbc.M110.148668. [DOI] [PMC free article] [PubMed] [Google Scholar]
- Dinocourt C, Petanjek Z, Freund TF, Ben-Ari Y, Esclapez M. Loss of interneurons innervating pyramidal cell dendrites and axon initial segments in the CA1 region of the hippocampus following pilocarpine-induced seizures. J Comp Neurol. 2003;459:407–425. doi: 10.1002/cne.10622. [DOI] [PubMed] [Google Scholar]
- Ganesh S, Delgado-Escueta AV, Sakamoto T, Avila MR, Machado-Salas J, Hoshii Y, Akagi T, Gomi H, Suzuki T, Amano K, et al. Targeted disruption of the Epm2a gene causes formation of Lafora inclusion bodies, neurodegeneration, ataxia, myoclonus epilepsy and impaired behavioral response in mice. Hum Mol Genet. 2002;11:1251–1262. doi: 10.1093/hmg/11.11.1251. [DOI] [PubMed] [Google Scholar]
- Ganesh S, Puri R, Singh S, Mittal S, Dubey D. Recent advances in the molecular basis of Lafora's progressive myoclonus epilepsy. J Hum Genet. 2006;51:1–8. doi: 10.1007/s10038-005-0321-1. [DOI] [PubMed] [Google Scholar]
- Gentry MS, Worby CA, Dixon JE. Insights into Lafora disease: malin is an E3 ubiquitin ligase that ubiquitinates and promotes the degradation of laforin. Proc Natl Acad Sci USA. 2005;102:8501–8506. doi: 10.1073/pnas.0503285102. [DOI] [PMC free article] [PubMed] [Google Scholar]
- Goldberg ND, O'Toole AG. The properties of glycogen synthetase and regulation of glycogen biosynthesis in rat brain. J Biol Chem. 1969;244:3053–3061. [PubMed] [Google Scholar]
- Gruart A, Munoz MD, Delgado-Garcia JM. Involvement of the CA3-CA1 synapse in the acquisition of associative learning in behaving mice. J Neurosci. 2006;26:1077–1087. doi: 10.1523/JNEUROSCI.2834-05.2006. [DOI] [PMC free article] [PubMed] [Google Scholar]
- Guentchev M, Hainfellner JA, Trabattoni GR, Budka H. Distribution of parvalbumin-immunoreactive neurons in brain correlates with hippocampal and temporal cortical pathology in Creutzfeldt-Jakob disease. J Neuropathol Exp Neurol. 1997;56:1119–1124. doi: 10.1097/00005072-199710000-00005. [DOI] [PubMed] [Google Scholar]
- Krisman CR. A method for the colorimetric estimation of glycogen with iodine. Anal Biochem. 1962;4:17–23. doi: 10.1016/0003-2697(62)90014-3. [DOI] [PubMed] [Google Scholar]
- Lafora GR. Nuevas investigaciones sobre los cuerpos amiláceos del interior de las células nerviosas. Trab Lab Investi Biológ Univ Madrid. 1913;11:29–42. [Google Scholar]
- Lohi H, Ianzano L, Zhao XC, Chan EM, Turnbull J, Scherer SW, Ackerley CA, Minassian BA. Novel glycogen synthase kinase 3 and ubiquitination pathways in progressive myoclonus epilepsy. Hum Mol Genet. 2005;14:2727–2736. doi: 10.1093/hmg/ddi306. [DOI] [PubMed] [Google Scholar]
- Madronal N, Gruart A, Delgado-Garcia JM. Differing presynaptic contributions to LTP and associative learning in behaving mice. Front Behav Neurosci. 2009;3:7. doi: 10.3389/neuro.08.007.2009. [DOI] [PMC free article] [PubMed] [Google Scholar]
- Madronal N, Lopez-Aracil C, Rangel A, del Rio JA, Delgado-Garcia JM, Gruart A. Effects of enriched physical and social environments on motor performance, associative learning, and hippocampal neurogenesis in mice. PLoS One. 2010;5:e11130. doi: 10.1371/journal.pone.0011130. [DOI] [PMC free article] [PubMed] [Google Scholar]
- Magloczky Z, Freund TF. Impaired and repaired inhibitory circuits in the epileptic human hippocampus. Trends Neurosci. 2005;28:334–340. doi: 10.1016/j.tins.2005.04.002. [DOI] [PubMed] [Google Scholar]
- Mattson MP. Apoptosis in neurodegenerative disorders. Nat Rev Mol Cell Biol. 2000;1:120–129. doi: 10.1038/35040009. [DOI] [PubMed] [Google Scholar]
- McLin JP, Steward O. Comparison of seizure phenotype and neurodegeneration induced by systemic kainic acid in inbred, outbred, and hybrid mouse strains. Eur J Neurosci. 2006;24:2191–2202. doi: 10.1111/j.1460-9568.2006.05111.x. [DOI] [PubMed] [Google Scholar]
- Nullmeier S, Panther P, Dobrowolny H, Frotscher M, Zhao S, Schwegler H, Wolf R. Region-specific alteration of GABAergic markers in the brain of heterozygous reeler mice. Eur J Neurosci. 2011;33:689–698. doi: 10.1111/j.1460-9568.2010.07563.x. [DOI] [PubMed] [Google Scholar]
- Pfeiffer-Guglielmi B, Fleckenstein B, Jung G, Hamprecht B. Immunocytochemical localization of glycogen phosphorylase isozymes in rat nervous tissues by using isozyme-specific antibodies. J Neurochem. 2003;85:73–81. doi: 10.1046/j.1471-4159.2003.01644.x. [DOI] [PubMed] [Google Scholar]
- Skurat AV, Wang Y, Roach PJ. Rabbit skeletal muscle glycogen synthase expressed in COS cells. Identification of regulatory phosphorylation sites. J Biol Chem. 1994;269:25534–25542. [PubMed] [Google Scholar]
- Sloviter RS. Permanently altered hippocampal structure, excitability, and inhibition after experimental status epilepticus in the rat: the “dormant basket cell” hypothesis and its possible relevance to temporal lobe epilepsy. Hippocampus. 1991;1:41–66. doi: 10.1002/hipo.450010106. [DOI] [PubMed] [Google Scholar]
- Tagliabracci VS, Turnbull J, Wang W, Girard JM, Zhao X, Skurat AV, Delgado-Escueta AV, Minassian BA, Depaoli-Roach AA, Roach PJ. Laforin is a glycogen phosphatase, deficiency of which leads to elevated phosphorylation of glycogen in vivo. Proc Natl Acad Sci USA. 2007;104:19262–19266. doi: 10.1073/pnas.0707952104. [DOI] [PMC free article] [PubMed] [Google Scholar]
- Tagliabracci VS, Girard JM, Segvich D, Meyer C, Turnbull J, Zhao X, Minassian BA, Depaoli-Roach AA, Roach PJ. Abnormal metabolism of glycogen phosphate as a cause for Lafora disease. J Biol Chem. 2008;283:33816–33825. doi: 10.1074/jbc.M807428200. [DOI] [PMC free article] [PubMed] [Google Scholar]
- Tagliabracci VS, Heiss C, Karthik C, Contreras CJ, Glushka J, Ishihara M, Azadi P, Hurley TD, Depaoli-Roach AA, Roach PJ. Phosphate incorporation during glycogen synthesis and Lafora disease. Cell Metab. 2011;13:274–282. doi: 10.1016/j.cmet.2011.01.017. [DOI] [PMC free article] [PubMed] [Google Scholar]
- Takahashi H, Brasnjevic I, Rutten BP, Van Der Kolk N, Perl DP, Bouras C, Steinbusch HW, Schmitz C, Hof PR, Dickstein DL. Hippocampal interneuron loss in an APP/PS1 double mutant mouse and in Alzheimer's disease. Brain Struct Funct. 2010;214:145–160. doi: 10.1007/s00429-010-0242-4. [DOI] [PMC free article] [PubMed] [Google Scholar]
- Thomas JA, Schlender KK, Larner J. A rapid filter paper assay for UDPglucose-glycogen glucosyltransferase, including an improved biosynthesis of UDP-14C-glucose. Anal Biochem. 1968;25:486–499. doi: 10.1016/0003-2697(68)90127-9. [DOI] [PubMed] [Google Scholar]
- Turnbull J, Wang P, Girard JM, Ruggieri A, Wang TJ, Draginov AG, Kameka AP, Pencea N, Zhao X, Ackerley CA, et al. Glycogen hyperphosphorylation underlies lafora body formation. Ann Neurol. 2010;68:925–933. doi: 10.1002/ana.22156. [DOI] [PubMed] [Google Scholar]
- Turnbull J, Depaoli-Roach AA, Zhao X, Cortez MA, Pencea N, Tiberia E, Piliguian M, Roach PJ, Wang P, Ackerley CA, et al. PTG depletion removes Lafora bodies and rescues the fatal epilepsy of Lafora disease. PLoS Genet. 2011;7:e1002037. doi: 10.1371/journal.pgen.1002037. [DOI] [PMC free article] [PubMed] [Google Scholar]
- Vilchez D, Ros S, Cifuentes D, Pujadas L, Valles J, Garcia-Fojeda B, Criado-Garcia O, Fernandez-Sanchez E, Medrano-Fernandez I, Dominguez J, et al. Mechanism suppressing glycogen synthesis in neurons and its demise in progressive myoclonus epilepsy. Nat Neurosci. 2007;10:1407–1413. doi: 10.1038/nn1998. [DOI] [PubMed] [Google Scholar]
- Villar-Palasi C, Guinovart JJ. The role of glucose 6-phosphate in the control of glycogen synthase. FASEB J. 1997;11:544–558. [PubMed] [Google Scholar]
- Wender R, Brown AM, Fern R, Swanson RA, Farrell K, Ransom BR. Astrocytic glycogen influences axon function and survival during glucose deprivation in central white matter. J Neurosci. 2000;20:6804–6810. doi: 10.1523/JNEUROSCI.20-18-06804.2000. [DOI] [PMC free article] [PubMed] [Google Scholar]
- Wittner L, Eross L, Czirjak S, Halasz P, Freund TF, Magloczky Z. Surviving CA1 pyramidal cells receive intact perisomatic inhibitory input in the human epileptic hippocampus. Brain. 2005;128:138–152. doi: 10.1093/brain/awh339. [DOI] [PubMed] [Google Scholar]
- Zhang ZJ, Reynolds GP. A selective decrease in the relative density of parvalbumin-immunoreactive neurons in the hippocampus in schizophrenia. Schizophr Res. 2002;55:1–10. doi: 10.1016/s0920-9964(01)00188-8. [DOI] [PubMed] [Google Scholar]
- Zhu ZQ, Armstrong DL, Hamilton WJ, Grossman RG. Disproportionate loss of CA4 parvalbumin-immunoreactive interneurons in patients with Ammon's horn sclerosis. J Neuropathol Exp Neurol. 1997;56:988–998. doi: 10.1097/00005072-199709000-00004. [DOI] [PubMed] [Google Scholar]
- Zucker RS, Regehr WG. Short-term synaptic plasticity. Annu Rev Physiol. 2002;64:355–405. doi: 10.1146/annurev.physiol.64.092501.114547. [DOI] [PubMed] [Google Scholar]
Associated Data
This section collects any data citations, data availability statements, or supplementary materials included in this article.