

Abstract
Objectives
Clinical decision support (CDS), such as computerized alerts, improves prescribing in the setting of acute kidney injury (AKI), but considerable opportunity remains to improve patient safety. The authors sought to determine whether pharmacy surveillance of AKI patients could detect and prevent medication errors that are not corrected by automated interventions.
Methods
The authors conducted a randomized clinical trial among 396 patients admitted to an academic, tertiary care hospital between June 1, 2010 and August 31, 2010 with an acute 0.5 mg/dl change in serum creatinine over 48 hours and a nephrotoxic or renally cleared medication order. Patients randomly assigned to the intervention group received surveillance from a clinical pharmacist using a web-based surveillance tool to monitor drug prescribing and kidney function trends. CDS alerting and standard pharmacy services were active in both study arms. Outcome measures included blinded adjudication of potential adverse drug events (pADEs), adverse drug events (ADEs) and time to provider modification or discontinuation of targeted nephrotoxic or renally cleared medications.
Results
Potential ADEs or ADEs occurred for 104 (8.0%) of control and 99 (7.1%) of intervention patient-medication pairs (p=0.4). Additionally, the time to provider modification or discontinuation of targeted nephrotoxic or renally cleared medications did not differ between control and intervention patients (33.4 hrs vs. 30.3hrs, p=0.3).
Conclusions
Pharmacy surveillance had no incremental benefit over previously implemented CDS alerts
Keywords: Clinical decision support systems, electronic health records, randomized controlled trial, medication errors, medication error prevention and control, adverse drug reaction reporting systems
1. Background
Clinical decision support (CDS) within electronic medical records (EMRs) and computerized provider order entry (CPOE) systems has a high potential for reducing medication errors [1–4]. Despite some success, substantial numbers of residual adverse drug events (ADEs) and potential adverse drug events (pADEs) remain, suggesting that further improvements of patient safety will require additional types of well-integrated interventions. Furthermore, recent evaluations of CDS point out the risks of the technology, including provider fatigue and dissatisfaction, and unintended adverse consequences [5–9].
Clinical pharmacy services have traditionally addressed medication safety for hospitalized patients by reviewing medication orders prior to dispensing or rounding with inpatient teams, and the support of a clinical pharmacist has been shown to improve prescribing in multiple settings [10–17]. Pharmacy surveillance has also been shown to detect and potentially prevent ADEs [18–21]. However, the incremental benefit of pharmacy surveillance when added to CDS in reducing ADEs is unknown.
We developed a real-time surveillance tool for medication errors in order to integrate CDS with clinical pharmacy surveillance. The tool recognized high-risk prescribing in patients with acute kidney injury (AKI) and directed a clinical pharmacist to intervene on the highest risk patients, including those where providers were not responding to alerts from an existing CDS system [22]. AKI affects patients and medication regimens across all hospitalized units and prescribing is not well standardized, though CDS has been shown to benefit patients with impaired or rapidly changing renal function [21–26]. We hypothesized that real-time surveillance by a clinical pharmacist using the web-based tool would improve the management of renally-dosed medications. To test this, we conducted a prospective, randomized, controlled study, comparing the effect of enhanced clinical pharmacist surveillance of patients in the intervention group with existing CDS and standard pharmacy services on the occurrence, preventability, and severity of ADEs.
2. Methods
2.1. Study Design and Participants
We performed a parallel group randomized, controlled trial during June 1, 2010 through August 31, 2010 at Vanderbilt University Hospital, a large academic, tertiary care facility with universal utilization of CPOE and extensive integrated CDS [1, 25, 27–30]. The study included all admitted adult patients who experienced a 0.5 mg/dl increase or decrease in serum creatinine over 48 hours of hospitalization following an active, recurring order for one or more targeted nephrotoxic or renally cleared medications (►Table 1); these criteria were selected by a local expert nephrology panel to identify significant renal function changes which should trigger reassessment of drug therapy. It included all patients who were eligible to receive a previously implemented CDS alert for AKI [22].
Table 1.
Targeted nephrotoxic or renally cleared medications for surveillance
| Medications to Avoid | Medications to Adjust | Medications to Review | ||
|---|---|---|---|---|
| ACARBOSE* | METFORMIN* | ACYCLOVIR (>400 mg | ADEFOVIR* | MORPHINE* |
| ACETAZOLAMIDE* | METHOTREXATE* | Q12H) | ALENDRONATE+ | NEOSTIGMINE* |
| ACETOHEXAMIDE* | MOEXIPRIL* | ALLOPURINOL (>100 | AMOXICILLIN+ | NORFLOXACIN |
| AMIKACIN | NABUMETONE* | mg Q24H) | AMOXICILLIN- | OFLOXACIN |
| AMPHOTERICIN B* | NAPROXEN* | AMANTADINE | CLAVULANATE | PAMIDRONATE+ |
| BENAZEPRIL* | NITROFURANTOIN* | AZTREONAM | AMPICILLIN | PENICILLIN-G |
| CANDESARTAN* | NITROPRUSSIDE* | BACTRIM (>1 DS tablet | AZITHROMYCIN+ | PIPERACILLIN |
| CAPREOMYCIN* | OLMESARTAN* | BID) | BRETYLIUM | PYRAZINAMIDE |
| CAPTOPRIL* | PANCURONIUM* | CARBOPLATIN* | BUMETANIDE+ | QUINIDINE |
| CELECOXIB* | PERINDOPRIL* | CISPLATIN* | CEFACLOR+ | RIFAMPIN+ |
| CHLORPROPAMIDE* | PIROXICAM* | COLCHICINE (>0.6 mg | CEFAZOLIN | RISEDRONATE+ |
| CIDOFOVIR* | QUINAPRIL* | Q24H) | CEFEPIME | TEMOZOLOMIDE* |
| CYCLOPHOSPHA- | RAMIPRIL* | CYCLOSERINE | CEFOTAXIME | TENOFOVIR* |
| MIDE* | ROFECOXIB* | DAPTOMYCIN | CEFOTETAN | TICARCILLIN |
| CYCLOSPORINE*§ | SITAGLIPTIN+ | DIDANOSINE | CEFOXITIN | TOCAINIDE |
| CYTARABINE* | STREPTOMYCIN* | DIGITOXIN | CEFTAZIDIME | TORSEMIDE+ |
| DICLOFENAC SO- | SULINDAC* | DIGOXIN | CEFUROXIME | ZIDOVUDINE |
| DIUM* | TACROLIMUS*§ | DOFETILIDE | CEFUROXIME+ | ZOLEDRONIC ACID+ |
| DIFLUNISAL* | TELMISARTAN* | DORIPENEM | CEPHALEXIN+ | |
| ENALAPRIL* | TETRACYCLINE* | EPTIFIBATIDE | CHLOROQUINE | |
| ENALAPRILAT* | TOBRAMYCIN | ERTAPENEM | CIPROFLOXACIN | |
| ENOXAPARIN* (>30 | TOLMETIN* | ETOPOSIDE* | CLARITHROMY- | |
| mg Q24H) | TRANDOLAPRIL* | FAMCICLOVIR | CIN+ | |
| ETODOLAC* | TRIMETREXATE* | FLUCYTOSINE | CLOFIBRATE | |
| EXENATIDE* | VALDECOXIB* | FOSCARNET | Contrast Dye+ | |
| FENOPROFEN* | VALSARTAN* | GANCICLOVIR | DISOPYRAMIDE | |
| FLURBIPROFEN* | GANCICLOVIR | DOXACURIUM INJ | ||
| FONDAPARINUX | IMIPENEM-CILASTATIN | ETHACRYNATE+ | ||
| FOSINOPRIL* | ITRACONAZOLE | ETHAMBUTOL | ||
| GALLAMINE* | LACOSAMIDE* | FLECAINIDE | ||
| GENTAMICIN INJ | MEROPENEM | FLUCONAZOLE | ||
| GLYBURIDE* | METOCLOPRAMIDE* | (>100 mg Q24H) | ||
| IBUPROFEN* | MITOMYCIN* | FUROSEMIDE+ | ||
| IFOSFAMIDE* | PENICILLIN-VK | GEMFIBROZIL+ | ||
| IMMUNE GLOBULIN* | PENTOSTATIN* | HYDROMOR- | ||
| INDOMETHACIN* | PRAMIPEXOLE* | PHONE+ | ||
| IRBESARTAN* | PREGABALIN* | HYDROXYUREA* | ||
| KETOPROFEN* | PROCAINAMIDE | IBANDRONATE+ | ||
| KETOROLAC* | PYRIDOSTIGMINE | IDARUBICIN* | ||
| LISINOPRIL* | SOTALOL* | INDINAVIR | ||
| LITHIUM | STAVUDINE | LAMIVUDINE | ||
| LOSARTAN* | TOPOTECAN* | LEVOFLOXACIN | ||
| MELOXICAM* | VALACYCLOVIR | MELPHALAN* | ||
| MEPERIDINE* | VALGANCICLOVIR (>450 mg Q24H) VANCOMYCIN VORICONAZOLE | METOCURINE MIVACURIUM | ||
* Medication only targeted for increasing serum creatinine intervention.
+ Medication was not targeted for intervention, displayed only on surveillance tool for context.
§ Medication was not targeted for patients admitted to a renal or transplant services.
Prior to randomization, we excluded patients with end-stage renal disease who received dialysis prior to the first serum creatinine change event or were previously identified as a chronic dialysis patient in the inpatient order entry records. In addition, we excluded patients cared for on services with existing specialty pharmacy support including nephrology services and renal, liver, and bone marrow transplant services. Finally, prior to analysis, a blinded outcomes assessment pharmacist evaluated cases for additional exclusion criteria that could not be determined electronically at the time of randomization, including chronic dialysis patients, transplant patients, palliative care patients, false lab measurements, and no medication administrations. This study was approved by the Vanderbilt Institutional Review Board.
2.2. Surveillance Tool Intervention
The surveillance tool is a dynamic web application, populated by real-time clinical databases and CDS log files, designed to complement traditional CDS and clinical pharmacy services by facilitating monitoring and intervention for high risk patients. The tool consists of two primary view types: the surveillance view and the patient detail view. The surveillance view displays patient details such as demographics, providing service, and hospital location, in addition to most recent creatinine values and alerts about declining or improving renal function, for all currently admitted, eligible patients, allowing pharmacists to identify patients at high risk for harm (►Figure 1). The patient detail view (►Figure 2) displays a graph of events of interest and a detailed, sortable timeline of orders, order administrations, laboratory values, and CDS logs during the patient’s admission for an individual patient, presented in reverse chronological order to give context for the CDS logs. This view also allows staff to enter notes directly into the EMR and to save comments for reference to other surveillance users.
Fig. 1.
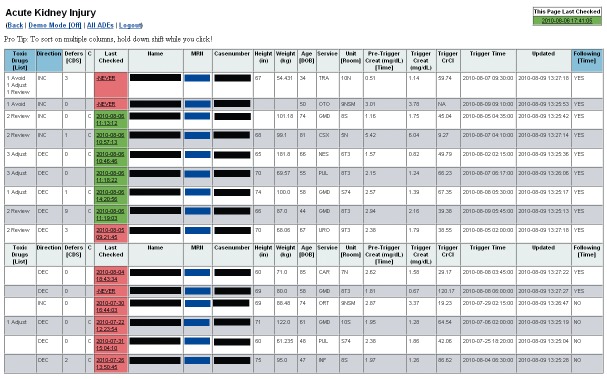
Surveillance view of real-time tool for monitoring acute kidney injury patients and clinical decision support interactions.
Fig. 2.

Patient detail view of real-time tool for monitoring acute kidney injury patients and clinical decision support interactions.
Prior to formally evaluating the surveillance tool for AKI, we performed a four month pilot implementation. Study personnel independently reviewed select cases, discussed the potential for intervention based on patient and drug factors, and assessed the usefulness of the surveillance tool. Based on the feedback, we made iterative changes to the targeted medication list and the inclusion criteria for both the surveillance tool and AKI CDS.
During the trial, the clinical pharmacist for internal medicine (EN) served as the study pharmacist for the intervention, reviewing the surveillance tool to evaluate patients during each workday. For patients determined to be experiencing AKI and needing an intervention, the study pharmacist contacted the primary provider using a text page, verbal communication, or an EMR note to recommend changes in care. All interactions, including patient’s classification of AKI, communication with provider, recommendations provided, and actions taken, were recorded with a timestamp in a structured form within the surveillance tool for later analysis.
Both control and intervention patients received standard CDS and clinical pharmacy services for all hospitalized patients. Active CDS included guided dosing advisors and CPOE alerts for AKI, which have been described previously [22, 27]. A clinical pharmacist rounded on some medical and surgical teams, including the majority of the ICU services, and intermittently on non-ICU services to answer provider questions, independently review medication regimens, and offer verbal recommendations directly to providers during order entry. Clinical pharmacists at the study institution did not typically interact with CPOE based CDS as part of their usual workflow; in rare circumstances, a rounding pharmacist might encounter the AKI CDS when entering medication orders on behalf of providers. Staff pharmacists also reviewed medication orders prior to dispensing during the trial, but these pharmacists did not also monitor laboratory results or changes in serum creatinine.
2.3. Randomization
Patients were automatically assigned to a study group using a pseudo-random number function within the surveillance tool at the time that he or she first met eligibility criteria and remained in the assigned group until discharge.
2.4. Outcomes
Our primary outcome was the rate of AKI-related ADEs and pADEs within the intervention group compared to the concurrent control group. All study events originated from non-intercepted medication errors with a potential for injury that were active at the onset of AKI and continued for at least 24 hours. We report only on ADEs and pADEs associated with renal function, either through direct nephrotoxicity or with a well-described toxicity related to drug accumulation. For example, an active order for a recurring administration of a non-steroidal anti-inflammatory drug during the 24 hours after the initial change in serum creatinine was rated as a pADE, and an episode of bleeding after administration of enoxaparin unadjusted for renal function was rated as an ADE. A subcategory of ADEs, “lab-only” ADEs, was defined as highly elevated drug levels or electrolyte abnormalities consistent with previous ADE literature [31]. We evaluated provider behavior as our secondary outcome, measuring the time to provider reaction to the AKI event. We calculated the time from the first change in serum creatinine to modification or discontinuation of targeted medications ordered prior to the change [22] and the time from the initial order to modification or discontinuation of targeted medications ordered after the change. We assessed all outcomes after completion of the inpatient encounter (either by death or discharge); pADEs or ADEs occurring after patient discharge were not included in the analysis as outpatient follow-up was not routinely available for all patients.
Outcomes assessors were blinded to patient intervention status [32]. A study pharmacist (ZC) reviewed all enrolled cases to identify potential study events. The pharmacist recorded comorbidities present prior to AKI and reviewed each targeted medication order for a potential error or subsequent injury, drawing from the pre-specified lists of drugs (►Table 1) and potential AKI-related adverse events. An outcomes assessment adjudication committee composed of a nephrologist and an internal medicine physician (GB, NP) independently reviewed cases categorized as having at least one pADE or ADE, using methods previously applied to rate preventability and severity [33–35]. An additional nephrologist (ES) reviewed cases when disagreement occurred. Any residual disagreements within the committee were resolved by joint discussion.
We also measured outcomes describing the use of the surveillance tool. These included number of patients appearing on the tool, number of data items (e.g. drugs, labs, and CDS interactions of interest) for patients, time of day the tool was viewed, duration of views, number of patients with comments or EMR notes submitted, and the number of patients for which pharmacists intervened. We also evaluated comments and EMR notes recorded through the tool.
2.5. Sample Size
We estimated the sample size based on the rate of non-adjudicated medication errors measured from a retrospective database of medication orders and laboratory values, which had a median of 52.5 patient-medication pair events each week and a 45.4% baseline response rate. The planned 13 week trial produced 94% power to detect a 30% reduction in non-adjudicated errors, which we determined to be feasible after a previous analysis of the existing CDS found a significant opportunity for improvement [9].
2.6. Statistical Methods
We used the Pearson chi-square test for categorical variables and the t-test for continuous variables to perform univariate comparisons between the control and intervention groups. To evaluate provider behavior, we applied survival analysis methods for time to provider response, defined as a modification or discontinuation of a targeted drug order by any provider. For this analysis, we defined patient discharge or death as a censoring event. For medications ordered prior to the triggering event, follow-up started at the time of the triggering serum creatinine change, and for medications ordered after the triggering event, follow-up started at the time the medication was ordered. We used the log-rank test to measure the difference between control and intervention groups and provide Kaplan-Meier plots for visualization of the time to event data. Analyses were conducted with Stata 9.2.
3. Results
3.1. Study Population
►Figure 3 is a diagram of the selection steps for allocating patients to control or intervention and application of inclusion and exclusion criteria. During the three month trial period, 1,488 of 11,128 admitted adults experienced a triggering change of serum creatinine over 48 hours. We enrolled 540 cases; 278 were randomized to the control group, and 262 were randomized to the intervention group. The blinded outcomes assessment pharmacist identified 82 control and 62 intervention cases that met additional exclusion criteria that could not be determined electronically at the time of randomization; we included 396 cases in the final outcomes assessment. We compared demographic characteristics, including age, sex, race, admitting service, and admission to an intensive care unit, and comorbidities, which the initial outcomes assessment study pharmacist classified, between the control and intervention groups to ensure that the study groups were similar (►Table 2). We found no statistical difference between groups for any variable evaluated.
Fig. 3.

Flow diagram of control and intervention cases. Prior to analysis, a blinded outcomes assessment pharmacist evaluated cases for additional exclusion criteria that could not be determined electronically at the time of randomization.
Table 2.
Study population demographics for analyzed acute kidney injury surveillance cases
| Control Cases n = 196 |
Intervention Cases n = 200 |
P | |
|---|---|---|---|
| Age (y) | 58.3 (15.7) | 60.7 (16.8) | 0.2 |
| Sex (%) | |||
| Women | 39.2 | 47.0 | 0.1 |
| Men | 60.7 | 53.0 | 0.1 |
| Race (%) | |||
| White | 83.2 | 79.0 | 0.3 |
| Black | 10.2 | 17.0 | 0.05 |
| Hispanic | 1.5 | 0.5 | 0.3 |
| Other | 2.0 | 1.0 | 0.4 |
| Unknown | 3.1 | 3.0 | 0.9 |
| Admitting Service (%) | |||
| Cardiology | 20.9 | 15.0 | 0.1 |
| Critical Care | 11.2 | 17.5 | 0.08 |
| Geriatrics | 2.6 | 2.5 | 0.9 |
| Hematology/oncology | 8.2 | 7.5 | 0.8 |
| Hepatology | 2.6 | 1.5 | 0.4 |
| Infectious disease | 1.5 | 3.0 | 0.3 |
| Medicine | 12.8 | 12.5 | 0.9 |
| Orthopedics | 5.1 | 6.0 | 0.7 |
| Other | 2.0 | 4.5 | 0.2 |
| Surgery | 26.0 | 22.5 | 0.4 |
| Trauma | 7.1 | 7.5 | 0.9 |
| Intensive Care Unit (%) | 54.6 | 58.5 | 0.4 |
| Comorbidities (%) | |||
| Cancer | 28.6 | 22.5 | 0.2 |
| Cerebrovascular disease | 11.7 | 14.5 | 0.4 |
| Congestive heart failure | 24.5 | 26.0 | 0.7 |
| Coronary artery disease | 32.7 | 34.0 | 0.8 |
| Diabetes | 35.7 | 41.5 | 0.2 |
| End-stage liver disease | 4.6 | 4.0 | 0.8 |
| Hypertension | 62.2 | 67.0 | 0.3 |
| Mechanical ventilation | 29.6 | 25.5 | 0.3 |
| Peripheral vascular disease | 3.6 | 7.5 | 0.09 |
Values shown as mean ± standard deviation or percentage.
3.2. Evaluation of Adverse Drug Events
We evaluated 196 control cases with 1303 medication orders and 200 intervention cases with 1396 medication orders. Agreement between the two outcomes adjudication physicians was 93.97% for pADEs (kappa = 0.88) and 96.55% for ADEs (kappa = 0.93). ►Table 3 depicts the detailed breakdown of pADEs and ADEs after adjudication and consensus. The adjudication committee determined 76 (38.8%) control and 67 (33.5%) intervention cases experienced a pADE or ADE (RR = 0.86 [0.66, 1.12], p = 0.3) and 104 (7.98%) control and 99 (7.09%) intervention medication orders had an associated pADE or ADE (RR = 0.88 [0.68, 1.16], p = 0.4). Among cases who experienced at least one pADE or ADE in the control group, 55 (72.4%) experienced one, 15 (19.7%) experienced two, 5 (6.6%) experienced three, and 1 (1.32%) experienced four events; in the intervention group, 41 (61.2%) experienced one, 20 (29.9%) experienced two, and 6 (9.0%) experienced three events.
Table 3.
Evaluation of potential adverse drug events and adverse drug events
| Control n = 1303 |
Intervention n = 1396 |
P | |
|---|---|---|---|
| Potential adverse drug events | 68 (5.22%) | 63 (4.51%) | 0.4 |
| Contraindicated use for > 24 hours | 24 | 14 | 0.1 |
| No dose adjustment for > 24 hours | 10 | 15 | 0.2 |
| No interval adjustment for > 24 hours | 31 | 30 | 0.7 |
| Ineffective at low creatinine clearance | 1 | 3 | 0.4 |
| No drug level monitoring | 5 | 4 | 0.9 |
| No creatinine monitoring | 0 | 3 | 0.09 |
| Other | 7 | 2 | 0.07 |
| Lab-only adverse drug events | 14 (1.07%) | 16 (1.15%) | 0.9 |
| Hyperkalemia | 1 | 1 | 0.9 |
| Hypokalemia | 0 | 0 | - |
| Hypernatremia | 0 | 0 | - |
| Hyponatremia | 0 | 0 | - |
| Toxic drug levels | 9 | 9 | 0.9 |
| Subtherapeutic drug levels | 5 | 6 | 0.9 |
| Hypoglycemia (asymptomatic) | 0 | 0 | - |
| Adverse drug events | 22 (1.69%) | 20 (1.43%) | 0.6 |
| Bradyarrhythmia | 0 | 0 | - |
| Hypotension | 7 | 6 | 0.7 |
| QT Prolongation | 0 | 2 | 0.2 |
| Cognitive changes/somnolence | 1 | 4 | 0.2 |
| Delirium | 1 | 0 | 0.3 |
| Extrapyramidal symptoms/movement disorders | 0 | 1 | 0.3 |
| Oversedation | 3 | 2 | 0.6 |
| Seizure | 0 | 0 | -- |
| Rash | 0 | 1 | 0.3 |
| Hypoglycemia (symptomatic) | 0 | 0 | -- |
| Pancreatitis | 0 | 0 | -- |
| Diarrhea | 0 | 0 | -- |
| Anemia | 0 | 0 | -- |
| Lactic acidosis | 0 | 0 | -- |
| Major bleed | 0 | 1 | 0.3 |
| Minor bleed | 3 | 2 | 0.6 |
| Neutropenia | 0 | 0 | -- |
| Thrombocytopenia | 0 | 0 | -- |
| Neuromuscular control | 0 | 0 | -- |
| Vision changes | 0 | 0 | -- |
| Adverse drug events | 22 (1.69%) | 20 (1.43%) | 0.6 |
| Hearing loss | 0 | 0 | -- |
| Tinnitus | 0 | 0 | -- |
| Acute kidney injury (AKIN Stage 2 or 3) | 5 | 4 | 0.7 |
| Crystalurea | 0 | 1 | 0.3 |
| Renal replacement therapy | 0 | 0 | -- |
| Volume overload | 0 | 0 | -- |
| Respiratory depression | 1 | 1 | 0.9 |
| Death | 0 | 1 | 0.3 |
Abbreviations: AKIN = Acute Kidney Injury Network
Events represent patient-medication pairs.
More than one event may have been recorded for a patient-medication pair.
The total events included 52 (26.5%) control and 46 (23.0%) intervention cases experiencing a pADE (RR = 0.87 [0.61, 1.22], p = 0.4), and 68 (5.22%) control and 63 (4.51%) intervention medication orders having an associated pADE (RR = 0.86 [0.62, 1.21], p = 0.4). Frequent responses for pADEs categorized as “other” included “dose and interval change inappropriate for trough level” and “interacted with another prescribed medication”.
Lab-only ADEs occurred for 13 (6.6%) control and 16 (8.0%) intervention cases (RR = 1.21 [0.60, 2.44], p = 0.6); 14 (1.07%) control and 16 (1.15%) intervention medication orders had an associated lab-only ADE (RR = 1.07 [0.52, 2.18], p = 0.9). Actual ADEs occurred for 22 (11.2%) control and 19 (9.5%) intervention cases (RR = 0.85 [0.47, 1.51],p = 0.6); 22 (1.69%) control and 20 (1.43%) intervention medication orders had an associated actual ADE (RR = 0.85 [0.47, 1.55], p = 0.6). Severity and preventability of pADEs and ADEs was not significant between control and intervention groups (►Table 4).
Table 4.
Evaluation of potential adverse drug events and adverse drug events
| Control n = 1303 |
ntervention n = 1396 |
p | |
|---|---|---|---|
| Potential adverse drug events | |||
| Significant | 20 | 26 | 0.2 |
| Serious | 42 | 31 | |
| Life threatening | 3 | 6 | |
| Fatal | 1 | 0 | |
| Lab-only adverse drug events | |||
| Significant | 0 | 0 | 0.5 |
| Serious | 10 | 13 | |
| Life threatening | 4 | 3 | |
| Fatal | 0 | 0 | |
| Not preventable | 3 | 5 | 0.5 |
| Preventable | 11 | 11 | |
| Adverse drug events | |||
| Significant | 0 | 2 | 0.1 |
| Serious | 16 | 8 | |
| Life threatening | 6 | 9 | |
| Fatal | 0 | 1 | |
| Not preventable | 6 | 7 | 0.6 |
| Preventable | 16 | 13 | |
Events represent patient-medication pairs.
Among drugs or drug groups with at least ten orders in the control and intervention groups, errors most commonly occurred for vancomycin, beta lactam antibiotics, angiotensin-converting enzyme (ACE) inhibitors, nonsteroidal anti-inflammatory drugs (NSAIDs), quinolones, and angiotensin II receptor blockers (ARBs) comprising 22.2%, 15.3%, 12.3%, 9.4%, 8.9%, and 5.4% of orders resulting in a pADE or ADE respectively.
3.3. Evaluation of Provider Responses
For medications active at the time of patient’s triggering serum creatinine change or ordered after the event, we compared the time to provider response, defined as drug modification or discontinuation, using the log-rank test. While the time to response was shorter in the intervention group compared to the control group for medications, overall response times were highly variable, and we did not find any statistically significant differences between the control and intervention groups. ►Table 5 shows the resulting median times to response, hazard ratios, and p-values. Kaplan-Meier curves for these results are shown in ►Figure 4.
Table 5.
Evaluation of surveillance and provider response
| Control | Intervention | |||||
|---|---|---|---|---|---|---|
| n | Median Hours to Response (IQR) | n | Median Hours to Response (IQR) | Hazard Ratio (95% CI) | P | |
| Ordered prior to AKI | 332 | 25.9 (6.0, 49.5) | 374 | 18.3 (5.6, 47.2) | 1.0 (0.9, 1.2) | 0.2 |
| Medications to avoid | 104 | 26.6 (5.1, 55.1) | 111 | 13.4 (3.3, 42.0) | 1.1(0.8, 1.5) | 0.8 |
| Medications to adjust | 102 | 14.9 (4.8, 46.8) | 114 | 25.0 (5.5, 58.6) | 1.0 (0.8, 1.4) | 0.9 |
| Medications to review | 126 | 27.0 (7.8, 44.9) | 149 | 24.1 (7.8, 44.3) | 0.9 (0.7, 1.2) | 0.6 |
| Ordered after AKI | 576 | 34.8 (11.6, 73.5) | 625 | 32 (13.7, 73.0) | 1.1 (1.0, 1.2) | 0.2 |
| Medications to avoid | 173 | 25.9 (10.0, 63.9) | 148 | 31.3 (10.4, 70.1) | 1.0 (0.8, 1.3) | 0.9 |
| Medications to adjust | 159 | 38.0 (14.4, 82.3) | 217 | 27.2 (10.4, 69.5) | 1.2 (0.9, 1.5) | 0.2 |
| Medications to review | 244 | 43.8 (13.8, 72.0) | 260 | 35.6 (19.9, 72.0) | 1.1, (0.9, 1.3) | 0.5 |
Abbreviations: AKI = acute kidney injury, IQR = interquartile ranges
Fig. 4.

Kaplan-Meier curves for time to provider response. Follow-up began at the initial 0.5 mg/dl serum creatinine change for pre-trigger medications (ordered prior to the serum creatinine change) and at ordertime for post-trigger medications (ordered after the serum creatinine change).
3.4. Study Pharmacist Interactions with the Surveillance Tool
During the 3-month study period, 273 intervention patients appeared on the surveillance tool. The study pharmacist viewed the surveillance tool on 67 days (56 weekdays). Of the displayed intervention patients, 234 (85.7%) were reviewed by the study pharmacist, with an average of 10.75 patients reviewed each day the surveillance tool was monitored. Monitoring occurred between 08:00 and 16:00, although the study pharmacist primarily checked the surveillance tool in the afternoon, after providing teams had completed rounds, updated medication orders, and entered EMR notes, and laboratory results had returned. During a week of direct observation, the pharmacist spent 71 minutes monitoring the surveillance tool on Monday, and a mean of 16.75 minutes on the remaining days (25 on Tuesday, 9 on Wednesday, 15 on Thursday, and 18 on Friday).
The study pharmacist recommended an intervention for 43 (18.4%) cases, including 70 medication-specific recommendations and 8 patient-specific recommendations. Most cases without an intervention did not require a dose change; frequencies of recommended patient and medication interventions are described in ►Table 6. Medication recommendations categorized as “other” (9 medications) included correcting the patient’s weight, holding the medication, and monitoring for sedation. Patient recommendations categorized as “other” (2 cases) included redrawing serum creatinine, monitoring for sedation and treatment failure, discontinuing oral potassium, and adding height and weight.
Table 6.
Study pharmacist recommendations
| Total Responses | |
|---|---|
| No intervention recommended | 509 |
| Dialysis | 2 |
| Transplant | 0 |
| False lab measurement | 15 |
| Transient acute kidney injury | 8 |
| No active orders | 84 |
| Palliative care | 4 |
| No dose change required | 394 |
| Other | 2 |
| Patient intervention recommended | 8 |
| Monitor serum creatinine | 3 |
| Monitor serum potassium | 0 |
| Monitor other | 3 |
| Other | 2 |
| Medication Recommendations | 70 |
| Increase dose | 13 |
| Increase interval | 8 |
| Decrease dose | 9 |
| Decrease interval | 11 |
| Discontinue medication | 14 |
| Consider alternate medication | 7 |
| Monitor therapeutic drug levels | 13 |
| Other | 6 |
The study pharmacist most frequently indicated use of text pages and verbal communication to contact the providing team; recorded contact included 26 text pages, 28 verbal communications, and 1 EMR note. EMR notes were used when the providing team was unavailable (e.g. providing team does not have an attending on campus, or provider did not respond to text page). Providers agreed to make the recommended changes for 24 interventions (77% of recorded responses), the study pharmacist made changes to the orders directly in the CPOE system for 5 interventions (16%), and the provider disagreed with recommendation for 2 interventions (6%). The study pharmacist submitted 157 surveillance tool comments for 102 cases. The comments frequently summarized patient comorbidities, laboratory values and trends, and indications; served as reminders for continued monitoring; and elaborated recommendations.
4. Discussion
We performed a prospective, randomized comparative effectiveness trial to determine whether pharmacy surveillance improved medication safety during AKI when compared to clinical decision support alone. Despite appropriate interventions made by the study pharmacist, we found no significant improvements in the primary outcome, potential and actual ADEs, or the process outcome of timely medication adjustments. Overall, the number of interventions within the CDS far exceeded the interventions by the pharmacist, reflecting the ability for CDS to be active at all times and intervene more frequently and promptly. The findings suggest that, when implemented in a setting with comprehensive CDS, more intensive surveillance by a clinical pharmacist may be necessary to further improve the safety of prescribing during AKI.
The interventions of a clinical pharmacist have been found to be valuable in a variety of settings with manual medication dosing, significantly reducing rates of medication errors and ADEs [10–16]. However, one prior study has suggested no incremental benefit in ADE prevention with a rounding pharmacist when compared to order entry with CDS [36]. Similar to these findings, existing CDS during our intervention, including initial dosing of nephrotoxic and renally cleared drugs, CDS for monitoring of these medications within CPOE, and surveillance by other pharmacists in the event of changing laboratory values, resulted in a large percentage of already prevented errors. While some studies have found that surveillance successfully identifies pADEs and ADEs, they have not evaluated the effect of systems on actual error prevention [18–20, 37–41]. Some investigators have evaluated the use of retrospective CDS surveillance and real-time aggregate CDS surveillance [42, 43], but no prior study has evaluated the effect of surveillance of CDS in real time on patient or process outcomes. The restriction of our intervention and analysis to ADEs only related to AKI also makes it difficult to compare our results to these studies, which measured all types of ADEs. However, pharmacy use of the surveillance tool for monitoring AKI patients and CDS was similar to use described for a similar tool for aminoglycosides and anticoagulants [44]. Our study also differs from prior research in that we evaluated the surveillance tool in a setting with extensive existing CDS and clinical pharmacy support.
Other real-time surveillance approaches may be more successful. An alternate workflow, such as use of a distributed surveillance tool by front-line pharmacists approving and dispensing medication orders or by pharmacists or other providers participating in rounds might allow earlier, more frequent prevention of medication errors and reduction of ADEs. Because errors still occurred for patients that received an intervention, the timing of the surveillance and the ability of a single clinical pharmacist to monitor all at-risk patients may not have been appropriate. Greater integration of CDS and pharmacist interactions, with communication features, such that physicians and pharmacists could act as a coordinated team might further impact the results. Finally, implementation of surveillance may have a larger impact in institutions without such extensive CDS and clinical pharmacy services.
Several limitations are present. We conducted the trial in an academic, tertiary care medical center with extensive experience in CDS and clinical pharmacy services, which may have reduced the opportunity for surveillance to be effective. Application of the technology in a community hospital setting may yield a different result, particularly given the high number of medication errors related to renal function that have been previously reported in community settings [45]. Reproducing the surveillance tool requires integration of several advanced clinical systems, which many facilities have not implemented. However, most of the functionality can be recreated with access to common electronic sources of data, including patient census, laboratory, and order-entry [20]. The application of the technology to other domains outside of medication management during AKI should also be investigated. One methodological contribution to a negative result includes the possibility of crossover between study arms, since contacted physicians may care for patients randomized to both the intervention and control groups. While overlap of clinical pharmacy coverage occurred, only 3 control (1.5%) and 6 (3.0%) intervention cases were potentially exposed to the intervention pharmacist in the course of completing routine clinical duties. The study was also underpowered to detect smaller differences in ADE rates. A larger study with a higher intensity of surveillance is more likely to demonstrate a significant difference in patient outcomes. Finally, the inability of the system to electronically identify all patients meeting the exclusion criteria is a limitation of the CDS and affects the generalizability of the results. Because the exclusions were designed to eliminate patients at low risk of AKI-related ADEs, including these in the analysis would likely lower the event rates in both groups.
5. Conclusion
In conclusion, we evaluated through a randomized trial the comparative effectiveness of real-time clinical pharmacist surveillance and existing CDS for patients with AKI. Despite interventions made by the study pharmacist and a trend toward improved outcomes during surveillance, we found no statistically significant improvements in occurrence of potential ADEs or ADEs or in provider responses between control and intervention groups. The study emphasizes that, while CDS is effective at preventing pADEs and ADEs in patients with AKI, further research is necessary to determine whether surveillance can improve CDS performance.
Clinical Relevance Statement
Although a variety of informatics approaches to reducing adverse drug events exist, each can be costly to implement and maintain, and institutions or practitioners must often decide which is more advantageous. We sought to determine whether pharmacy surveillance was effective when compared to traditional clinical decision support alerts.
Conflicts of Interest
The authors declare that they have no conflicts of interest in the research.
Protection of Human and Animal Subjects
This study was approved by the Vanderbilt Institutional Review Board.
Acknowledgments
The authors were funded in part by National Library of Medicine grants T15 LM007450 and R01 LM009965. Some data collection was supported by NCRR/NIH grant UL1 RR024975. The authors thank Aihua Bian for her statistical review of the manuscript.
References
- 1.Miller RA, Waitman LR, Chen S, Rosenbloom ST. The anatomy of decision support during inpatient care provider order entry (CPOE): empirical observations from a decade of CPOE experience at Vanderbilt. J Biomed Inform 2005; 38(6): 469–485 [DOI] [PMC free article] [PubMed] [Google Scholar]
- 2.Galanter WL, Polikaitis A, DiDomenico RJ. A trial of automated safety alerts for inpatient digoxin use with computerized physician order entry. J Am Med Inform Assoc 2004; 11(4): 270–277 [DOI] [PMC free article] [PubMed] [Google Scholar]
- 3.Bates DW, Teich JM, Lee J, Seger D, Kuperman GJ, Ma’Luf N, et al. The impact of computerized physician order entry on medication error prevention. J Am Med Inform Assoc 1999; 6(4): 313–321 [DOI] [PMC free article] [PubMed] [Google Scholar]
- 4.Bates DW, O’Neil AC, Boyle D, Teich J, Chertow GM, Komaroff AL, et al. Potential identifiability and preventability of adverse events using information systems. J Am Med Inform Assoc 1994; 1(5): 404–411 [DOI] [PMC free article] [PubMed] [Google Scholar]
- 5.van der Sijs H, Aarts J, Vulto A, Berg M.Overriding of drug safety alerts in computerized physician order entry. J Am Med Inform Assoc 2006; 13(2): 138–147 [DOI] [PMC free article] [PubMed] [Google Scholar]
- 6.Koppel R, Metlay JP, Cohen A, Abaluck B, Localio AR, Kimmel SE, et al. Role of computerized physician order entry systems in facilitating medication errors. JAMA 2005; 293(10): 1197–1203 [DOI] [PubMed] [Google Scholar]
- 7.Ash JS, Sittig DF, Dykstra R, Campbell E, Guappone K.The unintended consequences of computerized provider order entry: findings from a mixed methods exploration. Int J Med Inform 2009; 78 (Suppl. 1): S69–S76 [DOI] [PMC free article] [PubMed] [Google Scholar]
- 8.Sittig DF, Singh H.Defining health information technology-related errors: new developments since to err is human. Arch Intern Med 2011; 171(14): 1281–1284 [DOI] [PMC free article] [PubMed] [Google Scholar]
- 9.McCoy AB, Waitman LR, Lewis JB, Wright JA, Choma DP, Miller RA, et al. A framework for evaluating the appropriateness of clinical decision support alerts and responses. J Am Med Inform Assoc 2012; 19(3): 346–352 [DOI] [PMC free article] [PubMed] [Google Scholar]
- 10.Kucukarslan SN, Peters M, Mlynarek M, Nafziger DA. Pharmacists on rounding teams reduce preventable adverse drug events in hospital general medicine units. Arch Intern Med. 2003; 163(17): 2014–2018 [DOI] [PubMed] [Google Scholar]
- 11.Leape LL, Cullen DJ, Clapp MD, Burdick E, Demonaco HJ, Erickson JI, et al. Pharmacist participation on physician rounds and adverse drug events in the intensive care unit. JAMA 1999; 282(3): 267–270 [DOI] [PubMed] [Google Scholar]
- 12.Kaushal R, Bates DW, Abramson EL, Soukup JR, Goldmann DA. Unit-based clinical pharmacists’ prevention of serious medication errors in pediatric inpatients. Am J Health Syst Pharm. 2008. Jul 1;65(13):1254–60 [DOI] [PubMed] [Google Scholar]
- 13.Schnipper JL, Kirwin JL, Cotugno MC, Wahlstrom SA, Brown BA, Tarvin E, et al. Role of pharmacist counseling in preventing adverse drug events after hospitalization. Arch Intern Med 2006; 166(5): 565–571 [DOI] [PubMed] [Google Scholar]
- 14.Fertleman M, Barnett N, Patel T. Improving medication management for patients: the effect of a pharmacist on post-admission ward rounds. Qual Saf Health Care 2005; 14(3): 207–211 [DOI] [PMC free article] [PubMed] [Google Scholar]
- 15.Falconnier AD, Haefeli WE, Schoenenberger RA, Surber C, Martin-Facklam M. Drug dosage in patients with renal failure optimized by immediate concurrent feedback. J Gen Intern Med 2001; 16(6): 369–375 [DOI] [PMC free article] [PubMed] [Google Scholar]
- 16.Brown G. Assessing the clinical impact of pharmacists’ interventions. Am J Hosp Pharm 1991; 48(12): 2644–2647 [PubMed] [Google Scholar]
- 17.Bladh L, Ottosson E, Karlsson J, Klintberg L, Wallerstedt SM. Effects of a clinical pharmacist service on health-related quality of life and prescribing of drugs: a randomised controlled trial. BMJ Qual Saf 2011; 20(9): 738–746 [DOI] [PubMed] [Google Scholar]
- 18.Kilbridge PM, Alexander L, Ahmad A. Implementation of a system for computerized adverse drug event surveillance and intervention at an academic medical center. J Clin Outcomes Manage 2006; 13(2): 94–100 [Google Scholar]
- 19.Classen DC, Pestotnik SL, Evans RS, Burke JP. Computerized surveillance of adverse drug events in hospital patients. JAMA 1991; 266(20): 2847–2851 [PubMed] [Google Scholar]
- 20.Jha AK, Laguette J, Seger A, Bates DW. Can surveillance systems identify and avert adverse drug events? A prospective evaluation of a commercial application. J Am Med Inform Assoc 2008; 15(5): 647–653 [DOI] [PMC free article] [PubMed] [Google Scholar]
- 21.Evans RS, Pestotnik SL, Classen DC, Burke JP. Evaluation of a computer-assisted antibiotic-dose monitor. Ann Pharmacother 1999; 33(10): 1026–1031 [DOI] [PubMed] [Google Scholar]
- 22.McCoy AB, Waitman LR, Gadd CS, Danciu I, Smith JP, Lewis JB, et al. A computerized provider order entry intervention for medication safety during acute kidney injury: a quality improvement report. Am J Kidney Dis 2010; 56(5): 832–841 [DOI] [PMC free article] [PubMed] [Google Scholar]
- 23.Chertow GM, Lee J, Kuperman GJ, Burdick E, Horsky J, Seger DL, et al. Guided medication dosing for inpatients with renal insufficiency. JAMA 2001; 286(22): 2839–2844 [DOI] [PubMed] [Google Scholar]
- 24.Sellier E, Colombet I, Sabatier B, Breton G, Nies J, Zapletal E, et al. Effect of alerts for drug dosage adjustment in inpatients with renal insufficiency. J Am Med Inform Assoc 2009; 16(2): 203–210 [DOI] [PMC free article] [PubMed] [Google Scholar]
- 25.Rind DM, Safran C, Phillips RS, Wang Q, Calkins DR, Delbanco TL, et al. Effect of computer-based alerts on the treatment and outcomes of hospitalized patients. Arch Intern Med 1994; 154(13): 1511–1517 [PubMed] [Google Scholar]
- 26.Field TS, Rochon P, Lee M, Gavendo L, Baril JL, Gurwitz JH. Computerized clinical decision support during medication ordering for long-term care residents with renal insufficiency. J Am Med Inform Assoc 2009; 16(4): 480–485 [DOI] [PMC free article] [PubMed] [Google Scholar]
- 27.Cox ZL, Nelsen CL, Waitman LR, McCoy JA, Peterson JF. Effects of clinical decision support on initial dosing and monitoring of tobramycin and amikacin. Am J Health Syst Pharm 2011; 68(7): 624–632 [DOI] [PMC free article] [PubMed] [Google Scholar]
- 28.Geissbühler A, Miller RA. A new approach to the implementation of direct care-provider order entry. Proc AMIA Annu Fall Symp 1996; 689–693 [PMC free article] [PubMed] [Google Scholar]
- 29.Giuse DA. Supporting communication in an integrated patient record system. AMIA Annu Symp Proc 2003;1065 [PMC free article] [PubMed] [Google Scholar]
- 30.Phillips I, Nelsen C, Peterson J, Sullivan T, Waitman L. Improving aminoglycoside dosing through computerized clinical decision support and pharmacy therapeutic monitoring systems. AMIA Annu Symp Proc 2008;1093 [PubMed] [Google Scholar]
- 31.Gurwitz JH, Field TS, Harrold LR, Rothschild J, Debellis K, Seger AC, et al. Incidence and preventability of adverse drug events among older persons in the ambulatory setting. JAMA 2003; 289(9): 1107–1116 [DOI] [PubMed] [Google Scholar]
- 32.McCoy AB, Peterson JF. The Greasemonkey Firefox Add-On for Altering Display of Data in a Web-Based Electronic Medical Record. AMIA Annu Symp Proc 2011;1884 [Google Scholar]
- 33.Bates DW, Leape LL, Petrycki S. Incidence and preventability of adverse drug events in hospitalized adults. J Gen Intern Med 1993; 8(6): 289–294 [DOI] [PubMed] [Google Scholar]
- 34.Pippins JR, Gandhi TK, Hamann C, Ndumele CD, Labonville SA, Diedrichsen EK, et al. Classifying and predicting errors of inpatient medication reconciliation. J Gen Intern Med 2008; 23(9): 1414–1422 [DOI] [PMC free article] [PubMed] [Google Scholar]
- 35.Leape LL, Bates DW, Cullen DJ, Cooper J, Demonaco HJ, Gallivan T, et al. Systems Analysis of Adverse Drug Events. JAMA 1995; 274(1): 35–43 [PubMed] [Google Scholar]
- 36.Bates DW, Leape LL, Cullen DJ, Laird N, Petersen LA, Teich JM, et al. Effect of computerized physician order entry and a team intervention on prevention of serious medication errors. JAMA. 1998; 280(15): 1311–1316 [DOI] [PubMed] [Google Scholar]
- 37.Jha AK, Kuperman GJ, Teich JM, Leape L, Shea B, Rittenberg E, et al. Identifying adverse drug events: development of a computer-based monitor and comparison with chart review and stimulated voluntary report. J Am Med Inform Assoc 1998; 5(3): 305–314 [DOI] [PMC free article] [PubMed] [Google Scholar]
- 38.Kane-Gill SL, Visweswaran S, Saul MI, Wong A-KI, Penrod LE, Handler SM. Computerized detection of adverse drug reactions in the medical intensive care unit. Int J Med Inform 2011; 80(8): 570–578 [DOI] [PMC free article] [PubMed] [Google Scholar]
- 39.Kilbridge PM, Noirot LA, Reichley RM, Berchelmann KM, Schneider C, Heard KM, et al. Computerized surveillance for adverse drug events in a pediatric hospital. J Am Med Inform Assoc 2009; 16(5): 607–612 [DOI] [PMC free article] [PubMed] [Google Scholar]
- 40.Tinoco A, Evans RS, Staes CJ, Lloyd JF, Rothschild JM, Haug PJ. Comparison of computerized surveillance and manual chart review for adverse events. J Am Med Inform Assoc. 2011; 18(4): 491–497 [DOI] [PMC free article] [PubMed] [Google Scholar]
- 41.Forster AJ, Worthington JR, Hawken S, Bourke M, Rubens F, Shojania K, et al. Using prospective clinical surveillance to identify adverse events in hospital. BMJ Qual Saf 2011; 20(9): 756–763 [DOI] [PMC free article] [PubMed] [Google Scholar]
- 42.Reynolds G, Boyer D, Mackey K, Povondra L, Cummings A. Alerting strategies in computerized physician order entry: A novel use of a dashboard-style analytics tool in a childrens hospital. AMIA Annu Symp Proc 2008;1108 [PubMed] [Google Scholar]
- 43.Zimmerman CR, Jackson A, Chaffee B, O’Reilly M. A dashboard model for monitoring alert effectiveness and bandwidth. AMIA Annu Symp Proc 2007;1176 [PubMed] [Google Scholar]
- 44.Waitman LR, Phillips IE, McCoy AB, Danciu I, Halpenny RM, Nelsen CL, et al. Adopting real-time surveillance dashboards as a component of an enterprisewide medication safety strategy. Jt Comm J Qual Patient Saf 2011; 37(7): 326–332 [DOI] [PubMed] [Google Scholar]
- 45.Hug BL, Witkowski DJ, Sox CM, Keohane CA, Seger DL, Yoon C, et al. Adverse drug event rates in six community hospitals and the potential impact of computerized physician order entry for prevention. J Gen Intern Med 2010; 25(1): 31–38 [DOI] [PMC free article] [PubMed] [Google Scholar]