

Abstract
Background
The Columbia Center for Children’s Environmental Health (CCCEH) previously reported widespread residential insecticide use in urban communities in New York City. Research suggests pyrethroids are replacing organophosphates (OPs) in response to 2000-2001 U.S. EPA pesticide regulations restricting OP use. A systematic assessment of active ingredients used for residential pest control is lacking.
Methods
We queried a database of pesticide applications reported by licensed applicators between 1999-2005 and surveyed pest control products available in 145 stores within 29 zip codes in the CCCEH catchment area including Northern Manhattan and the South Bronx.
Results
Pyrethroids, pyrethrins, piperonyl butoxide and hydramethylnon were the most common insecticide active ingredients reported as used by licensed pesticide applicators within the 29 zip codes of the CCCEH catchment area between 1999-2005. Use of certain pyrethroids and some non-spray insecticides such as fipronil and boric acid increased significantly by year (Logistic regression, OR > 1.0, p < 0.05), while use of organophosphates, including chlorpyrifos and diazinon decreased significantly by year (Logistic regression, OR < 1.0, p < 0.05). Among pesticide applicators, the most commonly applied active ingredients were formulated as spray applications. With 145 stores in the catchment area, 120 (82.5%) carried at least one insecticide. Spray cans were most common (114/120 stores, 95%); gels were least common (31/120 stores, 25.8%). Among spray formulations, pyrethroid insecticides were the most common pesticide class and permethrin, a pyrethroid, was the most common individual active ingredient. In 2007, one store carried a product containing chlorpyrifos and one store carried a product containing diazinon.
Conclusions
This survey suggests certain pyrethroids and non-spray insecticides replaced organophosphates for pest control in this area. Chlorpyrifos and diazinon have nearly been eliminated from products marketed for residential pest control.
Keywords: residential pest control, pesticides survey
Background
Residential pesticide use is widespread in the United States. More than 80% of families report use of pesticides in or around the home (Adgate et al. 2000; Davis et al. 1992). Estimates derived from the National Home and Garden Survey conducted in 2000 and 2001 indicate 78 million U.S. household (74%) use pesticides in and around the home (Kiely et al. 2004). The total amount of active ingredient applied 2000 and 2001 totaled 926 and 888 million pounds of active ingredient for 2000 and 2001, respectively. Approximately 12 % of all useage (62 million and 71 million pounds in 2001) were applied in homes or gardens (Kiely et al. 2004). There is growing evidence that residential pesticide use results in measurable levels of pesticides in blood and urine (Landrigan 2001; Lewis et al. 1994; Whitemore et al. 1994). Most insecticides are neurotoxicants, and experimental animal studies have revealed developmental and neurotoxic effects at relatively low doses during the prenatal and early postnatal periods (Jamal et al. 2002; Slotkin 2004; Vidair 2004). Several epidemiological studies describe associations between prenatal pesticide exposure and adverse health effects in developing infants and young children (Berkowitz et al. 2004; Eskenazi et al. 1999; Rauh et al. 2002; Whyatt et al. 2004; Young et al. 2005). Due to evidence of adverse sequelae associated with prenatal exposure to organophosphate insecticides, the U.S. Environmental Protection Agency withdrew the residential registrations for two commonly applied pesticides, chlorpyrifos and diazinon (U.S. EPA-a, b).
Recent data from environmental and biomonitoring studies indicate that the mix of active ingredients used for residential pest control has changed in response to the 2000-2001 U.S. EPA restrictions on residential uses of chlorpyrifos and diazinon (Whyatt et al. 2005; Whyatt et al. 2007; Williams et al. 2008). In 2001, the EPA withdrew the registration of chlorpyrifos for indoor and outdoor residential use, limiting use to certified agricultural operators and a few additional uses where children would not be exposed (e.g. golf courses, road medians and industrial plants) (U.S. EPA-a). Motions to phase-out the use of diazinon were initiated in January 2001 and the sale of diazinon-containing products designated for indoor use ended December 31, 2002 (U.S. EPA-b). Prior to the regulations, these two organophosphate insecticides were the major insecticides used for residential pest control (Thier et al. 1998; Whyatt et al. 2002b; Whyatt et al. 2005). Until 2001, the U.S. EPA estimated approximately 75% of diazinon use and 50% of chlorpyrifos use in the United States was for residential pest control (U.S. EPA, 2000; U.S. EPA 2001). In the longitudinal birth cohort conducted by the Columbia Center for Children’s Environmental Health (CCCEH) in New York City, we have documented a significant decrease in chlorpyrifos and diazinon levels in personal and indoor air samples collected from women during pregnancy and in maternal and umbilical cord blood collected immediately or soon after delivery from years 1998-2004 (Whyatt et al. 2005). Further, results from a survey of the availability of pesticide products containing chlorpyrifos and diazinon in the CCCEH catchment area demonstrated that the U.S. EPA phase-out was effective at removing chlorpyrifos and moderately effective at removing diazinon from store shelves (Carlton et al. 2004). However, while environmental and biological monitoring data and the store survey confirm decreased use of and exposure to phased-out insecticides, prenatal questionnaire data indicate that cockroach sightings and use of residential pest control have increased significantly over the same period among pregnant women enrolled into the CCCEH cohort (Williams et al. 2008). Among subjects enrolled into the CCCEH cohort between 1998-1999, 26% of subjects reported applying spray pesticides to control pests in the home during pregnancy, while 39% reported use of sprays by an exterminator (Whyatt et al. 2002a). Among subjects enrolled between years 2005-2006, 54% reported spray pesticide applications; 43% reported use of spray by an exterminator (Williams et al., 2008). Collectively, these findings suggest that the mix of active ingredients, in addition to pesticide usage patterns, have changed by year.
Preliminary evidence suggests pyrethroid insecticides are replacing the organophosphorous insecticides for residential control. This conclusion comes in part from; 1) recommendations by the U.S. EPA of alternatives to chlorpyrifos and diazinon for home use (U.S. EPA, 2002), 2) a recent survey by the Attorney General of New York State showing that pyrethroids were the major class of insecticides used by residents of public housing (Spitzer 2002), and 3) point of sales tracking data of residential pesticide sales (Bekarian et al. 2006). By the mid-1990’s, pyrethroids represented 23% of the U.S. dollar value of the world insecticide market (Berkowitz et al. 2003; Heudorf et al. 2004; Soderlund et al. 2002). In our own cohort, we observed an increase in detectable levels of piperonyl butoxide, a pyrethroid synergist, in personal air samples collected between years 2000 through 2005 (Williams et al., 2008). However, to date, a systematic assessment of the active ingredients contained in products to control residential pest is lacking.
We undertook the current study to determine which active ingredients were used for residential pest control in Northern Manhattan and the South Bronx. Our objectives were to confirm the decreased use of organophosphate insecticides following the 2000-2001 U.S. EPA regulations and to determine which insecticides replaced the restricted compounds for residential pest control. To establish the types of products and active ingredients applied by licensed pesticide applicators, we examined insecticide application data in Northern Manhattan and the South Bronx from 1999-2005 as reported in the Pesticide Sales and Use Reporting (PSUR) database collected by the New York State Department of Conservation (DEC). To determine which products were available for residents to apply for pest control, we surveyed pesticide products and active ingredients sold in stores located in Northern Manhattan and the South Bronx. This is the first research study to use PSUR database to examine trends in applicator data at the zip code level and compare these trends to insecticides sold for residential use at retail stores.
Methods
Pesticide Sales and Use Registry Database
To obtain information on the use of insecticides by licensed applicators within the catchment area of the CCCEH longitudinal cohort study, we collaborated with the New York City Department of Health and Mental Hygiene (NYCDOHMH). Following the passage of New York State’s Pesticide Reporting Law (1996), licensed pesticide applicators are required to report all pesticide applications (http://www.dec.ny.gov/chemical/27506.html). New York State’s Department of Environmental Conservation (DEC) contracted with Cornell University Cooperative Extension’s Pesticide Management Education Program to create the Pesticide Sales and Use Reporting (PSUR) database (http://pmep.cce.cornell.edu/psur/index.html). This database has been collecting pesticide use data from DEC licensed applicators from 1997 to the present. We queried a data system developed by NYCDOHMH that links PSUR annual zip code data on licensed pesticide use with U.S.EPA federal registration data to capture a pesticide product’s use type (insecticide or other), form (liquid or solid), and formulation (active ingredient listing). For the current analysis, we present data only for years 1999-2005, as the most complete data were available for this period.
Professional Insecticide Application Measures
We focus on the top ten most common active ingredients (by volume or weight) in each zip code and each year between 1999-2005. We determined an active ingredient was among the top ten based on total number of pounds or gallons applied within each zip code at each time point. A total of 63 “top ten” active ingredients were identified from the 29 zip codes and 7 years of data. Note the volume and weight totals are aggregated for all products containing a particular active ingredient; the formula for each product and the concentrations of each active ingredient are not factored into our calculations.
We investigated differences in forms (spray and non-spray types) of the top ten active ingredients by counting the number of active ingredient-formulation combinations reported in the 29 zip codes between 1999-2005 (total number of combinations = 9153). We looked at the count and percent distribution of the various forms.
We examined differences in use of each active ingredient by counting the number of times an individual active ingredient occurred among the top ten over the course of the seven years (maximum number of times = 203, or 29 multiplied by 7).
We used separate logistic regression models to predict the change in use of individual active ingredients by year. The logistic regressions predict the change in the odds that an active ingredient was among the top ten from 1999-2005, using year as a categorical predictor with indicator variables to represent year.
To predict the change in use of classes of compounds (e.g. pyrethroids and organophosphates) by year, we considered occurrences of any pyrethroid or organophosphate products in any of the top ten positions. Theoretically, a zip code could contribute between 10 and 20 “top ten” positions to the analysis, since we used weight or volume as criteria. There are 3206 observations that make up the “top ten” positions in the 29 zip codes over the 7 years. We used a logistic regression model to predict the change in the odds that a particular pesticide class was in one of the top ten positions by year (1999-2005), using indicator variables to represent year.
We also examined the change in professional insecticide application by volume and weight by year. Volume and weight were log transformed to near-normal distribution (skewness = -0.18 and -0.30, respectively). As there was no suggestion of significant temporal correlations between volume or weight by year (Pearson’s correlation, rho < 0.1 and p < 0.05), we used ANOVA of log transformed volume and weight totals to examine the change in application by year. Further, we stratified aggregated total volume and weight and compared quantities applied prior to the 2001 U.S EPA restrictions on chlorpyrifos (1999-2001) to quantities applied following the restriction date (2002-2005) using a t-test of log-transformed gallons and pounds. We used linear regression to examine changes in the log-transformed volume and weight totals for individual active ingredients by year as well, using a dichotomous variable for year (0 = 1999-2001; 1 = 2002-2005).
Store Survey
To obtain information regarding the types of insecticides available for residential pest control by non-professionals (i.e. by persons living within the home), we performed a survey of insecticides available in stores located in the catchment area of the CCCEH. The methodology employed for this store survey was adapted from that of Carlton et al., 2004. In summer 2007, a team of four volunteers from West Harlem Environmental Action (WE ACT) surveyed 145 stores in commercial areas within Northern Manhattan and the South Bronx. Surveyors canvassed 74 city blocks between July 24, 2007 and September 1, 2007. The prior study used the expertise of the Community Advisory Board (CAB) of the CCCEH to develop the protocols and schema for store sampling. The CAB is comprised of community leaders from the CCCEH catchment area. The CAB recommended sampling popular commercial areas serving the selected neighborhoods within Northern Manhattan and the South Bronx; Inwood, Washington Heights, the South Bronx and Harlem (Carlton et al. 2004). Within each neighborhood, areas were selected based on their concentration of stores and proximity to a residential area. We surveyed five types of stores where household insecticides can usually be purchased: bodegas (convenience stores), discount stores (typically 99 cent stores), hardware stores, pharmacies and supermarkets.
Within the commercial area of each neighborhood, research workers sampled the first three stores encountered on each block. If a block had fewer than three stores matching our criteria, all such stores on the block were surveyed. Because they are less commonly found than other store-types, all supermarkets encountered were sampled. Upon entering each store, researchers examined all residential pesticide products within the store by looking for displays of products marketed for pest control and by asking store clerks if they had any suggestions for cockroach control. Researchers noted the presence or absence of all pesticide products. Six different product-types were observed; can sprays, pest bombs/foggers, boric acid (powder), bait traps, sticky traps and gels. These products were divided into two general categories; spray applications products (can sprays, pest bombs, foggers) and non-spray application products (boric acid, sticky traps, gels and baits).
Since one of our objectives was to determine which active ingredients were replacing chlorpyrifos and diazinon, which were generally formulated as emulsifiable liquids or sprays, we recorded the U.S EPA registration number for all spray products. The registration number uniquely identifies each individual or combination of insecticide active ingredients found in each formulation. Notably, several different brand name products can have the same registration number. Of the 50 different spray insecticide products found in stores, we documented U.S.EPA registration numbers for 48/50 (96%). This information was recorded into field notebooks during or immediately following the store visit. If the researcher was uncomfortable recording the registration number within the store, funds were provided to purchase the products in question and record the information at a later time.
The chi-squared test of significance was used for categorical analyses to examine the relationships between store-type, neighborhood, application-type and active ingredient. All test of statistical analysis were two-sided with alpha = 0.05.
Results
Characterization of insecticides applied by professional pesticide applicators
The map in Figure 1 displays the four neighborhoods containing the 29 zip codes located within the CCCEH catchment area in New York City for which we present residential and licensed insecticide applications by licensed applicators between years 1999-2005. Of the top ten most common active ingredients applied in these zip codes between years 1999-2005, applications totaled 76,007 gallons and 202,901 pounds. More zip codes were surveyed in the South Bronx (16 zip codes) than in Harlem (9 zip codes) or Washington Heights (4 zip codes). The aggregated volume (gallons) of insecticides applied was not different between neighborhoods (ANOVA, p > 0.05). However, the aggregated weight (pounds) applied was significantly higher in Harlem than in the South Bronx or Washington Heights (ANOVA, p < 0.05). The quantity of insecticides applied changed significantly across years (ANOVA, p < 0.05 for both gallons and pounds). When we compared the aggregated quantity of insecticides applied prior to the 2001 U.S. EPA regulations (1999-2001) to those applied following the regulations (2002-2005), both the number of gallons and pounds of insecticides applied increased significantly by year (t-test, p < 0.05).
Figure 1.
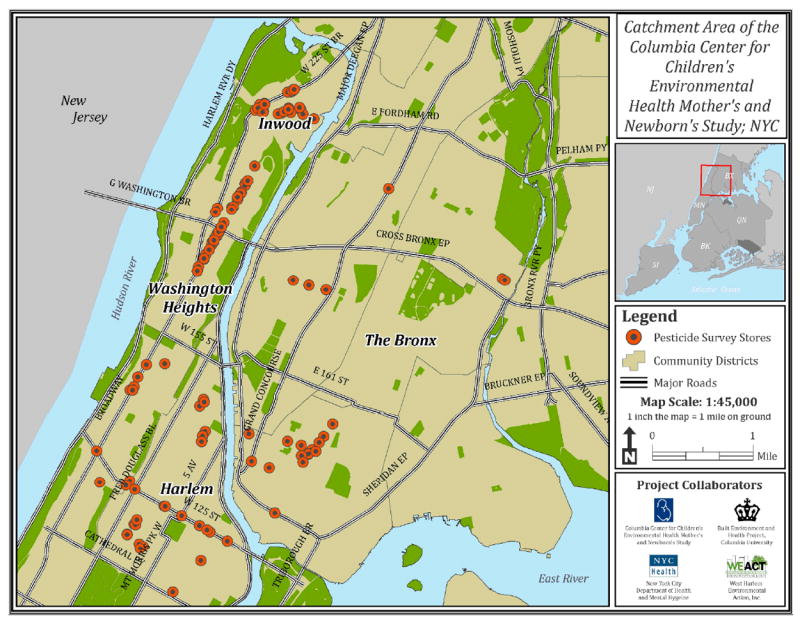
Four neighborhoods containing the 29 zipcodes within the CCCEH catchment area in New York City. Each red circle represents one of the stores surveyed for pest control products (n =145).
Among the top ten most common insecticide active ingredient-form combinations applied in the catchment area, the majority were formulated for aerosol spray application (72.4%). 22.1% were formulated for non-spray application; 5.5% were unclassifiable (Table 1). The method of pesticide application did not change significantly by year of application or neighborhood between 1999 and 2005. Sixty-four different active ingredients were applied in commercial and residential settings within the 29 zip codes in 1999-2005. Ingredients consisted of pyrethroid, organophosphate, and carbamate insecticides, pyrethrins, pesticide synergists, and others. The most common of these ingredients, those that appeared in the top ten category in at least 50% of all zip codes between 1999-2005 are listed in Table 2. The table includes the frequency and percentage of times that a particular active ingredient was among the top ten most common active ingredients in each of the 29 zip codes in the catchment area between years 1999-2005. We also show total volume (gallons) and weight (pounds) of formulations containing those active ingredients.
Table 1.
Insecticide forms among the top ten most common active ingredient-formulation combinations reported by licensedapplicators in the 29 zip codes within the CCCEH catchment area between 1999-2005
| Product Formulation Type* | Percent (%)** |
|---|---|
| Spray Formulations | 72.4% |
| Emulsifiable concentrate | 14.7 |
| Flowable concentrate | 0.6 |
| Microencapsulated | 6.5 |
| Oils | 0.4 |
| Pressurized dust | 1.1 |
| Pressurized liquid | 17.3 |
| Ready-to-use solution | 11.2 |
| Soluble concentrate | 11.2 |
| Wettable powder | 9.4 |
| Non-Spray Formulations | 22.1% |
| Dust | 10.0 |
| Impregnated materials | 2.3 |
| Granular | 9.8 |
| Unclassifiable | 5.5% |
Method of application as reported in the DOHMH PSUR database using EPA form types.
Percent calculated as the number of times an active ingredient-formulation combination for top ten most common active ingredients occurred across 7 years; the denominator equals 9153.
Table 2.
Product active ingredients among the top ten reported (by volume or weight) by licensedapplicators in 29 zip codes of the CCCEH catchment area between 1999-2005.
| Compound | Class | # of times in top 10 | % of times in top 10* | Total volume (gallons) | Total weight (pounds) |
|---|---|---|---|---|---|
| Piperonyl butoxide | Pyrethroid/Pyrethrin synergist | 203 | 100 % | 7847 | 20387 |
| Pyrethrins | Pyrethrin | 203 | 100 % | 7504 | 20404 |
| Hydramethylnon | Weak acid/desiccant | 203 | 100 % | 604 | 30946 |
| Cypermethrin | Pyrethroid | 201 | 99.0% | 27688 | 7320 |
| Fipronil | Phenyl pyrazole | 175 | 86.2% | 203 | 14223 |
| Boric acid | Weak acid, desiccant | 174 | 85.7% | 27 | 21210 |
| Propoxur | Carbamate | 171 | 84.2% | 275 | 7792 |
| Esfenvalerate | Pyrethroid | 164 | 80.1% | 3393 | 1029 |
| Cyfluthrin | Pyrethroid | 155 | 76.3% | 1866 | 1500 |
| Avermectin | Macrolytic lactone derivative | 135 | 66.5% | 396 | 4352 |
| Deltamethrin | Pyrethroid | 125 | 61.6% | 894 | 1918 |
| Cyhalothrin | Pyrethroid | 116 | 57.1% | 2821 | 520 |
Percent calculated as the number of times a compound was listed as one of the top ten most common active ingredients (by volume or weight) in any of 29 zip codes across 7 years; thus the denominator = 203.
Products containing pyrethroids, pyrethrins and the pesticide synergist, piperonyl butoxide, were among the top ten most common ingredients occurring within these zip codes (Figure 2a). Both the volume and weight of formulations containing pyrethrins increase significantly by year (Linear regression (ß ± SE); volume = 0.20 ± 0.04, p < 0.001, weight = 0.09 ± 0.04, p = 0.01). The aggregated weight of formulations containing piperonyl butoxide increased significantly by year of reporting (Linear regression, 0.09 ± 0.04, p = 0.02). Fourteen pyrethroid insecticide compounds occurred among the top ten most common active ingredients used in these zip codes. The occurrence of a pyrethroid in the top ten category increased by year. Table 3 shows the odds of any pyrethroid active ingredient occurring among the top ten by year, 1999-2005. The use of pyrethroids appears to increase by year, with a significant increase in odds of occurrence in the years 2003, 2004 and 2005 versus 2000, 2001 and 2002. The most commonly occurring pyrethroids include cypermethrin (99%), esfenvalerate (80.1%), deltamethrin (61.6%) and cyhalothrin (57.1%) (Table 2). While the occurrence of cypermethrin application among the top ten was consistently high across years, the weight of formulations applied increased significantly by year of reporting between 1999-2005 (Linear regression, 0.09 ± 0.04, p = 0.02). The aggregated volume of formulations containing esfenvalerate increased by year (linear regression, 0.18 ± 0.05, p < 0.001). Both the occurrence and the volume of formulations containing deltamethrin increased significantly by year (logistic regression on occurrence, 1.23 (1.12, 1.34), p < 0.001; linear regression on volume, 0.55 (0.06), p < 0.001). The weight of products applied containing deltamethrin decreased slightly. Both cyfluthrin and cyhalothrin commonly occurred in the top ten category (76.3% and 57.1% of occurrences, respectively), though the frequency of occurrence and quantity applied fluctuated across zip code and year. As seen in Table 3, the occurrence of ß-cyfluthrin and bifenthrin increased by year from 0% to 65% for ß-cyfluthrin and 0% to 52% for bifenthrin. However, the quantity of application of either active ingredient did not increase significantly. The remaining pyrethroids (permethrin, phenothrin, resmethrin, bioallethrin, tetramethrin and tralomethrin) occurred in the top ten category less than 10% of the time and the quantity of application did not change by year.
Figure 2.
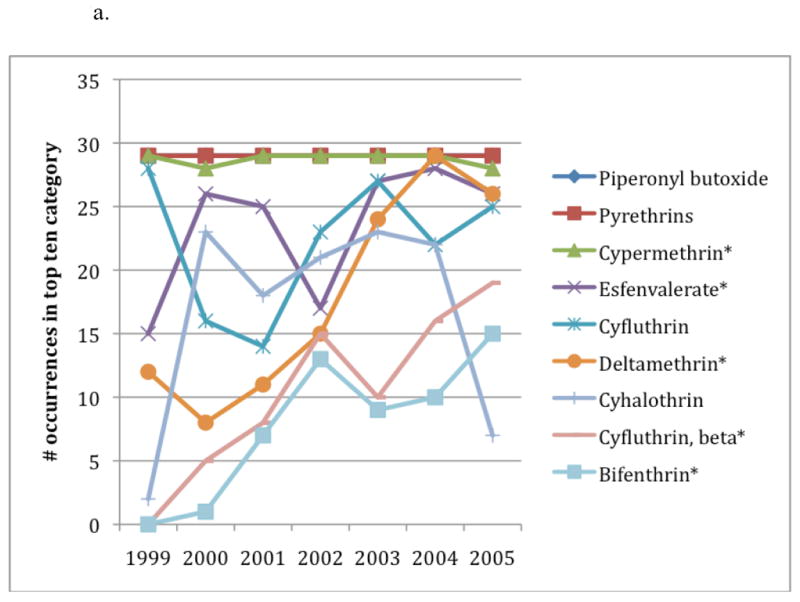
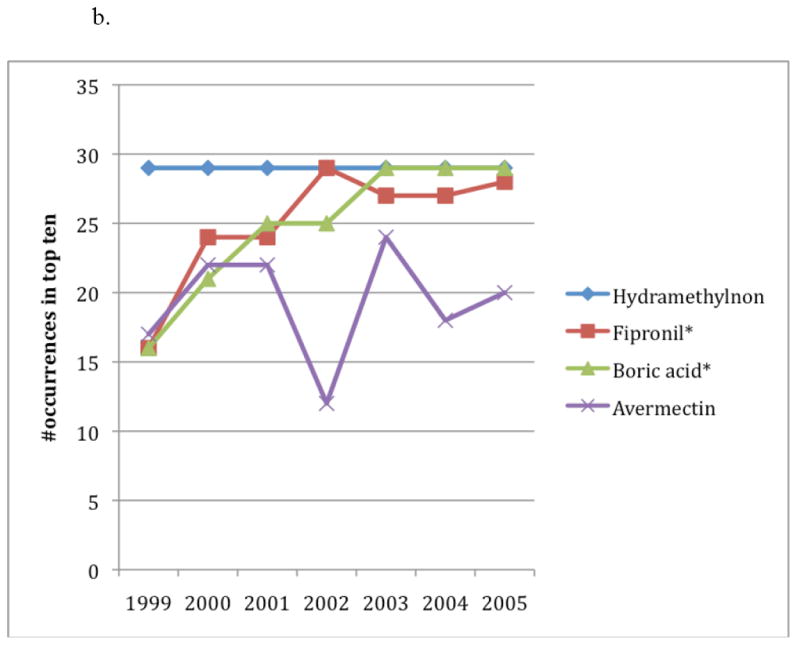
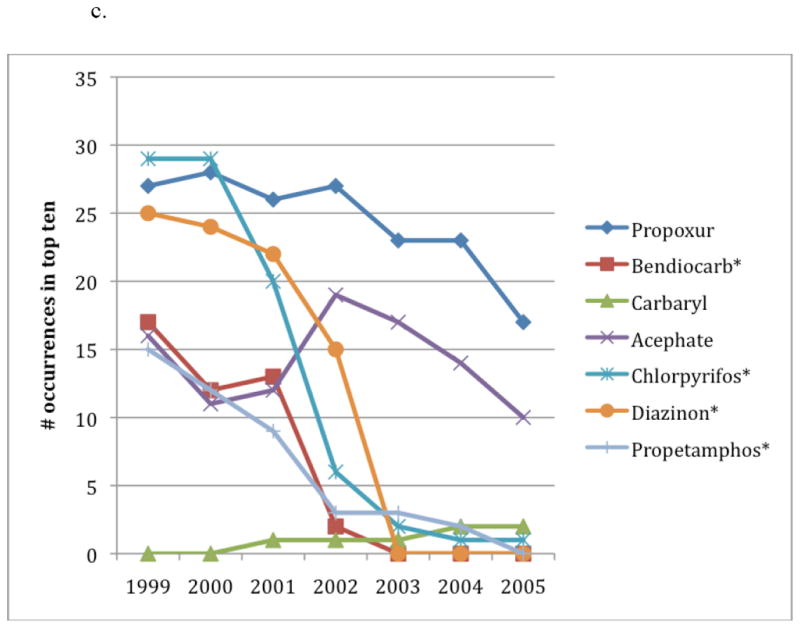
Among licensed applicators, odds of occurrence of active ingredients among the top ten in any of the 29 zip codes of the CCCEH area by year, 1999-2005; a. pyrethroids, pyrethrins and piperonyl butoxide, b. “other” insecticides, c. organophosphate and carbamate insecticides
*Occurrences of formulations containing cypermethrin, esfenvalerate, deltamethrin, ß-cyfluthrin and bifenthrin increased significantly by year of applications (Logistic regression, p < 0.05)
*Occurrences of formulations containing fipronil and boric acid increased significantly by year of applications (Logistic regression, p < 0.05)
*Occurrences of formulations containing bendiocarb, chlorpyrifos, diazinon and propetamphos decreased significantly by year of applications (Logistic regression, p < 0.05)
Table 3.
Odd ratios for pyrethroid or organophosphate active ingredients among the top ten reported (by volume or weight) by licensed applicators in any of 29 zip codes of the CCCEH catchment area by year, 1999-2005.
| Pyrethroid | Organophosphate | |||
|---|---|---|---|---|
| OR (95% CI) | p-value | OR (95% CI) | p-value | |
| 1999 | 1.0 (reference) | -- | 1.0 (reference) | -- |
| 2000 | 1.10 (0.83, 1.47) | 0.49 | 0.75 (0.53, 1.04) | 0.09 |
| 2001 | 1.07 (0.80, 1.43) | 0.65 | 0.61 (0.43, 0.86) | < 0.001 |
| 2002 | 1.20 (0.91, 1.60) | 0.20 | 0.39 (0.27, 0.58) | < 0.001 |
| 2003 | 1.36 (1.02, 1.80) | 0.03 | 0.19 (0.12, 0.31) | < 0.001 |
| 2004 | 1.43 (1.08, 1.90) | 0.01 | 0.15 (0.09, 0.25) | < 0.001 |
| 2005 | 1.32 (1.00, 1.75) | 0.05 | 0.09 (0.05, 0.17) | < 0.001 |
Other active ingredients occurring in the top ten most common category include hydramethylnon, fipronil, boric acid and avermectin (Figure 2b). Hydramethylnon was listed as one of the most common insecticides used in every zip code at every time point. The volume of formulations containing hydramethylnon stayed consistent over time, while the weight of formulations applied decreased slightly (linear regression, -0.08 (0.03), p = 0.02). Notably, the occurrence and weight of fipronil and boric acid applications increase by year (linear regression, fipronil = 0.20 (0.04), p < 0.001; boric acid = 0.24 (0.04) p < 0.001).
Five organophosphate insecticide compounds occurred within the top ten most common active ingredients with these zip codes; chlorpyrifos, diazinon, acephate, propetamphos and malathion (Figure 2c). The occurrence and quantity of all organophosphate insecticides decreased by year (linear regression, p < 0.001). Table 2 shows the decreased odds of any organophosphate compound occurring in the top ten category by year. After 2003, there were no reported uses of diazinon. After 2002, there were four reported applications of chlorpyrifos. Three of these chlorpyrifos applications individually totaled over 300 pounds. The occurrence of the three carbamate compounds within the top ten most common ingredient category either decreased (propoxur and bendiocarb) or stayed the same (carbaryl).
Characterization of the types of pesticide products carried in stores, 2007
Characterization of residential pest control products
Of 145 stores surveyed in Northern Manhattan and the South Bronx between August-September, 2007, residential pest control products were carried in 120 (82.8%). The majority of these stores (94/120, or 78.3%) carried both spray (can sprays, pest bombs, and foggers) and non-spray (sticky traps, bait traps, gels and boric acid) pesticide application types. The number of different pest control products carried in a store ranged from 1-16 and the median number of products per store was 4. Bodegas carried the least number of products (median = 3), hardware and supermarkets carried the greatest number of products (median = 6). A total of 111/120 (92.5%) stores carried at least 2 different pest control products. The percentage of stores carrying each application type is presented in Figure 3.
Figure 3.
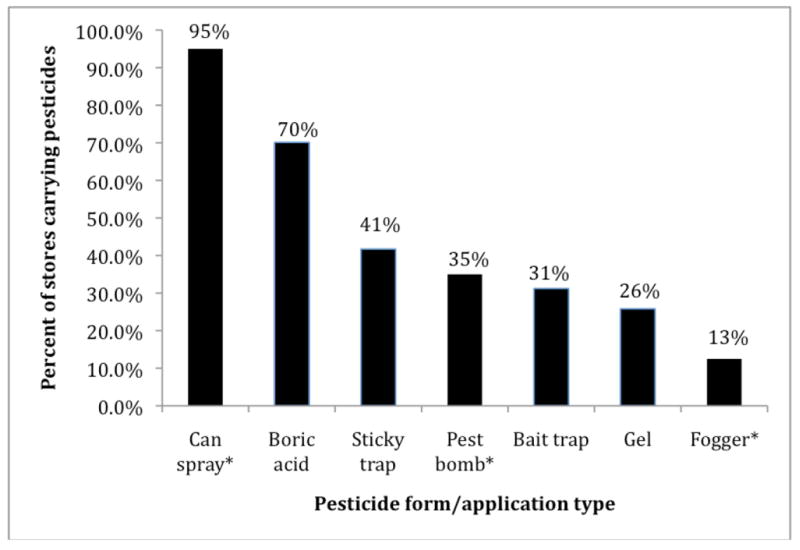
Frequencies of pesticide application types found within stores surveyed in the catchment area of the CCCEH (n=120 stores).
* Spray applications
Among the 120 stores carrying products for residential pest control, 114 (95.0%) carried a spray product. Can sprays were the most widely available spray pesticide application (114/120 stores, 95.0%). A total of 100/120 (83.3%) stores carried a non-spray product. Boric acid was the most widely available non-spray application (85/120 stores, 70.1%). Gels were the least common products found in stores (31/120 stores, 25.8%).
Availability of pesticide products by neighborhood and store-type
The presence of pesticide products (present vs. absent) varied significantly by store-type and neighborhood (chi-Squared = 8.66, p = 0.03 and chi-squared = 17.6, p = 0.001, respectively). Of the four neighborhoods, Harlem and South Bronx had stores more likely to carry pesticides than those located in Inwood and Washington Heights. Hardware stores were the most likely to carry pesticides (9/9, 100% of stores); followed by supermarkets: (35/36, 97.2% of stores). These two store types also carried the greatest variety of pesticides. Can sprays were the most frequently carried product type overall and were carried most frequently by hardware stores and supermarkets (9/9 stores, 100% and 35/36 stores, 97%, respectively). Bodegas were the stores least likely to carry pesticides (33/50, 66.0% of stores) and carried the fewest products. Other products were available less frequently than can sprays and showed greater variability by store-type. Of non-spray products, boric acid was widely available in all store types (range = 38-80.5%), and most widely available in supermarkets (80%). Sticky traps, gels and bait traps were found in > 67% of hardware stores, but in < 52% of all other store types.
Characterization of active ingredients used for residential pest control
Twenty different active ingredients were found in the 48 formulations. Ingredients could be categorized by insecticide class: 12 pyrethroids, 2 synergists, 2 organophosphates and 4 others (Figure 4). The number of active ingredients per formulation ranged from 1 – 5 (mean = 2). Pyrethroid insecticides were the most common class of insecticides recorded; 44/48 (92%) of the U.S. EPA registered formulations found in the stores contained one or more pyrethroid. Among these 48 formulations, permethrin was the most common active ingredient (20/48 formulations, 58.3%), followed by tetramethrin (15/48 formulations, 31.2%) and allethrin (8/48 formulations, 16.7%). The remaining pyrethroid insecticides were found in ≤ 5/48 formulations (10.4%). Among stores carrying spray products, 112/114 (98.2%) carried products containing a pyrethroid as the active ingredient. Pyrethrins were found in 8/48 formulations and 42/114 stores.
Figure 4.
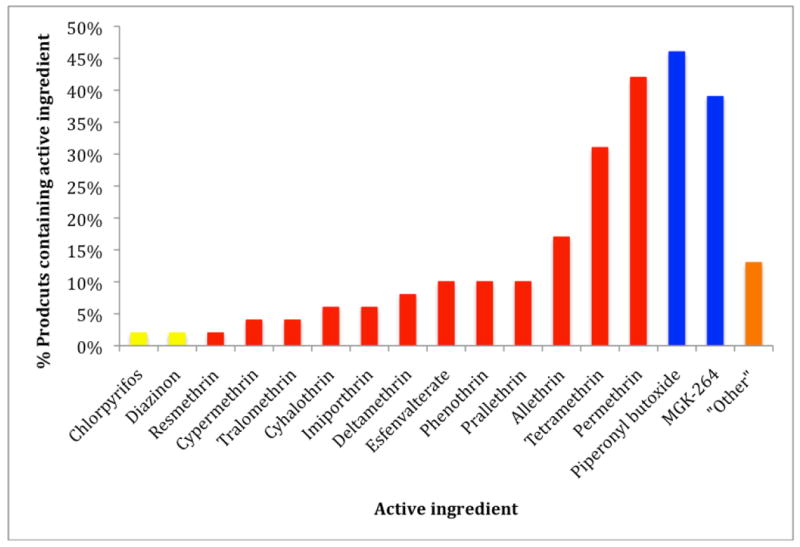
Common active ingredients found in spray application pesticides carried in stores located within the catchment area of the CCCEH study. 114/145 stores surveyed contained one or more spray application pesticide products (organophosphates, yellow; pyrethroids red; synergists, blue; other compounds, orange).
The 2 synergists, piperonyl butoxide and mgk_264 were each found in 12/48 formulations (25.0%). Two formulations contained both piperonyl butoxide and mgk_264. Notably, all formulations containing a synergist also contained at least one pyrethroid insecticide, though not all pyrethroid formulations contained a synergist. Piperonyl butoxide was most frequently formulated with permethrin (9/48 formulations, 18.7%), tetramethrin (8/48 formulations, 16.7%) and/or pyrethrins (4/48, 8.3%). 7/48 (14.5%) of formulations contained the combination of piperonyl butoxide, permethrin and tetramethrin. 2/48 formulations (4.0%) contained permethrin and piperonyl butoxide. Only one formulation contained tetramethrin with piperonyl butoxide without permethrin. 9/48 (18.8%) formulations contained mgk_264. Mgk_264 was most commonly formulated with esfenvalerate, a pyrethroid insecticide. 67 stores carried products containing piperonyl butoxide.
Of the 48 formulations, we found 2 containing phased-out or restricted compounds. One formulation contained chlorpyrifos and one product contained diazinon. Both of these products also contained allethrin and mgk_264.
Discussion
The main objective of the current study was to determine which insecticide active ingredients replaced the organophosphate insecticides (specifically, chlorpyrifos and diazinon) for residential pest control within the catchment area of the CCCEH study following the 2000-2001 U.S. EPA restrictions on organophosphate insecticide use. To our knowledge, this is the first attempt to assess the change in active ingredients contained in pest control products used within the home and by professional pesticide applicators following the 2000-2001 restrictions. As these regulations were nationwide, we predict these results are applicable to residential pest control in other U.S. cities with large numbers of apartment dwellers.
We used two sources of data to examine the insecticide active ingredients used within the catchment area of the CCCEH cohort. First, we queried a database of all residential and commercial pesticide applications by licensed pesticide applicators between years 1999-2005 to determine the types of pesticides applied and the most common active ingredients in the CCCEH catchment area. We also performed a survey of active ingredients contained in spray insecticide formulations carried in stores located in the CCCEH catchment area to determine which ingredients were most commonly purchased by individuals for household use.
Prior studies have demonstrated that the U.S. EPA regulations were quite effective at reducing use of and exposure to organophosphate insecticides in New York City (Carlton et al., 2004; Whyatt et al., 2007). Results from the current study confirm these trends. Organophosphates accounted for less than 10% of the occurrences of an active ingredient in the top 10 by zip code between 1999-2005. Chlorpyrifos and diazinon were the most common organophosphates reported; both the occurrence of formulations containing these compounds among the top ten and the quantity applied decreased significantly by year. After 2002, there were no reported applications of diazinon in the top ten. Notably, we observed a small number of chlorpyrifos applications following the regulations. Specifically, in 2003, 2004 and 2005, there were total applications in one zip code of a granular insecticide product containing chlorpyrifos of greater than 300 pounds. Store survey data also reflect decreased use of organophosphate insecticides. Among the 48 spray formulations found in stores, only one formulation contained chlorpyrifos and one formulation contained diazinon. Each of these products was only found one time in stores.
After confirming the decreased use of organophosphate insecticides by professional applicators and decreased sales within the catchment area, we examined rates and quantities of pyrethroid insecticides to determine if they were replacing the organophosphates for residential pest control. Pyrethroids are likely replacements for two reasons. As opposed to organophosphates, pyrethroids are not volatile and rapidly sequester out of the air following a spray application. This reduces the potential for inhalation exposure. Further, pyrethroids are rapidly degraded to less-toxic metabolites at high body temperatures, thus reducing mammalian toxicity (Soderlund et al., 2002). Note that pyrethroids, as most contemporary use pesticides, target the nervous system in both mammals and insects (Narahashi et al. 1998). Specifically, pyrethroids and pyrethroids target the voltage sensitive sodium channel in insects which is analogous to those seen in animals (Song and Narahashi 1996). Several lines of evidence suggest use and exposure to pyrethroids is increasing (Bekarian et al., 2006, Whyatt et al., 2003, 2007; Williams et al., 2008). For example, among subjects enrolled in the CCCEH longitudinal birth cohort, we observed an increase in permethrin and piperonyl butoxide measured in personal air samples collected during pregnancy between years 2000-2006 (Williams et al., 2008). Further, point of sales tracking of indoor-use permethrin products throughout the U.S. indicates a 15% increase between 1997 and 2002 (Bekarian et al., 2002).
Pyrethrins and pyrethroids were the most common active insecticide ingredients applied by professional applicators within the targeted zip codes throughout years 1999-2005. Further, piperonyl butoxide, a pesticide synergist and proxy for pyrethrin and pyrethroid use, was also frequently reported. Among the top ten most commonly applied ingredients, applicators reported using 14 different pyrethroid insecticides throughout the study period. The occurrence and quantity of products containing cypermethrin, esfenvalerate and deltamethrin increased significantly. Further, the frequency of reported use of ß-cyfluthrin and bifenthrin increased by year. Interestingly, among professional applicators, uses of formulations containing permethrin were fairly minimal. Permethrin was listed as one of the top ten most common ingredients among 29 zip codes less than 1% of the time, whereas it was the most common ingredient in products sold in stores.
From our survey of pest control products available within stores, pyrethroids appear to be the most common class of active ingredients contained in spray formulations for non-professional pest control. 92% of pesticide products carried in stores within the CCCEH catchment area contained at least one pyrethroid active ingredient and 93% of stores carried at least one spray product containing a pyrethroid. Of the 12 pyrethroids found in spray formulations, permethrin was the most common. Unlike professional applications, pyrethrins were not as commonly contained in products carried in stores. 8/48 (17%) products contained pyrethrins and 42/114 (37%) stores carried at least one spray formulation containing pyrethrins.
While the 2000-2001 U.S EPA regulations have resulted in a change in active ingredients, they may also have influenced a shift in the way pesticides are applied from spray formulations to non-spray formulations. Among the professional applicators, we observed a significant increase in reported use of boric acid and fipronil by year. Both are applied by non-spray methods to control pests within the home. Similarly, among products carried in stores for pest control, boric acid was the most commonly found non-spray pesticide and was found in 70% of stores. A comparison of our store survey data to that presented by Carlton et al., suggests that use of spray insecticides may be decreasing. In the 2004 study, 94% of stores carried spray cans. In this 2007 study, 78.6% of stores carried spray cans. It also appears that foggers and pest bombs are carried slightly less frequently in 2007. In the 2004 study and in the current survey, 69% of stores carried at least one form of non-spray application pesticides. Consistent with the prior survey, boric acid was the most widely available non-spray pesticide formulation.
Reported pesticide applications by professional applicators do not differ between the three neighborhoods included in the study. However, there are differences in the types of pesticides carried within different store types and between neighborhoods in the CCCEH catchment area. Notably, hardware stores and supermarkets in Harlem and the South Bronx were more likely to carry spray formulation pesticides than other store types in other neighborhoods. This information could be useful for developing interventions directed at reducing residential pesticide exposure.
Limitations of this study should be noted. Firstly, the PSUR data collects information on individual applications, but is only publicly available aggregated by weight and volume, and by year and zip code or county. This aggregate data can only be used to examine trends in the overall quantity of pesticide formulation applied. As the aggregate sum reflects the combination of different active ingredients, it is difficult to provide a quantity of individual active ingredients when some products have more than one ingredient. Similarly, it is difficult to make extrapolations about number of applications, since the weight or volume applied will be a function of the product formulation. Other limitations with PSUR database include incomplete reporting (a higher percentage of applicators failed to report in years prior to 1999) and inaccurate reporting (an applicator may report volume/weight before or after preparing the product for application). Further, not all applicators are licensed and only licensed applicators adhere to reporting guidelines. Classification of spray vs. non-spray based on EPA classified product form is also somewhat imprecise. For example, a “Ready-to-Use-Solution” could include either a liquid spray can or a non-spray gel.
Regarding the pesticide store survey data, the study was conducted using a convenience sample of stores located throughout the low-income catchment area of the CCCEH target communities. The targeted sampling of licensed areas may have led to underrepresentation of stores on residential blocks in this survey. These stores may have slower product turnover and might be more likely to contain older products containing the phased-out compounds. Further, researchers canvassed the study area over a several week period in August-September 2007. As we did not survey multiple times throughout the year, it is not possible to know which products are consistently displayed for sale or if products change with season.
With regard to the frequency of active ingredients marketed for residential pest control, we only documented the U.S. EPA registration numbers for spray formulations. We did not document the U.S EPA registration numbers for non-spray applications.
Conclusion
Residential exposure to pesticides is an increasing environmental concern in low-income, urban areas throughout the U.S. Understanding patterns of residential pesticide use and exposure are critical to identifying risks and devising prevention strategies. This study characterizes pesticide products used by professional pesticide applicators and carried by New York City stores for residential pest control, and leads to a better understanding of the active ingredients contained in those products and will contribute to more directed intervention efforts for safe residential pest control nationwide. Our own future research will examine the association between reported pesticide use and environmental and biological markers of pesticide exposure to better understand the health risks associated with residential pesticide use.
Acknowledgments
grant support: This study was supported by National Institute of Environmental Health Sciences grants P50 ES09600, RO1 ES012468, RO1 ES08977, and RO1 ES11158; U.S. Environmental Protection Agency grants R827027 and R82860901; and National Institutes of Health grant TL1 RR024158.
Abbreviations
- ANOVA
Analysis of variance
- CAB
Community Advisory Board
- CCCEH
Columbia Center for Children’s Environmental Health
- DEC
Department of Environmental Conservation
- NYCDOHMH
New York City Department of Health and Mental Hygiene
- OR
Odds Ratio
- PSUR
Pesticide Sales and Use Reporting
- U. S EPA
United States Environmental Protection Agency
- WE ACT
West Harlem Environmental Action
Footnotes
Competing interests declaration:
References
- Adgate JL, Kukowski A, Stroebel C, Shubat PJ, Morrell S, Quackenboss JJ, et al. Pesticide storage and use patterns in Minnesota households with children. J Expo Anal Environ Epidemiol. 2000;10(2):159–167. doi: 10.1038/sj.jea.7500078. [DOI] [PubMed] [Google Scholar]
- Bekarian N, Payne-Sturges D, Edmondson S, Chism B, Woodruff TJ. Use of point-of-sale data to track usage patterns of residential pesticides: methodology development. Environ Health. 2006;5:15. doi: 10.1186/1476-069X-5-15. [DOI] [PMC free article] [PubMed] [Google Scholar]
- Berkowitz GS, Obel J, Deych E, Lapinski R, Godbold J, Liu Z, et al. Exposure to indoor pesticides during pregnancy in a multiethnic, urban cohort. Environ Health Perspect. 2003;111(1):79–84. doi: 10.1289/ehp.5619. [DOI] [PMC free article] [PubMed] [Google Scholar]
- Berkowitz GS, Wetmur JG, Birman-Deych E, Obel J, Lapinski RH, Godbold JH, et al. In utero pesticide exposure, maternal paraoxonase activity, and head circumference. Environ Health Perspect. 2004;112(3):388–391. doi: 10.1289/ehp.6414. [DOI] [PMC free article] [PubMed] [Google Scholar]
- Carlton EJ, Moats HL, Feinberg M, Shepard P, Garfinkel R, Whyatt R, et al. Pesticide sales in low-income, minority neighborhoods. Journal of Community Health. 2004;29(3):231–244. doi: 10.1023/b:johe.0000022029.88626.f4. [DOI] [PubMed] [Google Scholar]
- Davis JR, Brownson RC, Garcia R. Family pesticide use in the home, garden, orchard, and yard. Arch Environ Contam Toxicol. 1992;22(3):260–266. doi: 10.1007/BF00212083. [DOI] [PubMed] [Google Scholar]
- Eskenazi B, Bradman A, Castorina R. Exposures of children to organophosphate pesticides and their potential adverse health effects. Environ Health Perspect. 1999;107(Suppl 3):409–419. doi: 10.1289/ehp.99107s3409. [DOI] [PMC free article] [PubMed] [Google Scholar]
- Heudorf U, Angerer J, Drexler H. Current internal exposure to pesticides in children and adolescents in Germany: urinary levels of metabolites of pyrethroid and organophosphorus insecticides. Int Arch Occup Environ Health. 2004;77(1):67–72. doi: 10.1007/s00420-003-0470-5. [DOI] [PubMed] [Google Scholar]
- Jamal GA, Hansen S, Julu PO. Low level exposures to organophosphorus esters may cause neurotoxicity. Toxicology. 2002;181-182:23–33. doi: 10.1016/s0300-483x(02)00447-x. [DOI] [PubMed] [Google Scholar]
- Kiely T, Donaldson D, Grube A, editors. Pesticides Industry Sales and Usage; 2000 and 2001 Market Estimates. (Biological and Economic Analysis Division OoPP, Office of Prevention, Pesticides, and Toxic Substances, ed) Washington, DC: U.S. Environmental Protection Agency; 2004. [Google Scholar]
- Landrigan PJ. Pesticides and polychlorinated biphenyls (PCBs): an analysis of the evidence that they impair children’s neurobehavioral development. Mol Genet Metab. 2001;73(1):11–17. doi: 10.1006/mgme.2001.3177. [DOI] [PubMed] [Google Scholar]
- Lewis RG, Fortmann RC, Camann DE. Evaluation of methods for monitoring the potential exposure of small children to pesticides in the residential environment. Arch Environ Contam Toxicol. 1994;26(1):37–46. doi: 10.1007/BF00212792. [DOI] [PubMed] [Google Scholar]
- Narahashi T, Ginsburg KS, Nagata K, Song JH, Tatebayashi H. Ion channels as targets for insecticides. Neurotoxicology. 1998;19(4-5):581–590. [PubMed] [Google Scholar]
- Rauh VA, Chew GR, Garfinkel RS. Deteriorated housing contributes to high cockroach allergen levels in inner-city households. Environ Health Perspect. 2002;110(Suppl 2):323–327. doi: 10.1289/ehp.02110s2323. [DOI] [PMC free article] [PubMed] [Google Scholar]
- Slotkin TA. Cholinergic systems in brain development and disruption by neurotoxicants: nicotine, environmental tobacco smoke, organophosphates. Toxicol Appl Pharmacol. 2004;198(2):132–151. doi: 10.1016/j.taap.2003.06.001. [DOI] [PubMed] [Google Scholar]
- Soderlund DM, Clark JM, Sheets LP, Mullin LS, Piccirillo VJ, Sargent D, et al. Mechanisms of pyrethroid neurotoxicity: implications for cumulative risk assessment. Toxicology. 2002;171(1):3–59. doi: 10.1016/s0300-483x(01)00569-8. [DOI] [PubMed] [Google Scholar]
- Song JH, Narahashi T. Differential effects of the pyrethroid tetramethrin on tetrodotoxin-sensitive and tetrodotoxin-resistant single sodium channels. Brain Res. 1996;712(2):258–264. doi: 10.1016/0006-8993(95)01449-7. [DOI] [PubMed] [Google Scholar]
- Spitzer E. Pest control in public housing, schools and parks: Urban children at risk. Attorney General of New York State; 2002. [Google Scholar]
- Thier A, Enck J, Klossner C. Plagued by pesticides: An analysis of New York State and New York City’s 1997 pesticide use and sales data. New York Public Interest Research Group; 1998. pp. 1–43. [Google Scholar]
- U.S. EPA-a. Chlorpyrifos Revised Risk Assessment and Agreement with Registrants. Washington, D.C: 2000. [Google Scholar]
- U.S. EPA-b. Diazinon Revised Risk Assessment and Agreement with Registrants. Washington, D.C: 2001. [Google Scholar]
- Vidair CA. Age dependence of organophosphate and carbamate neurotoxicity in the postnatal rat: extrapolation to the human. Toxicol Appl Pharmacol. 2004;196(2):287–302. doi: 10.1016/j.taap.2003.12.016. [DOI] [PubMed] [Google Scholar]
- Whitemore RW, Immerman FW, Camann DE, Bond AE, Lewis RG, Schaum JL. Non-occupational exposures to pesticides for residents of two U.S. cities. Arch Environ Contam Toxicol. 1994;26(1):47–59. doi: 10.1007/BF00212793. [DOI] [PubMed] [Google Scholar]
- Whyatt RM, Camann DE, Kinney PL, Reyes A, Ramirez J, Dietrich J, et al. Residential pesticide use during pregnancy among a cohort of urban minority women. Environ Health Perspect. 2002a;110(5):507–514. doi: 10.1289/ehp.02110507. [DOI] [PMC free article] [PubMed] [Google Scholar]
- Whyatt RM, Perera R, Tsai W, Kinney PL, Chew GL. Pesticide Use Among Inner City Communities. 2002b NIEHS Grant # ESO12468-03. [Google Scholar]
- Whyatt RM, Rauh V, Barr DB, Camann DE, Andrews HF, Garfinkel R, et al. Prenatal insecticide exposures and birth weight and length among an urban minority cohort. Environ Health Perspect. 2004;112(10):1125–1132. doi: 10.1289/ehp.6641. [DOI] [PMC free article] [PubMed] [Google Scholar]
- Whyatt RM, Camann D, Perera FP, Rauh VA, Tang D, Kinney PL, et al. Biomarkers in assessing residential insecticide exposures during pregnancy and effects on fetal growth. Toxicol Appl Pharmacol. 2005;206(2):246–254. doi: 10.1016/j.taap.2004.11.027. [DOI] [PubMed] [Google Scholar]
- Whyatt RM, Garfinkel R, Hoepner LA, Holmes D, Borjas M, Williams MK, et al. Within- and between-home variability in indoor-air insecticide levels during pregnancy among an inner-city cohort from New York City. Environ Health Perspect. 2007;115(3):383–389. doi: 10.1289/ehp.9546. [DOI] [PMC free article] [PubMed] [Google Scholar]
- Williams M, Rundle A, Holmes D, Reyes M, Hoepner L, Barr D, et al. Changes in Pest Infestation Levels, Self-reported Pesticide Use, and Permethrin Exposure during Pregnancy Following the 2000-2001 U.S. EPA Restriction of Organophosphates. Environ Health Perspect online 2008. 2008 doi: 10.1289/ehp.11367. [DOI] [PMC free article] [PubMed] [Google Scholar]
- Young JG, Eskenazi B, Gladstone EA, Bradman A, Pedersen L, Johnson C, et al. Association between in utero organophosphate pesticide exposure and abnormal reflexes in neonates. Neurotoxicology. 2005;26(2):199–209. doi: 10.1016/j.neuro.2004.10.004. [DOI] [PubMed] [Google Scholar]