Abstract
The binding and buffering of O2 and CO2 in the blood influence their exchange in lung and tissues and their transport through the circulation. To investigate the binding and buffering effects, a model of blood-tissue gas exchange is used. The model accounts for hemoglobin saturation, the simultaneous binding of o2 CO2. H+, 2,3-DPG to hemoglobin, and temperature effects [1,2]. Invertible Hill-type saturation equations facilitate rapid calculation of respiratory gas redistribution among the plasma, red blood cell and issue that occur along the concentration gradients in the lung and in the capillary-tissue exchange regions. These equations are well-suited to analysis of transients in tissue metabolism and partial pressures of inhaled gas. The modeling illustrates that because red blood cell velocities in the flowing blood are higher than plasma velocities after a transient there can be prolonged differences between RBC and plasma oxygen partial pressures. The blood-tissue gas exchange model has been incorporated into a higher level model of the circulatory system plus pulmonary mechanics and gas exchange using the RBC and plasma equations to account for pH and CO2 buffering in the blood.
39.1 Introduction
The exchange of O2 and CO2 between the tissue and vasculature depends on adequate delivery and removal of these gases. Oxygen delivery begins with inhalation of ambient air into the airspaces of the lung, transport to the blood from the alveoli, transport through the arterial system, and then exchange between the blood and the peripheral tissue. In a closed circulatory system, venous blood returns to the lungs where CO2 is expired. Quantifying O2 and CO2 transport requires accounting for their solubility in plasma, RBCs and tissue as well as their binding and release from the hemoglobin (Hb) in the RBCs and, in addition, for O2 only, its binding to myoglobin in tissue. Hemoglobin dissociation curves were developed that described the fraction of O2 and CO2 bound to Hb in the steady state as a function of PO2, PCO2. pH, 2,3-DPG and temperature [1], These expressions were used to describe the steady state transport of O2 and CO2 as well as H+ and HCO3− in a blood-tissue exchange model with convective transport and axial diffusion in the capillary along with exchange and metabolism in the surrounding tissue region [2].
The model presented in this study accounts for ventilatory exchange between outside air and lung alveoli, exchange with alveolar capillary blood, convective transport in arteries, the exchange in tissue capillaries and arterioles, and return of venous blood to the lungs. The model describes transport of O2 and CO2 to tissue as influenced by respiration rate, composition of inspired gas, H+ and CO2 production and O2 consumption in tissue and buffering in the blood.
A feature of biophysical interest but modest physiological importance is the persistence of disequilibria between plasma and RBC PO2 due to the higher velocities of RBC than plasma. This difference in velocity exists in all regions of the vasculature but is at a maximum in the microcirculation. Bloch [3] observed the existence of a layer of plasma close to the vessel wall, which he called the peripheral plasma layer. The average ratio of total layer thickness to vessel inside diameter was 1:4 in the 5–10 µm capillariies in Bloch’s study, which agrees with more recent observations of the endothelial surface layer seen by Vink and Duling [4]. Because this layer is close to the capillary wall the velocity of the plasma in that region is slower than the centerline axial velocity of the RBCs. To quantify the relative velocity ratio of RBC to plasma we have looked at indicator dilution studies that document the mean transit time of RBC-tagged versus plasma-tagged indicators by Goresky [5]. Goresky showed that the mean transit time of RBCs was on the order of 2/3 of that of the plasma through the entire hepatic vasculature.
39.2 Description of the Model
39.2.1 Lung-Blood Exchange Region
The lung module is composed of three serial compartments [6]: a low compliance compartment representing the oral/nasal cavity and the cartilaginous airways, a moderately compliant compartment characterizing the collapsible bronchial airways and a high compliance compartment resembling the alveolar space. In the model, the lung can be ventilated by positive pressure or by periodic chest expansion reducing intrapleural pressure, both resulting in bidirectional airflow and inflation and deflation of the lung. Convective flow between compartments is modeled as pressure-driven flow through a resistance. Equations for convective and diffusive transport of oxygen and carbon dioxide between adjacent lung compartments are similar to those used in previous models [6]. Each lung compartment is assumed to be well-mixed. The alveolar compartment exchanges respiratory gases with the plasma region of a blood-tissue exchange unit [2], which contains a region of red cells surrounded by a plasma region. The inhaled partial pressure of each species is a model input.
39.2.2 Blood-Tissue Exchange Region
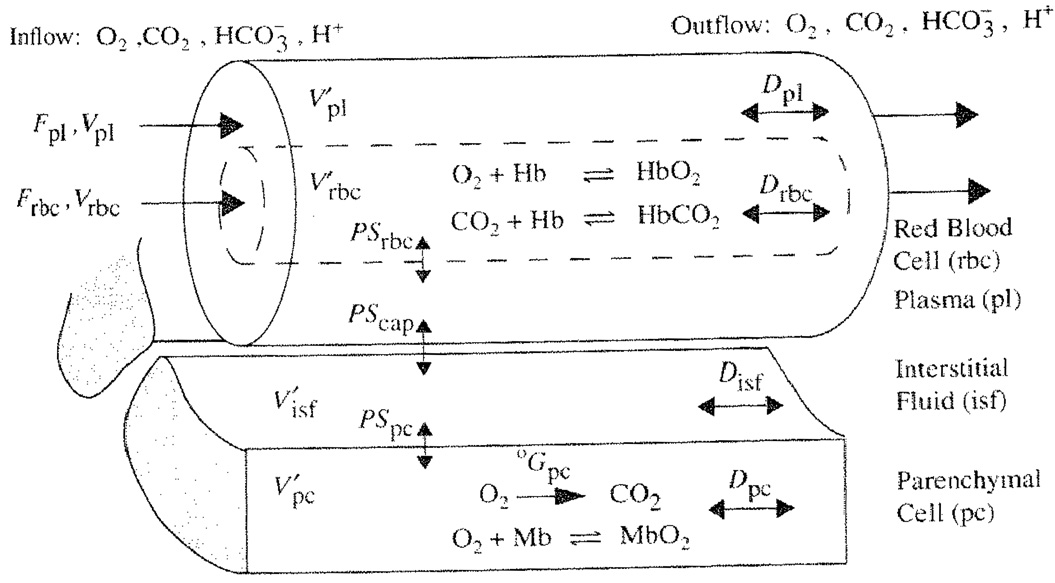
Figure 39.1 shows a previously described one-dimensional blood-tissue exchange model [2]. The lumen of a permeable vessel is divided into a flowing core of RBCs surrounded by a plasma sleeve. Hemoglobin binding is represented in the RBC region by the invertible hemoglobin dissociation expressions [1]. The exchange vessel endothelial barrier is treated as purely passive and is surrounded by an interstitial fluid layer giving access to parenchymal cells. In the parenchymal cells, where myoglobin buffers O2, oxygen is consumed and CO2 is produced in accord with the respiratory quotient: RQ = moles CO2 per mole O2 and a specified metabolic rate. Each region is axially-distributed, exhibiting concentration gradients from entrance to exit but well-mixed radially, and is represented by a 1-dimensional partial differential equation. Interregional conductances, defined by the permeability surface area product (PSx), can be adjusted to accommodate slow diffusional processes. Axial diffusion or dispersion (Dx) smoothes the axial concentration gradients.
Fig. 39.1.
Blood-tissue exchange unit showing red blood cell, plasma, interstitial fluid, and parenchymal cell regions, convection of RBC and plasma, solute transport between regions, the PSs, axial diffusion, binding, and buffering within regions. Bicarbonate buffering occurs in all regions. Each region is axially-distributed and radially well-mixed.
The ratio of RBC to plasma velocity in the blood tissue exchange region was calculated using experimental morphometric data on intramyocardial arterioles and venules from Kassab et al [7], and the reduction in hematocrit as a function of vessel diameter documented by Lipowsky [8], In our model we have represented the blood tissue exchange region as the arterioles and capillaries smaller than 100 µm in diameter because studies by Duling and Berne [9] show significant oxygen loss in the precapillary arterioles. For porcine coronary branching trees of Kassab, flow through the blood tissue exchange region has a relative velocity ratio, VRBC/Vpl of 1.2 to 1.9. Therefore an intermediate value of vRBC/Vpl, was taken as 1.5 in lung and tissue exchange regions.
39.2.3 Arterial and Venous Convective Regions
Lung capillary blood is carried through nonexchanging convective conduits (left atrium, left ventricle, aorta, arteries) to the tissue. RBC-plasma solute exchange continues. Red cell-plasma concentration differences persist when their velocities differ. Metabolism is zero, but buffering reactions continue. Values of the ratio of RBC to plasma velocity in the arteries and veins were taken to be 1.1 and 1.05 respectively, though the choice of these numbers is dependent on the range of diameters represented.
39.2.4 Numerical Methods and Simulation Procedures
Numerical methods are those described previously [10] using a Lagrangian sliding fluid element algorithm. Other partial differential equation solvers (Mac-Cormack, TOMS 731) are also available under the JSim simulation system. Parameter values in this model were those used previously [2] with a few exceptions. The flow rate is allowed to range from 5 L/min at rest to 25 L/min during exercise. Also the permeability surface area product for the RBCs (PSRBC) has been recalculated according to experimental evidence [11] to reflect the combination of a small hindrance to permeation of its membrane and the times required for binding and unbinding. The hemoglobin equations incorrectly assume instantaneous equilibration instead of taking several milliseconds. The lung model described here is similar in structure to the model by Lutchen et al. [6].
39.3 Results and Discussion
Two cases are examined in this study. The first concerns respiratory gas transport during normal and elevated ventilation, perfusion, and metabolism. For normal levels, the parameters are respiratory rate of 12 breaths/min, tidal volume of ~500 ml driven by 10 mmHg of inspiratory positive pressure at the mouth for 2 seconds and inspired air with PO2 = 150 and PCO2 = 0 mmHg. Blood flow was set to ~5 L/min and metabolic rate was adjusted so pulmonary end-capillary blood partial pressures of O2 and CO2 were ~100 and ~40 mmHg while venous values were 70 and 45 mmHg. The end tidal PO2 was 105 and PCO2 was 34 mmHg. The second case focuses on the equilibration of O2 between plasma and RBCs upon entering the arterial region and the effect of the relative velocity difference between plasma and RBCs on equilibration. To investigate the equilibration, the plasma partial pressure of oxygen is increased from 25 to 100 mmHg and the transient effects are observed. To investigate the effect of the relative velocity difference, a pulsed increase in plasma PO2 is applied at the upstream end and the difference between the plasma and RBC PO2 is quantified along the length of the arterial region.
39.3.1 Respiratory Gas Transport
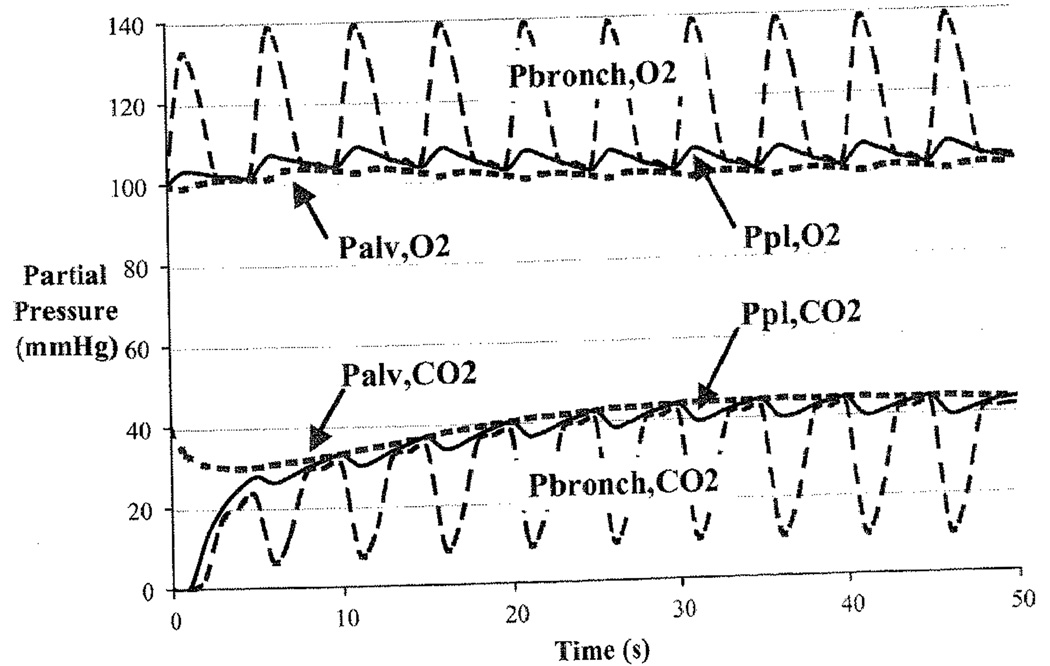
Figure 39.2 shows that the breathing cycle causes a cyclical variation in the partial pressures of O2 and CO2 in bronchiolar and alveolar air and in capillary plasma. Dispersion along the airways dampens the magnitude of the fluctuations. The partial pressure of CO2 in plasma is almost unaffected by the ventilatory cycle because it is buffered by the large bicarbonate pool in the blood.
Fig. 39.2.
Displays the partial pressures of O2 and CO2 in the plasma region of the blood (pl), the alveoli (alv), and the collapsible airways (bronch).
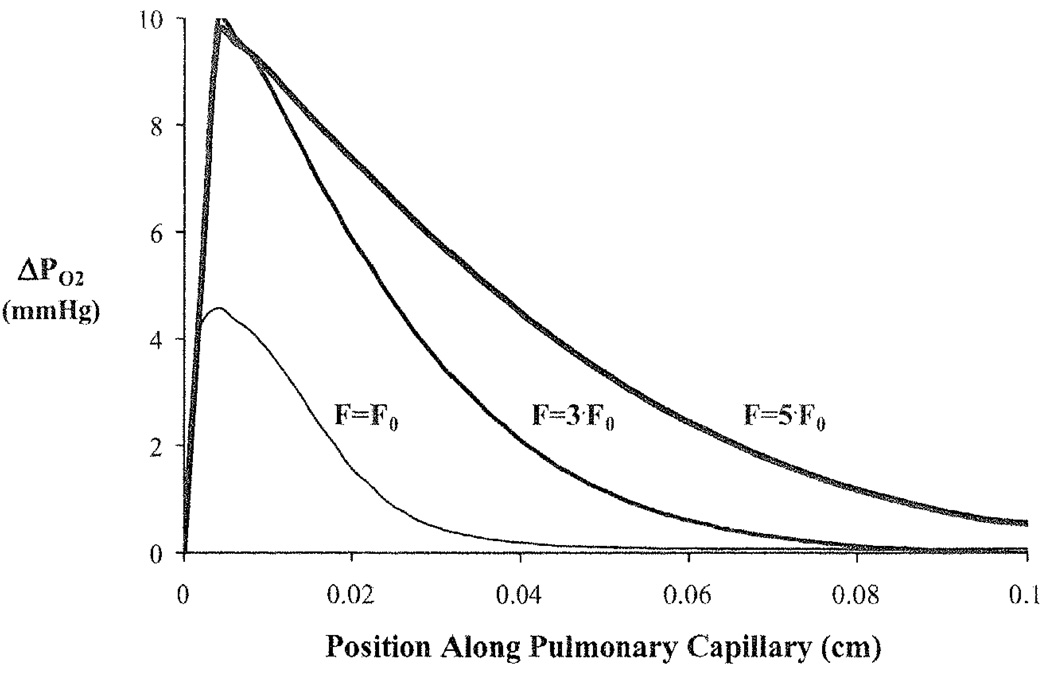
To load the red blood cell (RBC) with oxygen, oxygen moves from the well-mixed alveolar space through the plasma and into the RBC as the red blood cell moves along the length of the capillary. The relative speeds of these processes cause an axial and radial oxygen gradient to be established in the pulmonary capillary. Under normal conditions (given above), a large gradient between the plasma and RBC appears as the blood enters the capillary and disappears after the plasma and RBC have traveled ~40% of the capillary length (Fig. 39.3). However, if the normal ventilation (Falv, 0) and perfusion (F0) rate are both increased 3-fold (to offset a corresponding increase in tissue O2 metabolism), the initial gradient between plasma and RBC increases and the two regions only equilibrate after traversing ~80% of the capillary length. A 5-fold increase in ventilation and perfusion causes the two blood components to never equilibrate while in the pulmonary capillary.
Fig. 39.3.
Oxygen partial pressure gradients between the plasma and red blood cell (ΔPO2) at end-exhalation for a normal ventilation rate (Falv,0) and blood flow (F0) and when ventilation, blood flow, and metabolism are increased by 3-times and 5-times the normal rates.
ΔPO2 = PO2 (plasma) – PO2 (RBC).
39.3.2 Disequilibrium Between pO2 in Plasma and RBCs in Arteries
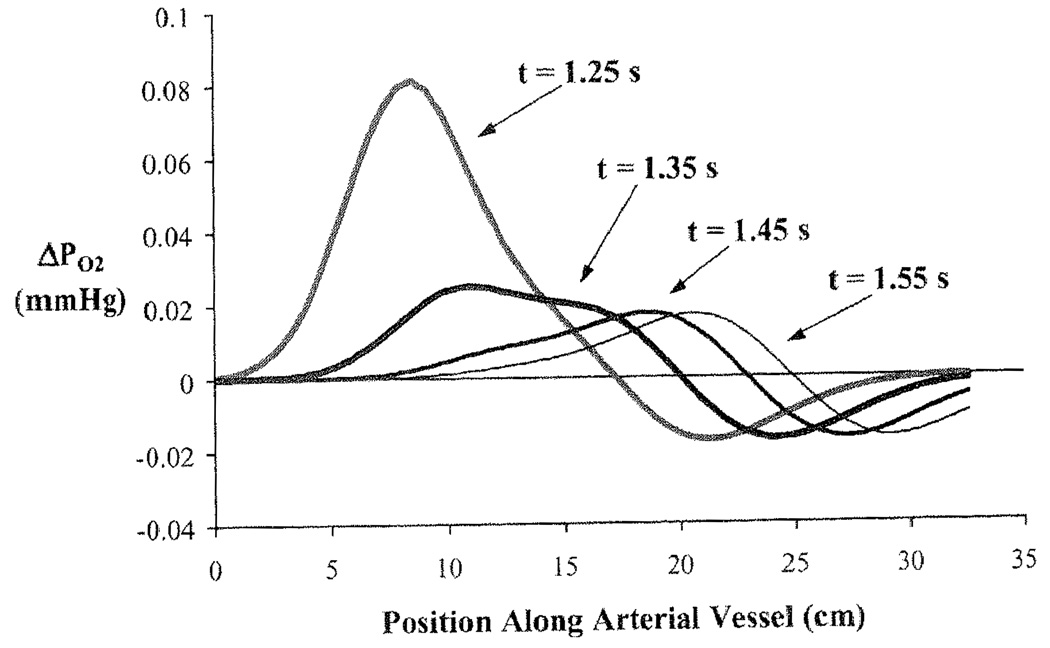
When RBC and plasma velocities are equal then equilibration across the RBC membrane occurs rapidly with a time constant governed by PSRBC/Vpl. In contrast, when VRBC/Vpl > 1 there is a continuing disequilibrium. To show this, the arterial module is isolated from the rest of the closed loop model and beginning with equilibrated PO2 at 25mmHg the plasma PO2 is increased to 100 mmHg while leaving the RBC PO2 unchanged. The relative velocity is given a value of 1.5 to illustrate the relative disequilibrium. In this simulation the concentration front has traveled about 7 cm. before the RBC and plasma concentrations equilibrate. Beyond this, the RBCs near the wavefront of heightened plasma PO2, having taken up O2, advance in the central stream ahead of the plasma front and release O2 into the plasma where the PO2 is still 25 mmHg. This process of RBCs taking up O2 behind the plasma front and then releasing it to raise the plasma PO2 continues. In Fig. 39.4 are shown plots of the ΔPO2 across the RBC membrane as a function of position along the aorta at 4 times, a tenth of a second apart after the step increase in plasma PO2 at x = 0 and t = 0. Initially the ΔPO2 is ~75 mmHg, but is quickly dissipated as plasma O2 enters the huge sink of the RBC Hb. Then as the RBCs that have taken up oxygen from the plasma advance ahead of the depleted plasma layer, they have a slightly higher PO2 than that in the plasma that had entered the tube before the pulsed increase and therefore lose oxygen to the plasma. The peak in ΔPO2 travels at VRBC = 25 cm/s. This peak ΔPO2 is very small because the carrying capacity for O2 in plasma is so small compared to that of RBC. The ΔPO2 is larger when RBCs are fully loaded as they travel through a region where oxygen is consumed in tissue; it is high when PScap is high compared to PSRBC and low in the reverse situation. It is relevant to the interpretation of plasma PO2 as measured by oxygen-dependent phosphorescent probes [12].
Fig. 39.4.
Difference in partial pressure of O2 between RBC and plasma along vessel length for a Gaussian shaped pulsed increase in plasma PO2 at the vessel entry. The four curves represent the pulse at four different times.
39.4 Conclusions
We have linked together a series of blood-tissue gas exchange models with a model of gas transport in the lung to describe respiratory gas exchange between the lung and tissue via circulating blood. We illustrated that changes in metabolism causing increases in CO2 production and O2 consumption can be compensated by simultaneous increases in ventilation and perfusion. O2 gradients between the plasma and red blood cell can persist along the length of the pulmonary capillary and in the arterial system because RBCs have higher velocities than plasma. The model is ideally suited for investigating questions concerning the integrative effects of pulmonary ventilation, chemical binding kinetics, vascular transport, and tissue metabolism on whole body respiratory gas exchange.
Acknowledgment
This research has been supported by NIH/BE-01973 and EB 08407 and HL 073598 and HL088516 and NSF 0506477. Erik Butterworth provided JSim support and assistance in representing this model code in Mathematical Modeling Language (MML). JSim and the model can be downloaded from www.physiome.org.
References
- 1.Dash RK, Bassingthwaighte JB. Blood HbO(2) and HbCO(2) dissociation curves at varied O-2, CO2, pH, 2,3-DPG and temperature levels. Ann Biomed Eng. 2004;32(12):1676–1693. doi: 10.1007/s10439-004-7821-6. [DOI] [PubMed] [Google Scholar]
- 2.Dash RK, Bassingthwaighte JB. Simultaneous blood-tissue exchange of oxygen, carbon dioxide, bicarbonate, and hydrogen ion. Ann Biomed Eng. 2006;34(7):1129–1148. doi: 10.1007/s10439-005-9066-4. [DOI] [PMC free article] [PubMed] [Google Scholar]
- 3.Bloch EH. A quantitative study of the hemodynamics in the living microvascular system. Am J Anat. 1962;110(2):125–153. doi: 10.1002/aja.1001100204. [DOI] [PubMed] [Google Scholar]
- 4.Vink H, Duling BR. Identification of distinct Iuminal domains for macromolecules, erythrocytes, and leukocytes within mammalian capillaries. Circ Res. 1996;79(3):581–589. doi: 10.1161/01.res.79.3.581. [DOI] [PubMed] [Google Scholar]
- 5.Goresky CA. A linear method for determining liver sinusiodal and extravascular volumes. Am J Physiol. 1963;204(4):626–640. doi: 10.1152/ajplegacy.1963.204.4.626. [DOI] [PubMed] [Google Scholar]
- 6.Lutchen KR, Primiano FP, Saidel GM. A non-linear model combining pulmonary mechanics and gas concentration dynamics. IEEEE Trans Biomed Eng. 1982;29(9):629–641. doi: 10.1109/TBME.1982.324936. [DOI] [PubMed] [Google Scholar]
- 7.Kassab GS, Rider CA, Tang NJ, Fung YCB. Morphometry of pig coronary-arterial trees. Am J Physiol Heart Circ Physiol. 1993;265(1):H350–H365. doi: 10.1152/ajpheart.1993.265.1.H350. [DOI] [PubMed] [Google Scholar]
- 8.Lipowsky HH, Usami S, Chien S. Invivo measurements of apparent viscosity and microvessel hematocrit in the mesentery of the cat. Microvasc Res. 1980;19(3):297–319. doi: 10.1016/0026-2862(80)90050-3. [DOI] [PubMed] [Google Scholar]
- 9.Duling BR, Berne RM. Longitudinal gradients in periarteriolar oxygen tension: A possible mechanism for participation of oxygen in local regulation of blood flow. Circ Res. 1970;27(5):669–678. doi: 10.1161/01.res.27.5.669. [DOI] [PubMed] [Google Scholar]
- 10.Bassingthwaighte JB, Chan ISJ, Wang CY. Computationally efficient algorithms for convection-permeation-diffusion models for blood-tissue exchange. Ann Biomed Eng. 1992;20(6):687–725. doi: 10.1007/BF02368613. [DOI] [PubMed] [Google Scholar]
- 11.Dalziel K, O’Brien JRP. The kinetics of deoxygenation of human haemoglobin. Biochem J. 1961;78:236–245. doi: 10.1042/bj0780236. [DOI] [PMC free article] [PubMed] [Google Scholar]
- 12.Vanderkooi JM, Maniara G, Green TJ, Wilson DF. An optical method for measurement of dioxygen concentration based upon quenching of phosphorescence. J Biol Chem. 1987;262(12):5476–5482. [PubMed] [Google Scholar]


