

Executive Summary
Objective
The objective of this analysis is to determine the effectiveness of solid organ transplantation in persons with end stage organ failure (ESOF) and human immunodeficiency virus (HIV+)
Clinical Need: Condition and Target Population
Patients with end stage organ failure who have been unresponsive to other forms of treatment eventually require solid organ transplantation. Similar to persons who are HIV negative (HIV−), persons living with HIV infection (HIV+) are at risk for ESOF from viral (e.g. hepatitis B and C) and non-viral aetiologies (e.g. coronary artery disease, diabetes, hepatocellular carcinoma). Additionally, HIV+ persons also incur risks of ESOF from HIV-associated nephropathy (HIVAN), accelerated liver damage from hepatitis C virus (HCV+), with which an estimated 30% of HIV positive (HIV+) persons are co-infected, and coronary artery disease secondary to antiretroviral therapy. Concerns that the need for post transplant immunosuppression and/or the interaction of immunosuppressive drugs with antiretroviral agents may accelerate the progression of HIV disease, as well as the risk of opportunistic infections post transplantation, have led to uncertainty regarding the overall benefit of transplantation among HIV+ patients. Moreover, the scarcity of donor organs and their use in a population where the clinical benefit of transplantation is uncertain has limited the availability of organ transplantation to persons living with ESOF and HIV.
With the development of highly active anti retroviral therapy (HAART), which has been available in Canada since 1997, there has been improved survival and health-related quality of life for persons living with HIV. HAART can suppress HIV replication, enhance immune function, and slow disease progression. HAART managed persons can now be expected to live longer than those in the pre-HAART era and as a result many will now experience ESOF well before they experience life-threatening conditions related to HIV infection. Given their improved prognosis and the burden of illness they may experience from ESOF, the benefit of solid organ transplantation for HIV+ patients needs to be reassessed.
Evidence-Based Analysis Methods
Research Questions
What are the effectiveness and cost effectiveness of solid organ transplantation in HIV+ persons with ESOF?
Literature Search
A literature search was performed on September 22, 2009 using OVID MEDLINE, MEDLINE In-Process and Other Non-Indexed Citations, EMBASE, the Cumulative Index to Nursing & Allied Health Literature (CINAHL), the Cochrane Library, and the International Agency for Health Technology Assessment (INAHTA) for studies published from January 1, 1996 to September 22, 2009.
Inclusion Criteria
Systematic review with or without a Meta analysis, RCT, Non-RCT with controls
HIV+ population undergoing solid organ transplantation
HIV+ population managed with HAART therapy
Controls include persons undergoing solid organ transplantation who are i) HIV− ii) HCV+ mono-infected, and iii) HIV+ persons with ESOF not transplanted.
Studies that completed and reported results of a Kaplan-Meier Survival Curve analysis.
Studies with a minimum (mean or medium) follow up of 1-year.
English language citations
Exclusion Criteria
Case reports and case series were excluded form this review.
Outcomes of Interest
i) Risk of Death after transplantation
ii) Death censored graft survival (DCGS)
-
iii) HIV disease progression defined as the post transplant incidence of:
- opportunistic infections or neoplasms,
- CD4+ T-cell count < 200mm3, and
- any detectable level of plasma HIV viral load.
iv) Acute graft rejection,
v) Return to dialysis,
vi) Recurrence of HCV infection
Summary of Findings
No direct evidence comparing an HIV+ cohort undergoing transplantation with the same not undergoing transplantation (wait list) was found in the literature search.
The results of this review are reported for the following comparison cohorts undergoing transplantation:
i) Kidney Transplantation: HIV+ cohort compared with HIV− cohort
ii) Liver Transplantation: HIV+ cohort compared with HIV− negative cohort
iii) Liver Transplantation: HIV+ HCV+ (co-infected) cohort compared with HCV+ (mono-infected) cohort
Kidney Transplantation: HIV+ vs. HIV−
Based on a pooled HIV+ cohort sample size of 285 patients across four studies, the risk of death after kidney transplantation in an HIV+ cohort does not differ to that of an HIV− cohort [hazard ratio (HR): 0.90; 95% CI: 0.36, 2.23]. The quality of evidence supporting this outcome is very low.
Death censored graft survival was reported in one study with an HIV+ cohort sample size of 100, and was statistically significantly different (p=.03) to that in the HIV− cohort (n=36,492). However, the quality of evidence supporting this outcome was determined to be very low. There was also uncertainty in the rate of return to dialysis after kidney transplantation in both the HIV+ and HIV− groups and the effect, if any, this may have on patient survival. Because of the very low quality evidence rating, the effect of kidney transplantation on HIV-disease progression is uncertain.
The rate of acute graft rejection was determined using the data from one study. There was a nonsignificant difference between the HIV+ and HIV− cohorts (OR 0.13; 95% CI: 0.01, 2.64), although again, because of very low quality evidence there is uncertainty in this estimate of effect.
Liver Transplantation: HIV+ vs. HIV−
Based on a combined HIV+ cohort sample size of 198 patient across five studies, the risk of death after liver transplantation in an HIV+ cohort (with at least 50% of the cohort co-infected with HCV+) is statistically significantly 64% greater compared with an HIV− cohort (HR: 1.64; 95% CI: 1.32, 2.02). The quality of evidence supporting this outcome is very low.
Death censored graft survival was reported for an HIV+ cohort in one study (n=11) however the DCGS rate of the contemporaneous control HIV− cohort was not reported. Because of sparse data the quality of evidence supporting this outcome is very low indicating death censored graft survival is uncertain.
Both the CD4+ T-cell count and HIV viral load appear controlled post transplant with an incidence of opportunistic infection of 20.5%. However, the quality of this evidence for these outcomes is very low indicating uncertainty in these effects. Similarly, because of very low quality evidence there is uncertainty in the rate of acute graft rejection among both the HIV+ and HIV− groups
Liver Transplantation: HIV+/HCV+ vs. HCV+
Based on a combined HIV+/HCV+ cohort sample size of 156 from seven studies, the risk of death after liver transplantation is significantly greater (2.8 fold) in a co-infected cohort compared with an HCV+ mono-infected cohort (HR: 2.81; 95% CI: 1.47, 5.37). The quality of evidence supporting this outcome is very low. Death censored graft survival evidence was not available.
Regarding disease progression, based on a combined sample size of 71 persons in the co-infected cohort, the CD4+ T-cell count and HIV viral load appear controlled post transplant; however, again the quality of evidence supporting this outcome is very low. The rate of opportunistic infection in the co-infected cohort was 7.2%. The quality of evidence supporting this estimate is very low, indicating uncertainty in these estimates of effect.
Based on a combined HIV+/HCV+ cohort (n=57) the rate of acute graft rejection does not differ to that of an HCV+ mono-infected cohort (OR: 0.88; 95% CI: 0.44, 1.76). Also based on a combined HIV+/HCV+ cohort (n=83), the rate of HCV+ recurrence does not differ to that of an HCV+ mono-infected cohort (OR: 0.66; 95% CI: 0.27, 1.59). In both cases, the quality of the supporting evidence was very low.
Overall, because of very low quality evidence there is uncertainty in the effect of kidney or liver transplantation in HIV+ persons with end stage organ failure compared with those not infected with HIV. Examining the economics of this issue, the cost of kidney and liver transplants in an HIV+ patient population are, on average, 56K and 147K per case, based on both Canadian and American experiences.
Background
Objective of Analysis
The objective of this analysis is to determine the effectiveness of solid organ transplantation in persons with end stage organ failure (ESOF) and human immunodeficiency virus (HIV+)
Clinical Need and Target Population
Patients with end stage organ failure who have been unresponsive to other forms of treatment eventually require solid organ transplantation. (1) Similar to persons who are HIV negative (HIV−), persons living with HIV infection (HIV+) are at risk for ESOF from viral (e.g. hepatitis B and C) and non-viral aetiologies (e.g. coronary artery disease, diabetes, hepatocellular carcinoma). Additionally, HIV9+ persons also incur risks of ESOF from HIV-associated nephropathy (HIVAN), accelerated liver damage from hepatitis C virus (HCV+), with which an estimated 30% of HIV positive persons are co-infected, and liver damage and/or coronary artery disease secondary to antiretroviral therapy. Concerns that the need for post transplant immunosuppression and/or the interaction of immunosuppressive drugs with antiretroviral agents may accelerate the progression of HIV disease as well as the risk of post transplant opportunistic infections, have led to uncertainty regarding the overall benefit of transplantation among HIV+ patients. Moreover, the scarcity of donor organs and their use in a population where the clinical benefit of transplantation is uncertain has limited the availability of organ transplantation to persons living with ESOF and HIV. (2-5)
With the development of highly active anti retroviral therapy (HAART) which has been available in Canada since 1997, there has been improved survival and health-related quality of life for persons living with HIV. HAART can suppress HIV replication, enhance immune function, and slow disease progression (6). HAART managed persons can now be expected to live longer than those in the pre-HAART era and many will now experience ESOF well before they experience life-threatening conditions related to HIV infection (3). It is estimated that up to 10% of HAART maintained persons will develop HIVAN, a form of kidney disease that can progress to kidney failure within months. (7). Co-infection with HCV cam also result in a more rapid progression to cirrhosis, liver failure, and hepatocellularcarcinoma (HCC). HCV related liver disease is now the leading non-acquired immunodeficiency syndrome cause of death in HIV+ infected persons in the developed world (4). Ragni et al. (8) reported that the cumulative pre-transplant survival among persons with ESLF after initial evaluation for transplant was significantly shorter among HIV+ versus HIV− transplant candidates (880 days vs. 1,427 days respectively, p=.035). Given the improved prognosis for people living with HIV infection and the burden of illness they may experience from ESOF, the benefit of solid organ transplantation for HIV+ patients needs to be reassessed.
Ontario Context
As of December 2007, about 28,700 persons in Ontario were diagnosed with HIV infection. (9) The number of HIV+ Canadians who could potentially benefit from organ transplantation, however, is unknown. As previously stated, it is estimated that up to 10% of persons living with HIV infection will develop HIVAN. Using this estimate and the 2007 Ontario prevalence rates for persons living with HIV infection in Ontario, approximately 2,900 persons may develop HIVAN. As of December 1999 an estimated 11,200 Canadians of whom 25% (~2,800) live in Ontario were co-infected with HIV and HCV. (10) Co-infection with hepatitis B virus (HBV) or HCV is known to accelerate the development of serious liver damage and end stage liver disease (ESLD) such that co-infected persons experience ESLD 10 years earlier, on average, than those infected with HCV alone.
As of December 4, 2009, the current number of persons awaiting organ transplantation in Ontario was 1,652, while the number of transplants performed in Ontario in 2009, year to date (YTD), was 887 (see Table 1). These estimates are updated regularly by the Trillium Gift of Life Network: www.giftoflife.on.ca
Table 1: Organ transplant wait-list and transplants performed in Ontario, 2009 (YTD).
| Organ | Patients waiting in Ontario, 2009 YTD | Transplants performed in Ontario, 2009 YTD |
|---|---|---|
| Heart | 54 | 59 |
| Kidney | 1,178 | 303 (organ from deceased donor) 212 (organ from living donor) |
| Liver | 293 | 149 (organ from deceased donor) 41 (organ from living donor) |
| Lung | 55 | 91 |
| Heart/Lung | 1 | 2 |
| Kidney/Pancreas | 47 | 18 |
| Pancreas | 20 | 12 |
| Small bowel | 4 | 0 |
| Total | 1,652 | 887 |
Source: Trillium Gift of Life Network: www.giftoflife.on.ca, accessed December 4-2009 http://www.giftoflife.on.ca/page.cfm?id=93C7F131-0C19-48D7-BBBC-D444069B220A
The Trillium Gift of Life Network is Ontario’s central organ and tissue donation agency. The Network is not involved in determining which patients are wait-listed; that decision is made by individual transplant programs. As soon as a potential candidate begins their assessment for transplantation they are registered on the Gift of Life Network’s computer linking solid organ transplant centers in Ottawa, Kingston, Toronto, Hamilton, and London. The name and medical information of each potential recipient is entered at the regional site and updated as needed. Once a patient is accepted as a suitable candidate, they are entered onto the waiting list and become eligible for allocation.
Organ allocation is based on provincially agreed-upon algorithms that include considerations about blood type, tissue typing and cross matching, medical priority, length of time on waiting list, and donor/recipient size comparisons. These algorithms are reviewed yearly and updated when appropriate. Ontario’s system has been expanded to incorporate registration of those out of province and international patients who require consideration for organ allocation.
Adverse Effects of Solid Organ Transplantation
While organ transplantation can be a life-saving procedure, considerable morbidity is still associated with the procedure. (10) Up to 80% of transplanted patients will develop a serious infection in the first year post transplantation (50%-60% bacterial, 20%-40% viral, and 5%-15% fungal). (10) Transplant patients are also at risk for a variety of conditions related to the chronic use of immunosuppressive drugs including osteoporosis, arthritis, hypertension, renal insufficiency, hyperglycemia, hyperlipidemia, bone marrow suppression, hyperuricemia/gout, chronic headache, GI distress (ulcer disease, chronic, diarrhea), encephalopathy/neurotoxicity, chronic pain and cancers. (10)
Evidence-Based Analysis
Research Question
What are the effectiveness and cost effectiveness of solid organ transplantation in persons with ESOF and HIV-infection?
Methods
Literature Search
A literature search was performed on September 22, 2009 using OVID MEDLINE, MEDLINE In-Process and Other Non-Indexed Citations, EMBASE, the Cumulative Index to Nursing & Allied Health Literature (CINAHL), the Cochrane Library, and the International Agency for Health Technology Assessment (INAHTA) for studies published from January 1, 1996 to September 22, 2009. Abstracts were reviewed by a single reviewer and, for those studies meeting the eligibility criteria, full-text articles were obtained. Reference lists were also examined for any additional relevant studies not identified through the search. Articles with an unknown eligibility were reviewed with a second clinical epidemiologist and then a group of epidemiologists until consensus was established.
Inclusion Criteria
The following inclusion criteria were used to determine study eligibility for this review:
Systematic review with or without a Meta analysis, RCT, Non-RCT with controls
HIV+ population undergoing solid organ transplantation
HIV+ population managed with HAART therapy
Controls include persons undergoing solid organ transplantation who are i) HIV− ii) HCV+ mono-infected, and iii) HIV+ persons with ESOF not transplanted.
Studies that completed and reported results of a Kaplan-Meier Survival Curve.
Studies with a minimum (mean or medium) follow up of 1-year.
English language citations
Exclusion Criteria
Case reports and case series were excluded form this review.
Outcomes of Interest
The outcomes of interest included:
i) Patient survival
ii) Death censored graft survival (DCGS),
iii) HIV disease progression defined as the post transplant incidence of i) opportunistic infections or neoplasms, ii) CD4+ T-cell count < 200mm3, and iii) any detectable level of plasma HIV viral load.
iv) Acute graft rejection,
v) Return to dialysis,
vi) Recurrence of HCV infection
Statistical Analysis
Data extraction
We extracted data elements from the published studies relevant to the estimation of hazard ratios (HR) of death associated with the following underlying infections: i) HIV+ versus no HIV infection and ii) co-infection of HIV and HCV versus HCV infection. The risk estimates were categorized as either kidney or liver transplant. Variation in the reporting of survival data was taken into account by using the methods in Parmar et al. (11) for extracting data elements suitable for the estimation of the log hazard ratio (logHR) and its variance. This included death rates in the infected groups and concurrent controls, as well as p-values testing for no differences in the death rates across infection status. When there was more than one method to derive the log(HR) estimates, all were calculated.
When mortality data were reported for multiple time points along the competing survival curves, the log(HR) estimate derived from the life-table approach described in Williamson et al. (12) was used. This estimate was also used when additional estimates could be derived for the logHR data described above. The latter estimates were used in sensitivity analysis.
Estimating hazard ratios
Methods for log(HR) estimates and their associated variances were implemented in Microsoft® Office Excel version 11.8 by a biostatistician. One reviewer calculated the initial estimates of log(HR) and the biostatistician performed quality control of the initial estimates. Disagreements were resolved via discussion and consensus.
Fixed-effects estimates were derived by pooling the log(HR) estimates across studies according to a set of study-specific weights that were inversely proportional to the variance of the estimates (i.e., precision). Clinical heterogeneity was assessed qualitatively by both reviewers. Random-effects estimates were also derived together with the test for heterogeneity (13;14); a p-value > 0.1 was interpreted as indication for significant statistical heterogeneity.
Quality of Evidence
The quality of the body of evidence was assessed as high, moderate, low, or very low according to the GRADE Working Group criteria (15) as presented below.
Quality refers to the criteria such as the adequacy of allocation concealment, blinding and follow-up.
Consistency refers to the similarity of estimates of effect across studies. If there are important and unexplained inconsistencies in the results, our confidence in the estimate of effect for that outcome decreases. Differences in the direction of effect, the magnitude of the difference in effect, and the significance of the differences guide the decision about whether important inconsistency exists.
Directness refers to the extent to which the interventions and outcome measures are similar to those of interest.
As stated by the GRADE Working Group, the following definitions of quality were used in grading the quality of the evidence:
| High | Further research is very unlikely to change confidence in the estimate of effect. |
| Moderate | Further research is likely to have an important impact on confidence in the estimate of effect and may change the estimate. |
| Low | Further research is very likely to have an important impact on confidence in the estimate of effect and is likely to change the estimate. |
| Very Low | Any estimate of effect is very uncertain |
Results of Evidence-Based Analysis
The systematic literature search yielded 1,204 citations (search details are available in Appendix 1). After reviewing titles and abstracts, 1,144 of these citations were rejected and 60 full text articles were retrieved for further consideration. Upon review of the full publications, 15 studies met the inclusion and exclusion criteria and were included in this review. Twelve of the 15 studies were retrospective cohort studies with contemporaneous controls (see Table 2). Of the remaining three studies, one was described as a case control design (16), the second was a prospective cohort study(17), and the third was a mixed design study having a prospective treatment cohort and a retrospective control cohort.(18) Of the 15 studies, three reported relevant outcome results for kidney transplantation only (19-21), 10 for liver transplantation only (4;6;16;17;22-27), and two reported outcomes for both liver and kidney transplantation(18;28).
Table 2: Included studies.
| Study Design | Level of Evidence† | Number of Eligible Studies |
|---|---|---|
| Large RCT, systematic review of RCTs | 1 | |
| Large RCT unpublished but reported to an international scientific meeting | 1(g) | |
| Small RCT | 2 | |
| Small RCT unpublished but reported to an international scientific meeting | 2(g) | |
| Non-RCT with contemporaneous controls | 3a | 15 |
| Non-RCT with historical controls | 3b | |
| Non-RCT presented at international conference | 3(g) | |
| Surveillance (database or register) | 4a | |
| Case series (multisite) | 4b | |
| Case series (single site) | 4c | |
| Retrospective review, modelling | 4d | |
| Case series presented at international conference | 4(g) | |
| Total |
RCT refers to randomized controlled trial;
Goodman, C. Literature searching and evidence interpretation for assessing health care practices. Stockholm, Sweden: Swedish Council on Technology Assessment in Health Care. 1996. 81p. SBU Report No. 1 (29)
The results of this review are reported for the following comparison groups:
i) Kidney Transplantation: HIV+ cohort compared with HIV− cohort
ii) Liver Transplantation: HIV+ cohort compared with HIV− cohort
iii) Liver Transplantation: HIV+ HCV+ (co-infected) cohort compared with HCV+ (mono-infected) cohort
Kidney Transplantation
Study Characteristics
Five studies examined the effectiveness of kidney transplantation in a study cohort with ESRF that was HIV+ compared with an HIV− control cohort.(18-21;28) The characteristics of the studies are reported in Table 3. All studies were time period matched cohort studies. Other than Roland et al. (18), all of these studies were retrospective cohort studies and used data from large registry databases to obtain the HIV+ and HIV− cohorts. Roland et al. (18) used a mixed design, a retrospective HIV− cohort obtained from a registry database and a prospective HIV+ cohort from a single center. Two studies obtained data from the United Network for Organ Sharing (UNOS) national registry but over different time periods; one from 2004-2006 (20) and one from 1997-2004 (21). Two additional studies used data from the United States Organ Procurement and Transplantation Network (OPTN) again over different time periods with slight overlap. (18;28) The fifth study used the United States Kidney Data Systems (USKDS) database.(19) Sample sizes in the HIV+ cohorts ranged from 18 to 100 patients and in the HIV− cohorts from 38 to 68,657.
Table 3: Characteristics of renal transplantation studies.
| Author/Year, Study Design, Country | Time Period HIV+ |
Time Period HIV− |
N HIV+ |
N HIV− |
Inclusion Criteria | Baseline Differences, HIV+ vs. HIV− (Mean ± SD) |
Follow up | Other |
|---|---|---|---|---|---|---|---|---|
| Locke, 2009 Retrospective Time period matched cohort USA |
Jan 2004 - June 2006 Data from United Network for Organ Sharing national registry |
Jan 2004 - Jun 2006 Data from United Network for Organ Sharing (UNOS) national registry |
100 | 36,492 | Both cohorts:
|
|
12 months (mean) |
|
| Roland, 2008 Mixed direction (retrospective and prospective) time period match cohort USA |
Mar 2000 - Sep 2003 Prospective cohort, single centre. |
1999 - 2002 Data from Organ Procurement and Transplantation Network (OPTN) database |
18 10/18 (56%) with hypertension 2/18 (11%) with diabetes 7/18 (39%) with HIVAN |
Not reported | HIV+ cohort:
|
Median: 4.0 yrs. IQR 3.0 - 5.7 |
|
|
| Qui, 2006 Retrospective Time period matched cohort USA |
1997 - 2004 United Network for Organ Sharing (UNOS) national registry |
1997 - 2004 United Network for Organ Sharing (UNOS) national registry |
38 HIV+/HCV+ 28.9% |
38 HIV−/HCV+ 31.6% |
|
|
5-years | |
| Abbott, 2004 Retrospective Time period matched cohort USA |
Jan 1996 - May 2001 United States Kidney Data Systems (USKDS) data |
Jan 1996 - May 2001 United States Kidney Data Systems (USKDS) data |
47 | 27,851 |
|
|
Mean: HIV+ 2.62 ±1.32 HIV−2.99 ±1.5 yrs. |
|
| Pelletier, 2004 Retrospective Time period matched cohort USA |
Jan 1996 - Apr 2003 Organ Procurement and Transplantation Network (OPTN)/Scientific Registry of Transplant Recipients (SRTR) |
Jan 1996 - Apr 2003 Organ Procurement and Transplantation Network (OPTN)/Scientific Registry of Transplant Recipients (SRTR) |
100 | 68,657 |
|
|
1 year |
Table 4 reports the baseline characteristics of the study cohorts. Limited baseline information was provided for the HIV− cohort in all studies with only three studies reporting comparative differences in baseline characteristics between the HIV + and HIV− cohorts. (19-21) Age, either median or mean, was reported for the HIV+ and HIV− cohorts in all studies except that completed by Roland et al. (18) In general, the HIV+ study cohort population was in their fourth decade whereas the HIV− study cohort was in the fourth and fifth decade. The baseline (pre-transplant) CD4+ T-cell count and HIV-RNA viral load was reported in only one study. (18) Deceased donors, age 33 to 41 years were the source of organ procurement for the majority of study cohort populations both HIV+ and HIV−. Pelletier et al. reported the baseline characteristics of the pre-HAART and HAART era population together. (28)
Table 4: Renal transplantation baseline study population characteristics.
| Study, year | Group | Recipient Age, Years Mean ± SD (median, range) | Median CD4+ Count, cells/mm3 | Mean HIV-RNA copies/ml | Hepatitis C (% of study cohort) | Type of Donor % of cohort | Donor Age, Years Mean ± SD (median) |
|---|---|---|---|---|---|---|---|
| Locke, 2009 | HIV + HIV - |
(48) (50) |
NR NA |
NR NA |
28 4.1 |
66 DD 34 LD 59.2 DD 40.8 LD |
(39) (41) |
| Roland, 2008 | HIV+ HIV− |
(44) Not Reported |
439 NA |
All <50 NA |
55 NR |
56 DD 44 LD NR |
NR NR |
| Qui, 2006 | HIV+ HIV− |
49.0 52.3 |
NR NA |
NR NA |
NR NR |
100 DD 100 DD |
NR NR |
| Abbott, 2004 | HIV+ HIV− |
48.2 ± 10.6 47.2 ± 12.6 |
NR NA |
NR NA |
NR NR |
100 DD 100 DD |
33 ± 16.6 35.2 ± 17.1 |
| *Pelletier, 2004 | HIV+ HIV− |
45.2 ± 1.2 DD 39.6 ± 1.6LD 44.8 ± 0.1DD 39.6 ± 0.1LD |
NR NA |
NR NA |
NR NR |
64 DD 36 LD 66.5 DD 33.5 LD |
33.5 ± 1.7 DD 37.5 ± 1.4 LD 33.9 ± 0.1 DD 39.8 ± 0.1 LD |
DD= Deceased Donor; LD= Living Donor; NA=not applicable; NR=not reported;
Data represents cohort from October 1987-July 2004 (includes pre-HAART era and HAART era population from the OPTN/SRTR database) Study did not report baseline characteristics of the HAART era cohort alone.
Results
Patient Survival
All five studies provided patient survival data between 1 and 5 years duration and reported a statistically non-significant difference in patient survival between the HIV+ and HIV− cohorts (Table 5). The studies by Locke et al.,(20) Roland et al, (18) and Pelletier et al., (28) reported a lower survival rate at 1-year in the HIV+ cohort compared with the HIV− cohort.(18;20;28) In contrast, Roland et al. (18) and Abbott et al. (19) reported a higher survival rate in the HIV+ cohort at 3-years compared with the HIV− cohort as did Qui et al. (21) at 5-years. Other than Abbott et al.(19), none of the studies reported a HR for survival. Abbott et al., (19) reported a statistically non significant adjusted HR of 0.36, 95% CI 0.05, 2.53 for survival in the HIV+ cohort compared with the HIV− cohort. (19) At 1-year the rate of survival in the HIV+ cohort ranged from 93%-95%, and at 3-years from 89%-96%. Survival rates in the HIV− cohort at 1-year were 96%, and ranged from 87% to 91% at 3 years.
Table 5: Kidney transplant patient survival data.
| Study/Year | HIV+ n |
HIV− n |
1-year | 3-year | 5-year | Log-rank test P<value |
|||
|---|---|---|---|---|---|---|---|---|---|
| HIV+ % |
HIV− % |
HIV+ % |
HIV− % |
HIV+ % |
HIV− % |
||||
| Locke, 2009 | 100 | 36,492 | 95.4 | 96.2 | .32 | ||||
| Roland, 2008 | 18 | NR | 95 | 96 | 95 | 91 | .34 | ||
| Qui, 2006 | 38 | 38 | 91.3 | 87.3 | .72 | ||||
| Abbott, 2004 | 47 | 27,851 | 95.7 | 87.2 | .15 | ||||
| Pelletier, 2004 | 100 | 68,657 | 93.1 | 95.6 | 89.4 | 90.3 | Not significant (p-value not reported) |
||
| Total | 303 | 133,038 | |||||||
Meta-analysis
The HR and 95% confidence interval for risk of death after kidney transplantation was computed for the HIV+ and HIV− cohorts using the methods described under statistical analysis. Four studies contributed to the meta-analysis.(19-21;28) Survival data from the study completed by Roland et al.(18) could not be used as it did not report the HIV− cohort sample size. Based on a pooled sample size in the HIV+ cohort of 285 patients compared with 133,038 patients in the HIV− cohort, the HR (random effects model) for risk of death after transplantation was 0.90 (95% CI: 0.36, 2.23). These results indicate that the risk of death does not differ after kidney transplantation between the HIV+ and HIV− cohorts. The Grade quality of this evidence is very low indicating the uncertainty in the estimates of effect (details in Appendix 2).
Death Censored Graft Survival
Death censored graft survival (DCGS) is conventionally calculated “from the date of transplantation to the date of irreversible graft failure signified by return to long-term dialysis (or re-transplantation) or the date of last follow up during the period when the transplant was still functioning. In the event of death with a functioning graft, the follow up period is censored at the date of death.”(30)
Only the studies by Locke et al. (20) and Roland et al.(18) reported the DCGS rates; however, Roland et al.(18) did not report the survival rates for the HIV− cohort and neither study explicitly reported how DCGS was defined (see Table 6). Abbott et al. (19) calculated graft survival from the date of transplant to return to dialysis but did not include death with a functioning graft in the graft survival rates. Qui et al. (21) and Pelletier et al. (28) did not define graft survival. Because of this lack of consistency in reporting and defining DCGS, a meta-analysis on this outcome could not be completed.
Table 6: Kidney transplant death censored graft survival and graft survival rates.
| Study/Year | HIV+ n |
HIV− n |
1-year | 3-year | 5-year | Log-rank test P<value | |||
|---|---|---|---|---|---|---|---|---|---|
| HIV+ % |
HIV− % |
HIV+ % |
HIV− % |
HIV+ % |
HIV− % |
||||
| *Locke 2009 | 100 | 36,492 | 87.9 ¶85.2 |
94.6 ¶94.1 |
.03 ¶.05 |
||||
| *Roland 2008 | 18 | NR | 88.9 †83.3 |
†91.9 |
88.9 †83.3 |
†82.4 |
Not reported †.18 |
||
| §Qui | 38 | 38 | 76.1 | 65.1 | .21 | ||||
| ‡Abbott 2004 | 47 | 27,851 | 97.9 | 93.2 | NR | ||||
| §Pelletier | 100 | 68,657 | 87 | 90.3 | 80.0 | 80.9 | Not significant (P-value not reported) |
||
DCGS
Graft survival (non-censored for death)
Included return to dialysis after transplantation and did not included death with a functioning graft
Unknown if DCGS or graft survival (non censored for death)
Results from matched control analysis, matched on multiple factors associated with graft loss.
Of note, Locke et al., (20) reported a statistically significant difference in DCGS between the HIV+ and HIV− cohorts. A lower rate of graft survival was reported in the HIV+ cohort compared with the HIV− cohort (87.9% vs. 94.6% respectively, P=0.03). Patient survival rates were, however, not significantly different among cohorts (Table 5). It is unknown whether the lower DCGS rates signified a return to dialysis in the HIV+ cohort more so than the HIV− cohort, which may have been a contributing factor in the similarity of patient survival rates between cohorts. An attempt was made to contact the study author to clarify this, but was unsuccessful. As displayed in Table 7 and Figure 1, Abbott et al. (19) reported a higher but non-statistically significant rate of return to dialysis in the HIV− cohort over the HIV+ cohort at 3-years (6.8% vs. 2.1% respectively; OR 0.30; 95% CI: 0.04, 2.16). As shown in Table 5 above, while the patient survival rate was lower in the HIV− cohort, it was not significantly different compared from the HIV+ cohort (87.2% vs. 95.7% respectively, p= 0.15). It is difficult to conclude from this to what extent, if any, that patient survival rates may be influenced by the return to dialysis after graft failure. The Grade quality of the DCGS evidence is very low indicating uncertainty in the estimate of effects (details in Appendix 2).
Table 7: Kidney transplantation return to dialysis rates.
| Author, Year | Return to Dialysis, n/N (%) | |
|---|---|---|
| HIV+ | HIV− | |
| Locke, 2009 | Not reported | Not reported |
| Roland 2008 | 4/18(22) | Not reported |
| Qui, 2006 | Not reported | Not reported |
| Abbott, 2004 | *1/47(2.1) | 1898/27,851(6.8) |
| Pelletier, 2004 | Not reported | Not reported |
Not significantly different compared with HIV− cohort (P=0.23)
Figure 1: Return to dialysis.

Disease Progression
Table 8 reports the rates of opportunistic infection in the study cohorts as well as the CD4+ T-cell counts and HIV-viral load post-operatively. In general, the opportunistic infection rates were not well reported in any study. None of the five studies reported the CD4+ T-cell count post kidney transplant, while the HIV viral load was reported by Roland et al. (18) to be detectable in 39% of the study HIV+ cohort after transplantation. The rate of opportunistic infection reported by Roland et al. (18) was 5.5%. It is difficult to conclude the effect of kidney transplantation on HIV disease progression from such sparse data. The Grade quality of this evidence is very low (details in Appendix 2).
Table 8: Kidney transplantation disease progression.
| Author, Year | Opportunistic Infection, n (%) | CD4+ Count (cells/mm3) | HIV Viral Load | |
|---|---|---|---|---|
| HIV+ | HIV− | HIV+ | HIV+ | |
| Locke 2009 | Not reported | Not reported | Not reported | Not reported |
| Roland 2008 | 1/18 (5.5%) Candida esophagitis |
Not reported | Not reported | 7/18 (39%) had detectable plasma RNA levels post-transplant |
| Qui 2006 | Not Reported | Not Reported | Not Reported | Not Reported |
| Abbott 2004 | Not reported | Not reported | Not reported | Not reported |
| Pelletier 2004 | Not reported | Not reported | Not reported | Not reported |
Cause of Death and Acute Graft Rejection
Table 9 reports the cause of death and rates of acute graft rejection for the HIV+ and HIV− kidney transplantation cohorts. There is sparse data reported for cause of death in the HIV− cohorts. Qui et al. (21) reported that infection was the cause of death in 2.6% of the HIV+ cohort and 5.3% of the HIV− cohort and that these rates were not statistically significantly different. Acute graft rejection for both cohorts was not well reported. Of the two studies that did report acute graft rejection, the rates ranged from 0% to 67% in the HIV+ cohort. (18;21) The OR for rate of acute graft rejection was determined using data from the study by Qui et al. (see Figure 2) The quality of evidence for acute graft rejection is very low.
Table 9: Kidney transplantation cause of death and acute graft rejection.
| Author, Year | Cause of Death | n | Acute Graft Rejection n/N (%) |
|
|---|---|---|---|---|
| (%) | ||||
| HIV+ | HIV− | HIV+ | HIV− | |
| Locke, 2009 | Not reported | Not reported | Not reported | Not reported |
| Roland 2008 | Pulmonary fibrosis n=1 Unknown cause 51 days following aortic valve replacement n=1 Congestive heart failure n=1 Complication of an MI in he setting of respiratory failure n=1 |
Not reported | 12/18 (67) | Not reported |
| Qui, 2006 | Bacterial pneumonia n=1 Gastrointestinal hemorrhage n=1 Respiratory failure n=2 |
Infection n=2 Other n=2 |
0/38 (0) | 3/38 (8.0) |
| Abbott, 2004 | Not reported | Not reported | Not reported | Not reported |
| Pelletier, 2004 | Not reported | Not reported | Not reported | Not reported |
Figure 2: Acute graft rejection.

Conclusion
Based on a pooled HIV+ cohort sample size of 285 patients from across four studies, the risk of death after kidney transplantation does not differ between HIV+ and HIV− cohorts (HR 0.90; 95% CI: 0.36, 2.23). The quality of evidence supporting this outcome, however, is very low.
Death censored graft survival was reported in one study with an HIV+ cohort sample size of 100, and was statistically significantly different (P=.03) to that of the HIV− cohort (n=36,492); but again, the quality of evidence supporting this outcome is very low. Similarly, there is uncertainty in the rate of return to dialysis after kidney transplantation in both the HIV+ and HIV− groups and the effect this has on patient survival rates, if any. Due to the limited quality of evidence, the effect of kidney transplantation on HIV-disease progression is uncertain.
\
The rate of acute graft rejection was determined using the data from one study.(21) There was an insignificant difference between cohort groups (OR 0.13, 95% CI: 0.01, 2.64), which was again based on very low quality evidence, leading to uncertainty in this estimate of effect.
Liver Transplantation
I) HIV+ cohort vs. HIV− Cohort
Study Characteristics
Six studies examined the effectiveness of liver transplantation among HIV+ and HIV− patients with end stage liver failure (ESLF). (6;17;18;24-26). All studies were time period matched cohort studies (the characteristics of each study are shown in Table 10). Three were retrospective (24-26), one was prospective (17), one was a mixed design (both prospective and retrospective)(18), and the last did not explicitly state whether it was retrospective or prospective but was assumed to be retrospective. (6) An attempt to contact the authors for clarification but was unsuccessful.
Table 10: Characteristics of liver transplantation studies among HIV+ and HIV− patients.
| Author/Year Study Design Country | Time Period HIV+ | Time Period HIV− | N HIV+ |
N HIV− |
Inclusion Criteria | Baseline Differences HIV+ vs. HIV− (Mean ± SD) |
Follow up |
|---|---|---|---|---|---|---|---|
| Mindikoglu, 2009 Retrospective time period matched cohort USA |
Jan 1997 - Oct 2006 The United Network for Organ Sharing (UNOS) national registry data |
Jan 1997 - Oct 2006 The United Network for Organ Sharing (UNOS) national registry data |
138 HIV+: 24/138 (17%) HIV+ with coinfection: 83/138 (60%) HIV+ and coinfection status unknown: 31/138 (22%) |
30,520 HIV−:13,536/30520 (44%) HIV− co-infected: 13,378/30520 (44%) HIV− unknown coinfection status: 3606/30520 (12%) |
|
|
HIV+
|
| Roland, 2008 Mixed direction (retrospective and prospective) time period match cohort USA |
Mar 2000 - Sep 2003 Prospective cohort |
1999 - 2002 Data from Organ Procurement and Transplantation Network (OPTN) database |
11 HIV/HCV: 6/11 (55%) HIV/HBV: 5/11 (45%) HCC: 2/11(8%) |
Not reported |
|
|
Median (IQR): 3.0 (2.0-4.4)
|
| DiBennedetto, 2008 Retrospective time period matched cohort Italy |
Jun 2003 - 2006 Single Centre |
Jun 2003 - 2006 Single Centre |
10 HIV/HCV: 5/10 (50%) HIV/HBV: 3/10 (30%) HIV/HCV/HBV: 2/10 (20%) HCC: 7/10 (70%) |
251 |
|
|
|
| Vennarecci, 2007 Prospective time period matched cohort Italy |
Sep 2002 - Apr 2006 Single Centre |
Sep 2002 - Apr 2006 Single Centre |
12 HIV/HCV: 10/12 HIV/HCV/HBV: 2/12 HCC: 2/12 |
Not Reported |
|
|
|
| Schreibman, 2007 Retrospective time period matched cohort USA |
Jan 1999 - May 2006 Single Center, University of Miami |
Jan 1999 - May 2006 Single Center, University of Miami |
15 HIV/HCV: 6/15 (40%) HIV/HBV: 5/15 (33%) HIV/HCV/HBV: 2/15(13%) |
857 |
|
|
|
| Ragni, 2003 Retrospective time period matched cohort USA/UK |
1997 - 2001 Multi-centered 10 patients Pittsburgh, Penn. USA: 6 patients Miami, FL, USA: 4 patients California, USA: 1 patient Minnesota, USA: 3 patients London, UK |
Jan 1997 - Dec 2001 United Network of Organ Sharing (UNOS) database |
24 | 5,225 |
|
|
|
Three of the studies reported data from single centre experiences.(6;17;26) One compared data from the United Network for Organ Sharing(UNOS) for both HIV+ and HIV− cohorts (24), and two compared data from either a single or multi-centre HIV+ cohort to an HIV− cohort obtained from a registry database, either the OPTN or the UNOS registry. (18;25) The liver transplantation evidence included studies from the USA and Europe.
In terms of sample size, Five of the studies had an HIV+ cohorts of less than 25 patients (6;17;18;25;26) with the sixth study having an HIV+ cohort of 138.(24) Sample sizes ranged between 113 and 30,520 in the HIV− cohorts. Of note, at least 50% of the HIV+ cohort in each study was co-infected with HCV. Limited baseline information was provided for the HIV− cohort in all studies with only one study reporting a comparison of baseline variables between the HIV+ and HIV− patients.(25) Two studies (18;26) included persons with a CD4+ T-cell count >100/mm3, the study by Venneracci et al. (17) included persons with CD4+ T-cell count >200/mm3, and that by Ragni et al. (25) included persons with any level of CD4+ T-cell count. The DiBennedetto et al. study (6) included person with a CD4+ T-cell count > 100/mm3 if they were taking HAART with proven efficiency but showed intolerance, and persons with CD4+ T-cell count >200/mm3 if they had never taken HAART or if they had taken HAART without intolerance.
Table 11 reports the baseline characteristics of the study cohorts. Other than the study by Mindikoglu et al. (24), age (either median or mean) was reported for the HIV+ cohort in all studies and ranged from 42 to 47 years. One study, that by Ragni et al. (25), reported the mean age of the HIV− control cohort group to be 49 years. The medium baseline CD4+ T-cell count was reported by four studies (6;18;25;26) and ranged from 188 to 326 cells/mm3. Five studies reported baseline HIV viral load.(6;18;24-26) The medium model for end-stage liver disease (MELD) score for the HIV+ cohort reported in two studies was 15.(25;26) In the DiBennedetto et al. study (6), the MELD score ranged from 12 to 28 in the HIV+ cohort. All six studies failed to report the MELD score for the HIV− cohort. The majority of donor organs were obtained from deceased donors and the age of the donor was not well reported among the studies.
Table 11: Liver transplantation baseline study population characteristics for HIV+ and HIV− patients.
| Study, year | Cohort | Recipient Age, Years Mean ± SD (median, IQR) |
CD4+ count Median Cells/mm3 |
HIV-RNA mean Copies/ml |
MELD Score | Type of Donor | Donor age (mean) |
|---|---|---|---|---|---|---|---|
| Mindikoglu, 2008 | HIV+ | NR | NR | Detectable at time of transplant in 21/138 (15.2%) Unknown in 91/138 (65.9%) Undetectable in 26/138 (18.8%) |
For both cohorts N=15,559 6-10 4.8% 11-15 11.6% 16-20 20.2% 21-25 30% 26-30 17.6% 31-35 7.6% 36-40 8.1% (MELD score not available for 48.9% of UNOS registry because MELD scoring system implemented only in February 2002. |
Deceased 95% Living 5% |
1-10 1.3% 11-20 17% 21-20 17.5% 31-40 15.5% 41-50 9.5% 51-60 16% 61-70 9.0% 71-80 3.6% 81-92 0.4% |
| HIV− | NR | NA | N/A | ||||
| Roland, 2008 | HIV+ | 46 (41-49) | (279) | Any detectable 2/11 (18%) |
NR | Deceased 8/11 (72.2%) |
NR |
| Range: <50 to 12,1128 | Living 3/11 (27.3%) |
||||||
| HIV− | NR | NA | NA | NR | NR | NR | |
| DiBenedetto, 2008 | HIV+ | Median: 44 (36-50 range) |
(267.36) | N=9 <50 N=1 101 |
Range 12-28 | Deceased | NR |
| All >100 (range 144-530) |
|||||||
| HIV− | NR | NA | NA | NR | NR | NR | |
| Vennarecci, 2007 | HIV+ | 42 | NR | NR | NR | NR | NR |
| HIV− | NR | NA | NA | NR | NR | NR | |
| Shreibman, 2007 | HIV+ | 47 | (326, range, 91-575) | Undetectable in n=12 Low counts (n=2) 141,000 n=1 |
Median 15 (8-39) | Deceased | NR |
| HIV− | NR | NA | NA | NR | NR | NR | |
| Ragni, 2003 | HIV+ | 44.3 (9.9) | (188, range 76-973) | <400 (<400-179,000) median, range | 15 (7-33) median, range | 23 deceased 1 living | NR |
| HIV− | 49.0 (9.0) | NA | NA | NR | NR | NR |
Results
Patient Survival
All five studies provided patient survival data of between 1 and 3 years in duration (Table 12). Two studies (17;24) reported a statistically significant difference in patient survival between the HIV+ and HIV− cohorts, while three reported a non-significant difference in this outcome between cohorts. (6;25;26) Mindikoglu et al. (24) used a Cox proportional hazards regression analysis controlling for age, MELD score, and several other pre-transplant recipient and donor predictors and reported that compared to non HIV patients, persons who were HIV+ had a statistically non-significant 40% increased risk of death post transplant (HR: 1.4; 95% CI: 0.90, 2.2).
Table 12: Liver transplantation-patient survival rates for HIV+ and HIV− patients.
| Study/Year | HIV+ % |
HIV− % |
1-year | 2-year | 3-year | Log-rank test P<value |
|||
|---|---|---|---|---|---|---|---|---|---|
| HIV+ % |
HIV− % |
HIV+ % |
HIV− % |
HIV+ % |
HIV− % |
||||
| *Mindikoglu 2008 | 138 | 30,520 | 70 | 81 | 66 | 77 | 0.05 | ||
| Roland 2008 | 11 | NR | 90.9 | 87.7 | 63.6 | 79.9 | Not reported | ||
| DiBenedetto 2008 | 10 | 251 | 64.8 | 76.2 | 0.21 | ||||
| Schreibman 2007 | 15 | 857 | 73.3 | 86.9 | 73.3 | 82.0 | 73.3 | 79.4 | 0.20 |
| Vennarecci 2007 | 11 | 113 | 83.3 | 58.3 | 58.3 | 85.8 | 0.03 | ||
| Ragni 2003 | 24 | 5225 | 87.1 | 86.6 | 72.8 | 81.6 | 72.8 | 77.9 | 0.36 |
| Total | 209 | 36,966 | |||||||
Hazard Ratio HIV+ compared with HIV− 1.4 (0.90, 2.2)
The HR was not reported for this variable in any of the other studies comprising this evidence. At 1-year the rate of survival in the HIV+ group ranged from 73%-91%, at 2 and 3 years from 58%-73% (Table 12). Survival rates in the HIV− cohort were approximately 87% at 1 year, from 81%-82% at 2 years, and ranged from 76%-86% at 3 years (see Table 12).
Meta-analysis
The HR and 95% CI for risk of death after liver transplantation was computed for HIV+ and HIV− cohorts using the methods previously described (five of the six studies contributed to the analysis). (6;17;24-26) Data from the study completed by Roland et al. (18) could not be used in the meta-analysis because the sample size of the HIV− cohort was not reported. Based on pooled sample sizes of 198 in the HIV+ cohort and 36,966 in the HIV− cohort derived from the five studies, the HR (fixed effects model) for risk of death was 1.64 (95% CI: 1.32, 2.02). These results indicate that there is a statistically significant 64% increased risk of death after liver transplantation in the HIV+ cohort compared with the HIV− cohort. The quality of this evidence is very low (details in Appendix 2).
Death Censored Graft Survival
Death censored graft survival is conventionally calculated from the date of transplantation to the date of irreversible graft failure signified by re-transplantation or the date of last follow up during the period when the transplant was still functioning. In the event of death with a functioning graft, the follow up period is censored at the date of death.
Table 13 reports the graft survival rates 1- and 3-years post liver transplantation. The study by Roland et al. (18) reported the DCGS rates for the HIV+ cohort but not for the HIV− negative cohort and, therefore, a comparison could not be made. DiBennedetto et al. (6) and Pelletier et al.(28) reported graft survival rates but it is unclear if this is DCGS. Because of the lack of consistency in reporting and defining DCGS, a meta-analysis on this outcome was not completed. It is difficult to conclude from these data the actual DCGS rates for either HIV+ or HIV− cohorts after liver transplantation. The quality of this evidence was thus again very low (Appendix 2).
Table 13: Liver transplantation graft survival rates for HIV+ and HIV− patients.
| Study/Year | HIV+ n |
HIV− n |
1-year | 3-year | Log-rank test P<value |
||
|---|---|---|---|---|---|---|---|
| HIV+ % |
HIV− % |
HIV+ % |
HIV− % |
||||
|
*Roland 2008 †Roland 2008 |
11 | Not reported | 81.8 81.8 |
83.4 |
81.8 63.6 |
73.7 |
|
| §DiBenetto 2008 | 10 | 277 | 54 | 66.6 | 0.25 | ||
| §Pelletier 2004 | 87 | 28,408 | 69.8 | 79.6 | NR | ||
DCGS
Graft survival (non-censored for death)
Unknown if DCGS or graft survival (non-censored for death)
Disease Progression
Table 14 reports the rates of opportunistic infection, CD4+ T-cell counts and HIV-viral load post operatively in the study cohorts. In general, the opportunistic infection rates were not well reported in either the HIV+ or HIV− cohorts. Schriebman et al., (26) reported a statistically significant difference in the proportion of persons who died due to infection in the HIV+ group (86%) compared with the HIV− group (26%)(P<.006).
Table 14: Liver transplantation disease progression among HIV+ and HIV− patients.
| Author, Year | Opportunistic Infection | CD4+ Count Cells/mm3 | HIV RNA Viral Load, n (%) | |
|---|---|---|---|---|
| HIV+ | HIV− | HIV+ | HIV+ | |
| Mindikoglu, 2008 | Not reported | Not reported | Not reported | Not reported |
| Roland, 2008 | CMV n=1 | Not reported | Not reported | 5/11 (45%) detectable |
| DiBenedetto, 2008 | 1/10 Systemic aspergillosis Kaposi Sarcoma 1/10 oral Candidosis 1/10 sepsis (all patients died and are reported in Table x causes of death) 1/10 (10%) Aspergillus fumigatus 1/10 (10%) Burkholderia coetacia 1/10 (10%) Pulmonary infection with Escherichia Coli |
Not Reported | 10/10 ≥ 200 | 7/10 (70) undetectable viral load post transplant 3/10 detectable |
| Schreibman, 2007 | Died of infection (any type) 4/15 (26.7%) P=0.006, log rank test compared with HIV− group. |
Died of infection (any type) n=70/857(8.2%) | Mean CD4+ count was 395 Range 7-1,202 Median 368 2/15(13.3%) had counts <100 (7 cells/mm3, and 52 cells/mm3 |
Low to undetectable levels were maintained in all patients 14/15(93.3%) undetectable after transplant 1/15(6.7%) 76 copies/ml after transplant |
| Vennarecci, 2007 | CMV 2/11(18.2%) Fungal esophogitis 1/11(9.1%) |
Not reported | All living and those with a reasonable follow up had CD4+ cell count increase after transplant (no other data reported) | All living and those who died with a reasonable follow up had low levels of HIV RNA (no other data reported) |
| Ragni, 2003 | See Table 20 | Not reported | 4/24(18.2%) CD4+ <200 | 2/24(8/3%) >400 |
Four studies reported the CD4+ T-cell count (6;17;25;26) and HIV viral load.(6;17;18;26) in the HIV+ cohort. Schriebman et al. (26) reported that 13% of the HIV+ cohort had a CD4+ count of less than 100 cells/mmm3 and Ragni et al. (25) reported that 18% had a count of less than 200 cells/mm3 post transplant. DiBennedetto et al. (6) reported that all persons in the HIV+ cohort (n=10) had a CD4+ T-cell count >200 cells/mm3 post operatively and Venneracci et al., (17) reported an increase in the CD4+ T-cell count in all persons with a reasonable follow up which was not defined.
From three studies (6;25;26) with a combined HIV+ cohort sample size of 49, there was an overall 12.2% (6/49) post-operative incidence rate of CD4+ T-cell counts <200. Four studies (6;18;25;26) with a combined HIV+ sample size of 60 reported an 18.3% (11/60) incidence in detectable HIV viral load post operatively. The incidence rate of opportunistic infection reported in three studies (6;17;18) with a combined HIV+ sample size of 39 was 20.5% (8/39).
Based on these data the CD4+ T-cell count and HIV viral load appear controlled post transplant and the incidence of opportunistic infection is 20.5%. The quality of this evidence is very low (see Appendix 2).
Cause of Death and Acute Graft Rejection,
Table 15 reports the cause of death and the rates of acute graft rejection among the HIV+ cohort of each study; these details were not reported for the HIV− cohort in any study. The rate of graft rejection in the HIV+ cohorts ranged from 9% to 40%. Overall, the quality of the acute graft rejection evidence was very low (see Appendix 2).
Table 15: Liver transplantation cause of death and acute graft rejection rates for HIV+ and HIV− patients.
| Author, Year | Cause of Death | Acute Graft Rejection Rates | ||
|---|---|---|---|---|
| HIV+ | HIV− | HIV+ | HIV+ | |
| Mindikoglu, 2008 | NR | NR | NR | NR |
| Roland, 2008 | CMV, liver failure n=1 Complications of recurrent HCV n= 2 Stenotrophomonasmaltophilia sepsis in the setting of recurrent HCV associated cirrhosis, n=1 Disseminiated recurrent hepatocellularcarinoma n=1 |
NR | 1/11 (9.1%) |
NR |
| DiBenedetto, 2008 | Sepsis and MOF n=1 Systemic aspergygillosis n=1 Cardiac tamponade n=1 |
NR | 2/10 (20%) |
NR |
| Schreibman, 2007 | Pseudomonas pneumonia and bacteremia, sepsis, multi organ system failure, n=1 Disseminated aspergillus: abscesses in the liver and lung, vancomycin-resistant enterococcus and Klebsiellabacteremia, sepsis n=1 E.colibacteremia, sepsis, Multi organ system failure, n=1 Vancomycin resistant enterococcus and Klebsiellabacterermia, sepsis n=1 Burkitt’s lymphoma n=1 |
NR | 6/15 (40%) |
NR |
| Vennarecci, 2007 | HCV recurrence and liver failure 1/11 massive intra and extrahepatic portal vein system thrombosis of unknown origin, n=3 PNF, n=1 Malignant lymphoma, n=1 |
NR | 1/11 (9.1%) |
NR |
NR=not reported
Conclusion
Based on an amalgamated HIV+ cohort sample of 198 patients from five studies, the risk of death after liver transplantation among these patients (with at least 50% of the cohort co-infected with HCV) is 64% greater (statistically significant) compared with HIV− patients (HR: 1.64; 95% CI: 1.32, 2.02). The quality of evidence supporting this outcome, however, is very low.
Death censored graft survival was reported in for the HIV+ cohort in one study (n=11), but the DCGS rate of the contemporaneous control HIV− cohort was not reported.(18) Because of the paucity of this data, the quality of evidence supporting this outcome is very low, indicating that death censored graft survival is still uncertain.
Both the CD4+ T-cell count and HIV viral load appear controlled post transplant and the incidence of opportunistic infection is 20.5%. However, the quality of this evidence for these outcomes is again very low, indicating uncertainty in these effects. Similarly, because of very low quality evidence there is uncertainty in the rate of acute graft rejection in both the HIV+ and HIV− groups.
II) The HIV+ / HCV+ Cohort versus the HCV+ Cohort
Study Characteristics
Seven studies specifically determined the effectiveness of liver transplantation in a cohort with ESLF who were co-infected with HIV and HCV (HIV+/HCV+) compared with an HCV mono-infected (HCV+) cohort without HIV infection. (4;16;22-25;27) The characteristics of these studies are reported in Table 16. All studies were time period matched cohort studies with five (22-25;27) being retrospective study designs, one a as a case control study (16), and the last, that by Norris et al. (4), did not describe the direction of inquiry but assumed to be retrospective. Our attempts to clarify the direction of inquiry with these authors were unsuccessful.
Table 16: Liver transplantation baseline study population characteristics for HIV+/HCV+ and HCV+ patients.
| Author/Year Study Design Country | Time Period HIV+/HCV+ | Time Period HCV+ | N HIV+/HCV+ |
N HCV+ |
Inclusion Criteria | Baseline Differences HIV+/HCV+ vs. HCV+ | Follow up |
|---|---|---|---|---|---|---|---|
| Testillano, 2009 Retrospective time period matched cohort Spain |
Oct 2003 - Apr 2007 Single Centre |
Oct 2003 - Apr 2007 Single Centre |
12 | 59 |
|
|
|
| Duclos-Vallee, 2008 Retrospective time period matched cohort France |
Jan 1999 - Oct 2005 Single Centre |
Jan 1999 - Oct 2005 Single Centre |
35 | 44 |
|
Post Transplant chemotherapy: 0% vs.16% (p=0.013) MELD Score: 18.8 ± 7.4 vs. 14.8 ± 4.7 (p=0.008) |
|
| Mindikoglu, 2009 Retrospective time period matched cohort USA |
Jan 1997 - Oct 2006 The United Network for Organ Sharing (UNOS) registry data |
Jan 1997 - Oct 2006 The United Network for Organ Sharing (UNOS) registry data |
59 | 11,637 |
|
|
|
| Castells, 2007 Case control study Spain |
Oct 2002 - Jul 2005 Single Centre |
Oct 2002 - July 2005 Single Centre |
9 | 18 |
|
|
|
| de Vera, 2006 Retrospective time period matched cohort USA |
Sep 1997- Aug 2005 Single Centre |
Jan 1997- Dec 2005 Single Centre |
27 3/27 also had HCC |
54 |
|
|
|
| Norris, 2004 Retrospective time period matched cohort UK |
1995 - Apr 2003 Single Centre |
1995 - Apr 2003 Single Centre |
7 | 182 |
|
|
|
| Ragni, 2003 Retrospective time period matched cohort USA/UK |
1997 - 2001 Not reported which co-infected done at which sites See table 9 for a list of centres. |
Jan 1997 - Dec 2001 United Network of Organ Sharing (UNOS) database |
15 | 4,062 |
|
|
|
The study by Castells et al. (16) is described as a case control design comparing each co-infected study patient with the mono-infected patient transplanted before and after – but it was unclear if this was prospective or retrospective in nature. Five studies reported data each from single centre experiences (16;22;23;27;31), one compared cohort data obtained from the UNOS registry (24), and one compared a co-infected cohort obtained from multiple centres in the USA and UK to a mono-infected cohort obtained from the UNOS database. (25)
The sample sizes in the co-infected cohorts ranged from 12 to 59 patients while that of the mono-infected cohorts ranged from 18 to 4,062 patients. Baseline characteristics were compared between cohorts in five of the seven studies.(16;22;23;25;27) In three studies (16;23;27), the co-infected cohort was significantly younger than the mono-infected cohort. Duclos-Vallee et al. (23) reported a statistically significant higher MELD score in the co-infected cohort (n=35) compared to the mono infected cohort (n=44).
Table 17 reports the baseline characteristics of the study cohorts of each study.
Table 17: Liver transplantation baseline study population characteristics for HIV+/HCV+ and HCV+ patients.
| Study, year | Cohort | Recipient Age, Yr Mean ± SD | CD4+ count Cells/mm3 | HIV-RNA mean copies/ml |
MELD Score mean | Type of Donor | Donor age (mean) |
|---|---|---|---|---|---|---|---|
| Testillano, 2009 | HIV/HCV | 45.2 ± 6.5 | NR | 800,000 UI/ml 5/12 (42%) |
14.3 ± 5.1 | NR | 56.6±4 |
| HCV | 55.1± 9.2 | NA | NA | 13.2 ± 4.5 | NR | 48±17 | |
| Duclos-Vallee, 2008 | HIV/HCV | 43.2 ± 5.9 | >100 | Undetectable viral load when placed on waiting list | 18.8 ± 7.4 | 13/35 domino liver graft 4/35 partial liver graftliving donor 18 deceased donor |
48.4±14 |
| HCV | 55.3 ± 8.3 | NA | NA | 14.8 ± 4.7 | 5/44 domino liver graft 5/44 partial liver graft from living donor 34 DD |
48±14.6 | |
| Mindikoglu, 2008 Data not reported for these subgroups |
HIV/HCV | NR | NR | NR | NR | NR | NR |
| HCV | NR | NA | NA | NR | NR | NR | |
| Castells, 2007 | HIV/HCV | 40.0±7 | NR | NR | 18±4 | NR | 48.2±11 |
| HCV | 58.2±9 | n/a | n/a | NR | NR | 52.7±17 | |
| de Vera, 2006 | HIV/HCV | 45 ± 7.7 | NR | 19.0 ± 7.9 | 1 live donor 26 DD |
41.2±14.5 | |
| HCV | NR | 47.2± 6 | n/a | 19.2 ±8 | n/a | 42.8±16.3 | |
| Norris, 2004 | HIV/HCV | 39.3 (mean) | 339.7 (mean) | <50 in n=3 150 n=1 965 n=1 n/a n=2 |
NR | NR | NR |
| HCV | NR | n/a | n/a | NR | NR | NR | |
| Ragni, 2003 Data not reported for these sub groups |
HIV/HCV | NR | NR | NR | NR | NR | NR |
| HIV | NR | NA | NA | NR | NR | NR |
NA= not applicable; NR=Not reported; DD =deceased donor
Results
Patient Survival
All seven studies provided patient survival data of between 1 and 5 years in duration (see Table 18). Two studies, those by Duclos-Vallee et al.(23) and Mindinkoglu et al. (24), reported a statistically significant difference in patient survival between the co-infected and mono- infected cohorts, four studies reported nonsignificant differences between cohorts (16;22;25;27), and one study (by Norris et al.) did not report the log-rank p-value for the Kaplan-Meier survival analysis. (4) Using a Cox proportional hazards regression analysis, Duclos-Vallee et al.(23) found that compared to the mono-infected patients, co-infected patients had a statistically non-significant 91% increased risk of death post transplant (HR1.91; 95% CI: 0.7, 5.18). The HR was not reported for this variable in any of the other studies comprising this evidence. As shown in Table 18, at 1-year, the rate of survival in the co-infected cohort ranged from 57% to 83%, at 2-years from 29% to 75%, at 3 years from 56% to 88%, and at 5-years from 0% to 51%. Survival rates in the mono-infected cohort ranged in the first year from 77% to 98%, at 2-years from 79% to 91%, at 3-years from 72% to 94%, and at 5-years from 69% to 81%.
Table 18: Liver transplantation patient survival for HIV+/HCV+ and HCV+ patients.
| Study, Year | HIV/HCV n |
HCV n |
1-year | 2-year | 3-year | 5-year | Log-rank test P<value |
||||
|---|---|---|---|---|---|---|---|---|---|---|---|
| HIV+/HCV+ % |
HCV+ % |
HIV+/HCV+ % |
HCV+ % |
HIV+/HCV+ % |
HCV+ % |
HIV+/HCV+ % |
HCV+ % |
||||
| Testillano, 2009 | 12 | 59 | 83 | 98 | 75 | 89 | 62 | 84 | .090 | ||
| Duclos-Vallee, 2008 | 35 | 44 | 73 | 91 | 51 | 81 | .004 | ||||
| Mindikoglu, 2008 | 58 | 11,637 | 52 | 79 | .006 | ||||||
| Castells, 2007 | 9 | 18 | 87.5 | 93.7 | .862 | ||||||
| DeVera, 2006 | 27 | 54 | 66.7 | 75.7 | 55.6 | 71.6 | 33.3 | 71.6 | .070 | ||
| Norris, 2004 | 7 | 182 | 57.1 | 87.5 | 28.6 | 83.9 | Not reported | ||||
| Ragni, 2003 | 15 | 4062 | 80 | 86.5 | 56.9 | 80.8 | 56.9 | 77.0 | 0 | 69.1 | .058 |
| Total | 156 | 16,056 | |||||||||
Meta-analysis
The HR and 95% CI for risk of death after liver transplantation was computed for HIV+/HCV+ patients compared with HIV−/HCV+ patients using the methods previously described. Based on a pooled study sample size of 156 persons in the HIV+ cohort compared with 16,056 in the HIV− cohort, the HR (random effects model) for risk of death was estimated to be 2.81 (95% CI: 1.47, 5.37). These results indicate that the risk of death after liver transplantation is 2.8 times greater in the co-infected cohort compared with the mono-infected cohort. The quality of this evidence, however, was found to be very low (see Appendix 2).
Death Censored Graft Survival
Death censored graft survival is conventionally calculated from the date of transplantation to the date of irreversible graft failure signified by re-transplantation or the date of last follow up during the period when the transplant was still functioning. In the event of death with a functioning graft, the follow up period is censored at the date of death. Table 19 displays the graft survival rates at 1, 3, and 5-years post liver transplantation. None of the studies reported DCGS. Only the study by DeVera et al.(22) reported graft survival, which was calculated from the date of transplantation to re-transplantation or death. Because of the paucity of this data, the rate of DCGS in a co-infected cohort compared with a mono-infected cohort is uncertain. The quality of the evidence for DCGS after liver transplantation in a co-infected population is very low.
Table 19: Liver transplantation graft survival rates for HIV+/HCV+ and HCV+ patients.
| Study, Year | HIV+/HCV+ n |
HCV+ n |
1-year | 3-year | 5-year | Log-rank test P<value |
|||
|---|---|---|---|---|---|---|---|---|---|
| HIV+/HCV+ % |
HCV+ % |
HIV+/HCV+ % |
HCV+ % |
HIV+/HCV+ % |
HCV+ % |
||||
| *DeVera, 2006 | 27 | 54 | 63 | 68.2 | 51.9 | 64.1 | 31.1 | 64.1 | 0.21 |
Graft survival (non-censored for graft death) calculated from the date of transplantation to re-transplantation or death of patient.
Disease Progression
In general, opportunistic infection rates were not well reported for either the HIV+ or HIV− patients with only three studies (16;23;27) reporting the rate for both cohorts. Testillano et al. (27) reported cytomegalovirus (CMV) in 8% of the co-infected cohort and in 7% of the mono-infected cohort. Duclos-Vallee et al. (23) reported that 5.7% of the co-infected cohort experienced opportunistic infection versus 13.6% of the mono-infected group. When bacteremia is added, the infection rate rose to 14.2% in the co-infected cohort and 50% in the mono-infected cohort. Lastly, Castells et al. (16) found no difference in bacterial, fungal, or viral infection rates between the co- and mono-infected cohorts, however, their sample sizes were small (9 and 18 respectively).
As detailed in Table 20, three of the seven studies reported data on CD4+ T-cell count and HIV viral load post-operatively. (16;22;23) Based on a combined HIV+/HCV+ cohort sample size of 89 persons across four studies, the post-operative incidence rate of opportunistic infection was 5.6% (5/89). (22;23;25;27) Based on a combined HIV+/HCV+ sample size of 71 patients from three studies (16;22;23), the incidence of CD4+ T-Cell counts of less than 200 counts/mm3 is 9.9% (7/71). The post-operative incidence of a detectable HIV-viral load was also found to be 9.9% (7/71) from the same three studies. (16;22;23) Overall, the incidence of opportunistic infection was low with the CD4+ T-cell count and HIV viral load appearing to be controlled post-transplant. The quality of this evidence, however, was very low (details in Appendix 2).
Table 20: Disease progression for HIV+/HCV+ and HCV+ patients.
| Author, Year | Opportunistic Infection | CD4+ Count cells/mm3 | HIV Viral Load copies/ml | |
|---|---|---|---|---|
| HIV+/HCV+ | HCV+ | HIV+/HCV+ | HIV+/HCV+ | |
| Testillano, 2009 | CMV 1/12(8%) | CMV 4/59(7%) | Not reported | Not reported |
| Duclos-Vallee, 2008 |
|
|
<150 4/35 (11.4%) <100 3/35 (8.6%) |
HIV RNA reappeared in 5 patients because of temporary withdrawal of HAART |
| Mindikoglu, 2008 |
|
|
Not reported | Not reported |
| DeVera, 2006 |
|
|
Mean CD4 count was 256.2 All patients maintained CD4 >200 |
2/27 (7.4%) had positive HIV viral load post transplan |
| Castells, 2007 |
|
|
>200 cells/mm3 in all cases No evidence of HIV infection progression |
Remained negative in all patients after transplant |
| Norris, 2004 |
|
|
Not reported | Not reported |
| Ragni, 2003 |
|
|
Not reported | Not reported |
Cause of Death, Graft Rejection, and Recurrence of HCV
Table 21 reports the cause of death, graft rejection and recurrence rates of HCV+ (Duclos-Vallee et al. reported the cause of death for both cohorts). (23) Acute graft rejection rates were reported for both HIV+ and HIV− cohorts in four studies (16;22;23;27), while rates of recurrence of HCV were reported in three. (16;23;27) Data for these outcomes were pooled and are reported below.
Table 21: Liver transplantation cause of death, graft rejection rates and recurrence of HCV.
| Author, Year | Cause of Death | Acute Graft Rejection Rates | Recurrence of HCV | |||
|---|---|---|---|---|---|---|
| HIV/HCV | HCV | HIV/HCV | HCV | HIV/HCV | HCV | |
| Testillano, 2009 |
|
Recurrent HCV: n = 3 Not reported: n = 5 |
3/12 (25%) | 8/59 (14%) | 29/59 (49%) P-value: 0.75 |
7/12 (58%) |
| Duclos-Vallee, 2008 |
|
Recurrent HCV cirrhosis: n = 2 Veno-occlusive disease, chronic rejection and severe recurrent hepatitis C: n = 1 Recurrent hepatocellular carcinoma: n = 2 Sepsis: n = 2 Cardiovascular causes: n = 2 |
11/35 (31%) Histologically proven acute rejection P-value: Not significant |
12/44(27%) | 5/35 (14.2%) |
3/44 (6.8%) |
| Mindikoglu, 2008 |
|
NR | NR | NR | NR | NR |
| Castells, 2007 |
|
NR | 4/9 (44%) Acute rejection Not significant different |
4/18 (22%) Acute rejection |
8/8 (100%) P-value: 0.4 |
14/17 (82.3%) |
| Norris, 2004 |
|
NR | 2/7 (28.6%) | NR | 4/7 (57.1%) |
|
| Ragni, 2003 |
|
NR | NR | NR | 7/15 | |
| DeVera, 2006 |
|
NR | 10/27 (37%) (acute cellular rejection) |
28/54 (51.9%) |
19/27 (70.4%) 15/27(56%) treated for HCV recurrence. |
|
Meta-analysis
Acute Graft Rejection
Four studies contributed data to the meta-analysis of acute graft rejection rates (Figure 3). (16;22;23;27) The risk of rejection did not differ between the HIV+/HCV+ and HCV+ cohorts. There is minimal statistical heterogeneity (I2=25%). The quality of this evidence is very low (Appendix 2).
Figure 3: Acute Graft Rejection.

Recurrence of HCV
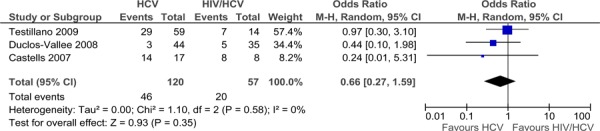
Three studies contributed data to the meta-analysis of recurrence of HCV infection (Figure 4). (16;23;27) The risk of HCV recurrence did not differ among the HIV+/HCV+ and HCV+ cohorts. There is no statistical heterogeneity (I2=0%). The quality of this evidence is very low (Appendix 2).
Figure 4: Recurrence of HCV.
Conclusion
Based on a combined HIV+/HCV+ cohort sample size of 156 from across seven studies, the risk of death after liver transplantation is 2.8 fold greater (statistically significant) in the HIV+/HCV+ co-infected cohort compared with the HCV+ mono-infected cohort (HR: 2.81; 95% CI: 1.47, 5.37). The quality of evidence supporting this outcome is very low. Evidence for death censored graft survival was not, however, available.
Regarding disease progression, based on a combined sample size of 71 HIV+/HCV+ persons, the CD4+T-cell count and HIV viral load appear controlled post transplant – but again the quality of evidence supporting this outcome is very low. The rate of opportunistic infection in the co-infected cohort was 5.6%, also with very low quality supporting evidence.
Based on a combined HIV+/HCV+ co-infected cohort (n=83) from four studies, the rate of acute graft rejection does not differ compared with an HCV+ mono-infected cohort (HR: 0.88; 95% CI: 0.44, 1.76). The quality of the evidence supporting this effect was very low.
Based on a combined HIV+/HCV+ co-infected cohort of 57 patients, the rate of HCV recurrence does not differ compared to that of HCV+ mono-infected patients (HR: 0.66; 95% CI: 0.27, 1.59). The quality of the evidence supporting this effect was very low.
Summary of Findings
Tables 22 to 29 display a summary of the findings and quality of evidence ratings for the outcomes evaluated in this report. Of note within these tables:
Table 22: Risk of Death.
| Comparison | Number of studies | HIV + Cohort, n | Control Cohort, n | Risk of Death HR (95% CI) | Quality of Evidence |
|---|---|---|---|---|---|
| Kidney HIV+ vs. HIV− | 4 | 285 | 133,038 | *0.90 (0.36, 2.23) | Very Low |
| Liver HIV+ vs. HIV− | 5 | 198 | 36,966 | †1.64 (1.32, 2.02) | Very low |
| Liver HIV+/HCV+ vs. HCV+ | 7 | 156 | 16,056 | *2.81 (1.47, 5.37) | Very Low |
Random Effects Model
Fixed Effects Model
Table 29: HCV recurrence.
| Comparison | Number of studies | HIV+/HCV+ Cohort (n) | HCV+ Cohort (n) | OR (95% CI) | Quality of Evidence |
|---|---|---|---|---|---|
| Liver HIV+/HCV+ vs. HCV+ | 3 | 57 | 120 | *0.66 (0.27, 1.59) | Low |
Random effects model
A pooled estimate of effect was derived for risk of death after transplantation in the HIV+ cohort compared with the HIV− cohort (Table 22). The quality of evidence is very low for both kidney and liver transplantation, meaning these estimates of effect are uncertain
There is sparse and very low quality evidence to evaluate the outcome of DCGS for both kidney and liver transplantation and therefore an estimate of effect is uncertain (Table 23).
The findings for disease progression post-transplantation are reported in Tables 24 to 26. Disease progression was assessed using three parameters, incidence of opportunistic infection, a CD4+ T-Cell count of less than 200/mm3, and ‘any detectable HIV-viral load’. The quality of evidence for all three parameters for both kidney and liver transplantation was again very low, meaning that the estimate of effect is uncertain.
The summary of findings for return to dialysis at kidney transplantation is reported in Table 27. There was a non-statistically significant difference in rate of return to dialysis between the HIV + and HIV−cohorts; however, the quality of this evidence was very low and the estimate of effect uncertain.
A pooled estimate of effect for the rate of acute graft rejection for kidney and liver transplantations (co-infected compared with mono-infected HCV) is displayed in Table 28. A pooled estimate of effect of the rate of HCV recurrence is displayed in Table 29. The quality of evidence is very low for both outcomes in their respective populations indicating uncertainty in these estimates of effect.
Table 23: DCGS.
| Comparison | Number of studies | HIV+ Cohort, n | Control Cohort, n | Log-Rank p-value | Quality of Evidence |
|---|---|---|---|---|---|
| Kidney HIV+ vs. HIV− | 1 | 100 | 36,492 | P<0.03 | Very low |
| Liver HIV+ vs. HIV− | 1 | 11 | Not reported | Not reported | Very Low |
| Liver HIV+/HCV+ vs. HCV+ | 0 | n/a | n/a | N/A | n/a |
Table 24: Disease Progression, Opportunistic Infection.
| Cohort | Number of studies | n | Summary of Findings (Incidence, %) |
Quality of Evidence |
|---|---|---|---|---|
| Kidney HIV+ | 1 | 18 | 5.5 | Very low |
| Liver HIV+ | 3 | 39 | 20.5 | Very Low |
| Liver HIV+/HCV+ | 4 | 89 | 5.6 | Very Low |
Table 26: Disease Progression, HIV-viral load Any Detectable.
| Cohort | Number of studies | n | Summary of Findings (Incidence, %) |
Quality of Evidence |
|---|---|---|---|---|
| Kidney HIV+ | 1 | 18 | 39.0 | Very Low |
| Liver HIV+ | 4 | 60 | 18.3 | Very Low |
| Liver HIV+/HCV+ | 3 | 71 | 9.9 | Very Low |
Table 27: Return to dialysis,
| Comparison | Number of studies | HIV+ Cohort (n) | HIV− Cohort (n) | OR (95% CI) | Quality of evidence |
|---|---|---|---|---|---|
| Kidney HIV+ vs. HIV− | 1 | 47 | 27,851 | *0.3 (0.04, 2.16) | Very Low |
Fixed Effects model
Table 28: Acute graft rejection.
| Comparison | Number of studies | HIV + Cohort (n) | Control Cohort (n) | OR (95% CI) | Quality of Evidence |
|---|---|---|---|---|---|
| Kidney HIV+ vs. HIV− | 1 | 38 | 38 | *0.13 (0.01, 2.64) | Very Low |
| Liver HIV+ vs. HIV− | 4 | 47 | 1,221 |
|
Very Low |
| Liver HIV+/HCV+ vs. HCV+ | 4 | 83 | 175 | †0.88 (0.44, 1.76) | Very Low |
Fixed effects model
Random effects model
Overall, because of very low evidence quality, uncertainty remains in the effect of kidney and liver transplantation in persons with end stage organ failure and HIV infection.
Table 25: Disease Progression, CD4+ T-Cell Count <200counts/mm3.
| Cohort | Number of studies | n | Summary of Findings (Incidence, %) |
Quality of Evidence |
|---|---|---|---|---|
| Kidney HIV+ | 0 | n/a | n/a | n/a |
| Liver HIV+ | 3 | 49 | 12.2 | Very Low |
| Liver HIV+/HCV+ | 3 | 71 | 9.9 | Very Low |
Economic Analysis
Disclaimer: The Medical Advisory Secretariat uses a standardized costing method for its economic analyses of interventions. The main cost categories and the associated methods from the province’s perspective are as follows:
Hospital: Ontario Case Costing Initiative cost data are used for in-hospital stay, emergency visit and day procedure costs for the designated International Classification of Diseases (ICD) diagnosis codes and Canadian Classification of Health Interventions procedure codes. Adjustments may be required to reflect accuracy in estimated costs of the diagnoses and procedures under consideration. Due to the difficulties of estimating indirect costs in hospitals associated with a particular diagnosis or procedure, the secretariat normally defaults to considering direct treatment costs only.
Nonhospital: These include physician services costs obtained from the Ontario Schedule of Benefits, laboratory fees from the Ontario Schedule of Laboratory Fees, drug costs from the Ontario Drug Benefit Formulary, and device costs from the perspective of local health care institutions whenever possible or its manufacturer.
Discounting: For cost-effectiveness analyses, a discount rate of 5% is applied as recommended by economic guidelines.
Downstream costs: All numbers reported are based on assumptions on population trends (i.e. incidence, prevalence and mortality rates), time horizon, resource utilization, patient compliance, healthcare patterns, market trends (i.e. rates of intervention uptake or trends in current programs in place in the Province), and estimates on funding and prices. These may or may not be realized by the system or individual institutions and are often based on evidence from the medical literature, standard listing references and educated hypotheses from expert panels. In cases where a deviation from this standard is used, an explanation is offered as to the reasons, the assumptions, and the revised approach. The economic analysis represents an estimate only, based on the assumptions and costing methods that have been explicitly stated above. These estimates will change if different assumptions and costing methods are applied to the analysis.
Study Question
The objective of this project was to report the incremental cost of solid organ transplant in HIV+ patients.
Method
The two primary solid organ transplant outcomes are graft survival and patient survival. In the kidney transplant population, the clinical outcomes of HIV+ patients and HIV− patients are comparable, with the alternative being dialysis if clinical outcomes differed. In liver transplant population, there were differences in the clinical outcomes between HIV+ and HIV− patients and between HIV+/HCV+ and HCV+ patients, however, liver transplant remains the last line of treatment to improve survival. A cost-analysis was thus conducted to identify the incremental cost of solid organ transplant for HIV+ patients.
The target population of this economic analysis was HIV+ patients undergoing solid organ transplant and the primary analytic perspective was that of the Ministry of Health and Long-Term Care. To identify relevant evidence, a literature search (fully described in Appendix 1) was conducted using the following inclusion criteria:
full economic evaluations [cost-effectiveness analysis (CEA), cost-utility analysis (CUA), cost-benefit analysis (CBA)];
economic evaluations reporting Incremental Cost-Effectiveness Ratios (ICER) i.e. cost per quality adjusted life year (QALY)/life years gained (LYG) or cost per event avoided;
studies in patients with HIV;
studies reporting on solid organ transplant; and
studies in English
The search yielded no articles reporting Canadian costs in HIV+ patients undergoing solid organ transplant.
Resource Use and Costs
Costs associated with solid organ transplant in an HIV− patient population were obtained from the University Health Network (UHN) case costing initiative (personal communication, UHN, November 2009). Consultations with three clinical experts (a kidney transplant specialist, a liver transplant specialist and an HIV specialist) from the UHN in Toronto were also conducted to verify resource utilization. Costs associated with solid organ transplant in an HIV+ patient population were obtained from the experiences in California and Illinois, states where separate programs for solid organ transplant in HIV+ patients exist (personal communication, UHN, November 2009). The UHN has performed extensive work to identify the incremental costs in this patient population by investigating these programs and communicating with these experts in the field. Ontario does not have a separate program for HIV+ patients and has had limited experience with solid organ transplants in this population. The estimate from American experiences is, therefore, used here.
Table 30 outlines the hospital costs associated with solid organ transplant in both HIV− and HIV+ patient populations. The costs reported were based on average costs incurred at the hospital for 135 liver transplants and 136 kidney transplants in fiscal year (FY) 07/08, adjusted for FY 08/09, with an average length of stay (ALOS) of 28.7 days for liver and 14.5 days for kidney transplants, respectively (personal communication, UHN, November 2009). Of these cases, 13 kidney transplants (10% of the total) landed in the intensive care unit (ICU) with an ALOS of 4 days and 132 liver transplants (98% of the total) landed in ICU with an ALOS of 8 days (personal communication, UHN, November 2009).
Table 30: Resources associated with solid organ transplant in HIV+ and HIV− patients.
| Resource | Unit | Kidney | Liver | |
|---|---|---|---|---|
| Transplant costs | ||||
| Surgery & inpatient costs* | per case | $33,280 | $99,020 | |
| Ambulatory | per case | $8,950 | $10,520 | |
| Subtotal | per case | $42,230 | $109,540 | |
| Additional transplant costs in HIV+ patients | ||||
| Surgery & inpatient cost* | per case | $4,880 | $28,120 | |
| Ambulatory | per case | $7,280 | $8,050 | |
| HIV medication | per case/per month | $1,400 | $1,400 | |
| Subtotal | per case | $13,560 | $37,570 | |
| TOTAL | per case | $55,790 | $147,110 | |
Includes all direct costs incurred within the hospital such as allied health resources (multiple therapists), medical supplies, drugs, pharmacists, medical imaging and operating room costs. The cost to implement an HIV program will incur other resources not reported here.
The transplant costs also include the cost associated with hospital readmission due to post-transplant complications. There were 279 readmissions post kidney transplant with an ALOS of 10.4 days with 14 of these patients being admitted to the ICU for an ALOS of 9 days in FY 07/08 (personal communication, UHN, November 2009). There were 196 readmissions post liver transplant with an ALOS of 9 days with nine of the patients requiring admission to the ICU for an ALOS of 14 days in FY 07/08 (personal communication, UHN, November 2009).
Ambulatory costs include resources incurred from the pre-transplant workup and the post-transplant follow-up. Kidney pre-transplant work-up consists of a visit to the ambulatory department whereby medical imaging tests, laboratory work, serology, tissue typing, and a social worker consult are arranged. The first year of post-transplant follow-up consists of routine laboratory work occurring 33 times and eight visits to the transplant ambulatory clinic. After the first year post-transplant, routine laboratory work drops to six times per year and one annual visit to the transplant ambulatory clinic (personal communication, UHN, November 2009).
Liver pre-transplant work-up consists of a visit to the ambulatory department whereby medical imaging tests, bone density scan, liver biopsy, laboratory work, serology, and a social worker consult are arranged. The first year of post-transplant follow-up consists of routine laboratory work occurring 36 times, hepatitis serology four times, and 12 visits to the transplant ambulatory clinic. After the first year of post-transplant routine laboratory work drops to twice per year, hepatitis serology to 1 time per year and one annual visit to the transplant ambulatory clinic is required (personal communication, UHN, November 2009).
Within the HIV+ patient population surgery and inpatient costs due to solid organ transplant increase because of an increase in the ALOS within hospital and an increase in ICU time especially with liver transplant patients (personal communication, UHN, November 2009). Ambulatory costs include additional resources required post-transplant such as CD4 and viral tests as much as 15 times in the first year post-transplant and four times a year thereafter (personal communication, UHN, November 2009). HIV medication is also an additional resource within hospital when treating these patients (personal communication, UHN, November 2009).
Conclusion
For HIV+ patients, the average cost of a kidney transplant is $56,000 per case, while the average cost of a liver transplant is $147,000 per case, based on both Canadian and American experiences.
Appendix 1: Literature Search Strategies
Organ Transplantation in HIV
Search date: September 22, 2009
Databases searched: OVID MEDLINE, MEDLINE In-Process and Other Non-Indexed Citations, OVID EMBASE, Wiley Cochrane, Centre for Reviews and Dissemination/International Agency for Health Technology Assessment, EconLit
Database: Ovid MEDLINE(R) <1950 to September Week 2 2009>
Search Strategy:
exp HIV/ (64955)
exp HIV Infections/ (185795)
1 or 2 (210276)
exp Liver Transplantation/ (33890)
exp heart transplantation/ or exp lung transplantation/ (33274)
exp Kidney Transplantation/ (66273)
exp Pancreas Transplantation/ (5948)
((heart or cardiac or lung* or pulmonary or pancrea* or kidney* or renal or cardiopulmonary or liver) adj2 (transplant* or graft*)).ti,ab. (110602)
or/4-8 (149757)
3 and 9 (897)
((transplant* or graft*) adj3 (hiv or human immunodeficiency virus or acquired immune deficiency syndrome)).ti,ab. (503)
10 or 11 (1218)
limit 11 to (english language and humans and yr=“1996 -Current”) (353)
Database: EMBASE <1980 to 2009 Week 38>
Search Strategy:
exp human immunodeficiency virus/ (75716)
exp Human immunodeficiency virus infection/ (156518)
1 or 2 (190202)
exp liver graft/ (2477)
exp heart graft/ (2802)
exp kidney graft/ (5744)
exp lung transplantation/ (10174)
exp heart lung transplantation/ (1670)
exp pancreas transplantation/ (10264)
((heart or cardiac or lung* or pulmonary or pancrea* or kidney* or renal or cardiopulmonary or liver) adj2 (transplant* or graft*)).ti,ab. (97975)
or/4-10 (108589)
3 and 11 (959)
((transplant* or graft*) adj3 (hiv or human immunodeficiency virus or acquired immune deficiency syndrome)).ti,ab. (471)
12 or 13 (1290)
limit 14 to (human and english language and yr=“1996 -Current”) (851)
Economic literature search
Search date: October 22, 2009
Databases searched: OVID MEDLINE, MEDLINE In-Process and Other Non-Indexed Citations, OVID EMBASE, Wiley Cochrane, Centre for Reviews and Dissemination/International Agency for Health Technology Assessment
Database: Ovid MEDLINE(R) <1950 to October Week 3 2009>
Search Strategy:
exp HIV/ (65595)
exp HIV Infections/ (187235)
1 or 2 (211928)
exp Liver Transplantation/ (34124)
exp heart transplantation/ or exp lung transplantation/ (33497)
exp Kidney Transplantation/ (66640)
exp Pancreas Transplantation/ (5974)
((heart or cardiac or lung* or pulmonary or pancrea* or kidney* or renal or cardiopulmonary or liver) adj2 (transplant* or graft*)).ti,ab. (111393)
or/4-8 (150734)
3 and 9 (901)
((transplant* or graft*) adj3 (hiv or human immunodeficiency virus or acquired immune deficiency syndrome)).ti,ab. (507)
10 or 11 (1225)
limit 11 to (english language and humans and yr=“1996 -Current”) (356)
exp Economics/ (415902)
exp Models, Economic/ (6869)
exp Resource Allocation/ (13121)
exp “Value of Life”/ or exp “Quality of Life”/ (83678)
(econom$ or cost$ or budget$ or pharmacoeconomic$ or pharmaco-economic$ or valu$).ti. (185972)
ec.fs. (263342)
((cost$ adj benefit$) or costbenefit$ or (cost adj effective$) or costeffective$ or econometric$ or life value or quality-adjusted life year$ or quality adjusted life year$ or quality-adjusted life expectanc$ or quality adjusted life expectanc$ or sensitivity analys$ or “value of life” or “willingness to pay”).ti,ab. (61663)
or/14-20 (705428)
21 and 13 (20)
Database: EMBASE <1980 to 2009 Week 42>
Search Strategy:
exp HIV/ (76011)
exp HIV Infections/ (157257)
1 or 2 (191079)
exp Liver Transplantation/ (36923)
exp heart transplantation/ or exp lung transplantation/ (33371)
exp Kidney Transplantation/ (55116)
exp Pancreas Transplantation/ (10299)
((heart or cardiac or lung* or pulmonary or pancrea* or kidney* or renal or cardiopulmonary or liver) adj2 (transplant* or graft*)).ti,ab. (98449)
or/4-8 (138423)
3 and 9 (1458)
((transplant* or graft*) adj3 (hiv or human immunodeficiency virus or acquired immune deficiency syndrome)).ti,ab. (474)
10 or 11 (1761)
limit 11 to (english language and humans and yr=“1996 -Current”) (310)
exp human immunodeficiency virus/ (76011)
exp Human immunodeficiency virus infection/ (157257)
14 or 15 (191079)
exp liver graft/ (2506)
exp heart graft/ (2817)
exp kidney graft/ (5790)
exp lung transplantation/ (10229)
exp heart lung transplantation/ (1676)
exp pancreas transplantation/ (10299)
((heart or cardiac or lung* or pulmonary or pancrea* or kidney* or renal or cardiopulmonary or liver) adj2 (transplant* or graft*)).ti,ab. (98449)
or/17-23 (109125)
16 and 24 (971)
((transplant* or graft*) adj3 (hiv or human immunodeficiency virus or acquired immune deficiency syndrome)).ti,ab. (474)
25 or 26 (1303)
limit 27 to (human and english language and yr=“1996 -Current”) (863)
exp “Health Care Cost”/ (110343)
exp Health Economics/ (241774)
exp Resource Management/ (15154)
exp Economic Aspect/ or exp Economics/ or exp Quality Adjusted Life Year/ or exp Socioeconomics/ or exp Statistical Model/ or exp “Quality of Life”/ (506810)
(econom$ or cost$ or budget$ or pharmacoeconomic$ or pharmaco-economic$ or valu$).ti. (112211)
or/29-33 (566120)
limit 34 to (english language and yr=“1996 -Current”) (393794)
35 and 27 (91)
Appendix 2: GRADE Evidence Tables
Table A1: Kidney transplantation for ESRF among HIV+ and HIV− patients.
| Quality assessment | Summary of findings | Importance | |||||||||
|---|---|---|---|---|---|---|---|---|---|---|---|
| No of patients | Effect | Quality | |||||||||
| No of studies | Design | Limitations | Inconsistency | Indirectness | Imprecision | Other | HIV+ | HIV− | Relative (95% CI) | ||
| Risk of Death after Kidney Transplant (follow-up 1-5 years) | |||||||||||
| 4 | Observational studies | Serious1 | Serious2 | No Serious indirectness | No serious imprecision | None | 303 | 133,038 | HR 0.90 (0.36 to 2.23) |
VERY LOW | CRITICAL |
| Death Censored Graft Function (follow-up mean 1) | |||||||||||
| 1 | Observational studies | Serious1 | No serious inconsistency | No serious indirectness | Serious3 | None | 85/100 (85.2%) | 34,339/36,492 (94.1%) | VERY LOW | IMPORTANT | |
| Disease Progression, CD4 counts, HIV−RNA viral load, OI (follow-up median 4; Better indicated by lower values) | |||||||||||
| 1 | Observational studies | Serious1 | No serious inconsistency | No serious indirectness | Serious4 | None | 18 | N/A | See foot- note 5 | VERY LOW | IMPORTANT |
| Acute Graft Rejection (follow-up 5 years) | |||||||||||
| 1 | Observational studies | Serious1 | No serious inconsistency | No serious indirectness | Serious6 | None | 0/38 (0%) | 3/38 (8%) | OR 0.13 (0.01, 2.64) |
VERY LOW | IMPORTANT |
| Return to Dialysis (follow-up 2.5-3 yrs) | |||||||||||
| 1 | Observational studies | Serious1 | No serious inconsistency | No serious indirectness | Serious7 | None | 1/47(2.1%) | 1,898/27,851 (6.8%) | OR 0.30 (0.04, 2.16) Fixed effect |
VERY LOW | IMPORTANT |
Retrospective
Large heterogeneity in HR estimates from each study
Sparse data, 1 study, sample size of 100 in HIV+ cohort (Locke, 2009)
Sparse data, 1 study, sample size of 18 in HIV+ cohort (Roland et al. 2008)
1 patient had candida esophagitis, CD4+ T-Cell counts post operatively not reported, 39% of HIV+ cohort had detectable plasma HIV-RNA levels post operatively
Sparse data, 1 study, sample size of 38 in the HIV+ cohort and 38 in the HIV− cohort. (Qui et al. 2006)
Sparse data. 1 study, sample size of 47 in HIV+ group and 27,851 in HIV− group (Abbott, 2004).
Table A2: Liver transplantation for ESLF among HIV+ and HIV− patients.
| Quality assessment | Summary of findings | Importance | |||||||||
|---|---|---|---|---|---|---|---|---|---|---|---|
| No of patients | Effect | Quality | |||||||||
| No of studies | Design | Limitations | Inconsistency | Indirectness | Imprecision | Other | HIV+ | HIV− | Relative (95% CI) | ||
| Risk of Death after liver transplantation (follow-up 1-2 years) | |||||||||||
| 5 | Observational studies | Serious1 | No serious inconsistency | No serious indirectness | No serious imprecision | None2 | 198 | 36966 | HR 1.6 (1.32 to 2.02) | VERY LOW | CRITICAL |
| Death Censored Graft survival (follow-up median 3 years) | |||||||||||
| 1 | Observational studies | Very serious1,3 | No serious inconsistency | No serious indirectness | Serious4 | None | 11 | Not reported | No data | VERY LOW | IMPORTANT |
| Disease Progression (follow-up median 3 years) | |||||||||||
| 4 | Observational studies | Serious1 | No serious inconsistency | No serious indirectness | Serious5 | None | 36 | N/A | See table 14 | VERY LOW | IMPORTANT |
| Acute Graft Rejection (follow-up median 3 years) | |||||||||||
| 4 | Observational studies | Serious1 | No serious inconsistency | No serious indirectness | Serious6 | None | 10/47 (21.2%) | No data | Cannot determine | VERY LOW | IMPORTANT |
Retrospective
Not considered a strong association
No DCGS rates given for HIV− control cohort
Sparse data, 1 study, HIV+ cohort sample size of 11 (Roland 2008)
Based on a combined HIV+ sample size of 36 in 4 studies (Roland 2008, Schreibman 2007, Vennarecci 2007, Ragni 2003)
Based on a combined HIV+ sample size of 47 in 4 studies (Roland 2008, DiBenedetto 2008, Schreibman 2007, Vennarecci 2007)
Table A3: Liver transplantation for ESLF among HIV+/HCV+ and HCV+ patients.
| Quality assessment | Summary of findings | Importance | |||||||||
|---|---|---|---|---|---|---|---|---|---|---|---|
| No of patients | Effect | Quality | |||||||||
| No of studies | Design | Limitations | Inconsistency | Indirectness | Imprecision | Other | HIV/HCV | HCV+ | Relative (95% CI) | ||
| Risk of Death after Liver Transplant (follow-up 2-5 years) | |||||||||||
| 7 | Observational studies | serious1 | serious2 | no serious indirectness | no serious imprecision | strong association3 | 156 | 16,056 | HR 2.81 (1.47 to 5.37) |
VERY LOW | CRITICAL |
| Death Censored Graft Function | |||||||||||
| 0 | no evidence available | none | N/A | N/A | N/A | VERY LOW | IMPORTANT | ||||
| Disease Progression | |||||||||||
| 3 | Observational studies | serious1 | no serious inconsistency | no serious indirectness | serious4 | none | 71 | N/A | See Table 20 | VERY LOW | IMPORTANT |
| HCV Recurrence | |||||||||||
| 3 | Observational studies | serious1 | no serious inconsistency | no serious indirectness | serious5 | none | 20/57 (35%) |
46/120 (38.3%) |
OR .66 (0.27, 1.59) |
VERY LOW | IMPORTANT |
| Acute Graft Rejection | |||||||||||
| 4 | Observational studies | serious1 | serious6 | no serious indirectness | serious7 | none | 28/83 (33.7%) |
52/0175 (29.7%) |
OR .88 (0.44, 1.760 |
VERY LOW | IMPORTANT |
Retrospective
Heterogeneity among HR estimates from individual studies
Large estimate of effect HR 2.8 (1.46, 5.39) based on consistent evidence from 2 or more observational studies.
Based on a combined HIV+ cohort sample size of 71 form 3 studies (Duclos-Vallee 2008, DeVera 2006, Casetells 2007)
Based on a combined HIV+ sample size of 57 compared with and HIV− cohort combined sample size of 120
Some inconsistency in direction of point estimate.
3 of the 4 studies have small sample size, Pooled effect estimate based on a combined HIV+ cohort sample size of 83 compared with a combined HIV− cohort sample size of 175.
Suggested Citation
This report should be cited as follows:
Medical Advisory Secretariat. Kidney and liver organ transplantation in persons with human immunodeficiency virus: an evidence-based analysis. Ont Health Technol Assess Ser [Internet]. 2010 Mar [cited YYYY MM DD]; 10(4) 1-56. Available from: http://www.health.gov.on.ca/english/providers/program/mas/tech/reviews/pdf/rev_organ_transplant_2010_0322.pdf
Permission Requests
All inquiries regarding permission to reproduce any content in the Ontario Health Technology Assessment Series should be directed to MASinfo.moh@ontario.ca.
How to Obtain Issues in the Ontario Health Technology Assessment Series
All reports in the Ontario Health Technology Assessment Series are freely available in PDF format at the following URL: www.health.gov.on.ca/ohtas.
Print copies can be obtained by contacting MASinfo.moh@ontario.ca.
Conflict of Interest Statement
All analyses in the Ontario Health Technology Assessment Series are impartial and subject to a systematic evidence-based assessment process. There are no competing interests or conflicts of interest to declare.
Peer Review
All Medical Advisory Secretariat analyses are subject to external expert peer review. Additionally, the public consultation process is also available to individuals wishing to comment on an analysis prior to finalization. For more information, please visit
http://www.health.gov.on.ca/english/providers/program/ohtac/public_engage_overview.html.
Contact Information
The Medical Advisory Secretariat
Ministry of Health and Long-Term Care
20 Dundas Street West, 10th floor
Toronto, Ontario
CANADA
M5G 2C2
Email: MASinfo.moh@ontario.ca
Telephone: 416-314-1092
ISSN 1915-7398 (Online)
ISBN 978-1-4435-2297-7 (PDF)
About the Medical Advisory Secretariat
The Medical Advisory Secretariat is part of the Ontario Ministry of Health and Long-Term Care. The mandate of the Medical Advisory Secretariat is to provide evidence-based policy advice on the coordinated uptake of health services and new health technologies in Ontario to the Ministry of Health and Long-Term Care and to the healthcare system. The aim is to ensure that residents of Ontario have access to the best available new health technologies that will improve patient outcomes.
The Medical Advisory Secretariat also provides a secretariat function and evidence-based health technology policy analysis for review by the Ontario Health Technology Advisory Committee (OHTAC).
The Medical Advisory Secretariat conducts systematic reviews of scientific evidence and consultations with experts in the health care services community to produce the Ontario Health Technology Assessment Series.
About the Ontario Health Technology Assessment Series
To conduct its comprehensive analyses, the Medical Advisory Secretariat systematically reviews available scientific literature, collaborates with partners across relevant government branches, and consults with clinical and other external experts and manufacturers, and solicits any necessary advice to gather information. The Medical Advisory Secretariat makes every effort to ensure that all relevant research, nationally and internationally, is included in the systematic literature reviews conducted.
The information gathered is the foundation of the evidence to determine if a technology is effective and safe for use in a particular clinical population or setting. Information is collected to understand how a new technology fits within current practice and treatment alternatives. Details of the technology’s diffusion into current practice and input from practising medical experts and industry add important information to the review of the provision and delivery of the health technology in Ontario. Information concerning the health benefits; economic and human resources; and ethical, regulatory, social and legal issues relating to the technology assist policy makers to make timely and relevant decisions to optimize patient outcomes.
If you are aware of any current additional evidence to inform an existing evidence-based analysis, please contact the Medical Advisory Secretariat: MASinfo.moh@ontario.ca. The public consultation process is also available to individuals wishing to comment on an analysis prior to publication. For more information, please visit http://www.health.gov.on.ca/english/providers/program/ohtac/public_engage_overview.html.
Disclaimer
This evidence-based analysis was prepared by the Medical Advisory Secretariat, Ontario Ministry of Health and Long-Term Care, for the Ontario Health Technology Advisory Committee and developed from analysis, interpretation, and comparison of scientific research and/or technology assessments conducted by other organizations. It also incorporates, when available, Ontario data, and information provided by experts and applicants to the Medical Advisory Secretariat to inform the analysis. While every effort has been made to reflect all scientific research available, this document may not fully do so. Additionally, other relevant scientific findings may have been reported since completion of the review. This evidence-based analysis is current to the date of the literature review specified in the methods section. This analysis may be superseded by an updated publication on the same topic. Please check the Medical Advisory Secretariat Website for a list of all evidence-based analyses: http://www.health.gov.on.ca/ohtas.
List of Tables
| Table 1 Organ transplant wait-list and transplants performed in Ontario, 2009 (YTD) |
| Table 2 Included studies |
| Table 3 Characteristics of renal transplantation studies |
| Table 4 Renal transplantation baseline study population characteristics |
| Table 5 Kidney transplant patient survival data |
| Table 6 Kidney transplant death censored graft survival and graft survival rates |
| Table 7 Kidney transplantation return to dialysis rates |
| Table 8 Kidney transplantation disease progression |
| Table 9 Kidney transplantation cause of death and acute graft rejection |
| Table 10 Characteristics of liver transplantation studies among HIV+ and HIV− patients |
| Table 11 Liver transplantation baseline study population characteristics for HIV+ and HIV− patients |
| Table 12 Liver transplantation-patient survival rates for HIV+ and HIV− patients |
| Table 13 Liver transplantation graft survival rates for HIV+ and HIV− patients |
| Table 14 Liver transplantation disease progression among HIV+ and HIV− patients |
| Table 15 Liver transplantation cause of death and acute graft rejection rates for HIV+ and HIV− patients |
| Table 16 Liver transplantation baseline study population characteristics for HIV+/HCV+ and HCV+ patients |
| Table 17 Liver transplantation baseline study population characteristics for HIV+/HCV+ and HCV+ patients |
| Table 18 Liver transplantation patient survival for HIV+/HCV+ and HCV+ patients |
| Table 19 Liver transplantation graft survival rates for HIV+/HCV+ and HCV+ patients |
| Table 20 Disease progression for HIV+/HCV+ and HCV+ patients |
| Table 21 Liver transplantation cause of death, graft rejection rates and recurrence of HCV |
| Table 22 Risk of Death |
| Table 23 DCGS |
| Table 24 Disease Progression, Opportunistic Infection |
| Table 25 Disease Progression, CD4+ T-Cell Count <200counts/mm3 |
| Table 26 Disease Progression, HIV-viral load Any Detectable |
| Table 27 Return to dialysis |
| Table 28 Acute graft rejection |
| Table 29 HCV recurrence |
| Table A1 Kidney transplantation for ESRF among HIV+ and HIV− patients |
| Table A2 Liver transplantation for ESLF among HIV+ and HIV− patients |
| Table A3 Liver transplantation for ESLF among HIV+/HCV+ and HCV+ patients |
List of Abbreviations
- CI
Confidence interval
- ESOF
End stage organ failure
- ESRF
End stage renal failure
- ESLF
End stage liver failure
- HR
Hazard Ratio
- MAS
Medical Advisory Secretariat
- MOF
Multi organ failure
- MOSF
Multi organ system failure
- OR
Odds ratio
- OHTAC
Ontario Health Technology Advisory Committee
- RCT
Randomized controlled trial
- nRCT
Non-Randomized Controlled Trial
- SD
Standard deviation
References
- 1.Cooper CL, DeForest J, Gill J, Lalonde R. Barriers preventing liver transplantation in Canadians with HIV infection - perceptions of HIV specialists. Can J Gastroenterol. 2007;21(3):179–82. doi: 10.1155/2007/769752. [DOI] [PMC free article] [PubMed] [Google Scholar]
- 2.Moreno S, Fortun J, Quereda C, Moreno A, Perez-Elias M, Martin-Davila P, et al. Liver transplantation in HIV-infected recipients. Liver Transpl. 2005;11(1):76–81. doi: 10.1002/lt.20318. [DOI] [PubMed] [Google Scholar]
- 3.Halpern SD, Ubel PA, Caplan AL. Solid-organ transplantation in HIV-infected patients. N Engl J Med. 2002;347(4):284–7. doi: 10.1056/NEJMsb020632. [DOI] [PubMed] [Google Scholar]
- 4.Norris S, Taylor C, Muiesan P, Portmann BC, Knisely AS, Bowles M, et al. Outcomes of liver transplantation in HIV-infected individuals: the impact of HCV and HBV infection. Liver Transpl. 2004;10(10):1271–8. doi: 10.1002/lt.20233. [DOI] [PubMed] [Google Scholar]
- 5.Terrault NA, Carter JT, Carlson L, Roland ME, Stock PG. Outcome of patients with hepatitis B virus and human immunodeficiency virus infections referred for liver transplantation. Liver Transpl. 2006;12(5):801–7. doi: 10.1002/lt.20776. [DOI] [PubMed] [Google Scholar]
- 6.DiBenedetto F, Di SS, De RN, Berretta M, Montalti R, Guerrini GP, et al. Human immunodeficiency virus and liver transplantation: our point of view. Transplant Proc. 2008;40(6):1965–71. doi: 10.1016/j.transproceed.2008.05.067. [DOI] [PubMed] [Google Scholar]
- 7.Kumar MSA, Sierka DR, Damask AM, Fyfe B, Mcalack RF, Heifets M, et al. Safety and success of kidney transplantation and concomitant immunosuppression in HIV-positive patients. Kidney Int. 2005;67(4):1622–9. doi: 10.1111/j.1523-1755.2005.00245.x. [DOI] [PubMed] [Google Scholar]
- 8.Ragni MV, Eghtesad B, Schlesinger KW, Dvorchik I, Fung JJ. Pretransplant survival is shorter in HIV-positive than HIV-negative subjects with end-stage liver disease. Liver Transpl. 2005;11(11):1425–30. doi: 10.1002/lt.20534. [DOI] [PubMed] [Google Scholar]
- 9.Remis RS, Swantee C, Liu J. Report on HIV/AIDS in Ontario. Toronto, Ontario: Ontario HIV Epidemiological Monitoring Unit. 2007. [Jun [cited: 2010 Jan 26]]. [Internet] 196 p. Available from: http://www.phs.utoronto.ca/ohemu/doc/PHERO2007_report_final.pdf .
- 10.Maclean D, Smith J, Kilby D, Robinson G, Bannan C, Kreppner J, McGee F, Murray J, McKitterrick M. HIV and solid organ transplantation: a review of the literature with recommendations for action [Internet] [Nov 5 [cited: 2009 Apr 1]];Toronto: Ontario Ministry of Health and Long-Term Care. 2003 32 p. Available from: http://www.health.gov.on.ca/english/providers/pub/aids/reports/hiv_solid_organ_transplantation_review_of_litera.pdf . [Google Scholar]
- 11.Parmar MK, Torri V, Stewart L. Extracting summary statistics to perform meta-analyses of the published literature for survival endpoints. Stat Med. 2010;17:2815–34. doi: 10.1002/(sici)1097-0258(19981230)17:24<2815::aid-sim110>3.0.co;2-8. [DOI] [PubMed] [Google Scholar]
- 12.Williamson PR, Smith C, Hutton JL, Marson AG. Aggregate data meta-analysis with time-to-event outcomes. Stat Med. 2002;21:3337–51. doi: 10.1002/sim.1303. [DOI] [PubMed] [Google Scholar]
- 13.DerSimonian R, Laird N. Meta-analysis in clinical trials. Control Clin Trials. 1986;7(3):177–88. doi: 10.1016/0197-2456(86)90046-2. [DOI] [PubMed] [Google Scholar]
- 14.DerSimonian R, Kacker R. Random-effects model for meta-analysis of clinical trials: an update. Contemporary Clinical Trials. 2007;28(2):105–14. doi: 10.1016/j.cct.2006.04.004. [DOI] [PubMed] [Google Scholar]
- 15.Atkins D, Best D, Briss PA, Eccles M, Falck-Ytter Y, Flottorp S, et al. Grading quality of evidence and strength of recommendations. BMJ. 2004;328(7454):1490. doi: 10.1136/bmj.328.7454.1490. [DOI] [PMC free article] [PubMed] [Google Scholar]
- 16.Castells L, Escartin A, Bilbao I, Len O, Allende H, Vargas V, et al. Liver transplantation in HIV-HCV coinfected patients: A case-control study. Transplantation. 2007;83(3):354–8. doi: 10.1097/01.tp.0000251378.70853.90. [DOI] [PubMed] [Google Scholar]
- 17.Vennarecci G, Ettorre GM, Antonini M, Santoro R, Perracchio L, Visco G, et al. Liver transplantation in HIV-positive patients. Transplant Proc. 2007;39(6):1936–8. doi: 10.1016/j.transproceed.2007.05.076. [DOI] [PubMed] [Google Scholar]
- 18.Roland ME, Barin B, Carlson L, Frassetto LA, Terrault NA, Hirose R, et al. HIV-infected liver and kidney transplant recipients: 1- and 3-year outcomes. Am J Transplant. 2008;8(2):355–65. doi: 10.1111/j.1600-6143.2007.02061.x. [DOI] [PubMed] [Google Scholar]
- 19.Abbott KC, Swanson SJ, Agodoa LYC, Kimmel PL. Human immunodeficiency virus infection and kidney transplantation in the era of highly active antiretroviral therapy and modern immunosuppression. J Am Soc Nephrol. 2004;15(6):1633–9. doi: 10.1097/01.asn.0000127987.19470.3a. [DOI] [PubMed] [Google Scholar]
- 20.Locke JE, Montgomery RA, Warren DS, Subramanian A, Segev DL. Renal transplant in HIV-positive patients: Long-term outcomes and risk factors for graft loss. Arch Surg. 2009;144(1):83–6. doi: 10.1001/archsurg.2008.508. [DOI] [PubMed] [Google Scholar]
- 21.Qiu J, Terasaki PI, Waki K, Cai J, Gjertson DW. HIV-positive renal recipients can achieve survival rates similar to those of HIV-negative patients. Transplantation. 2006;81(12):1658–61. doi: 10.1097/01.tp.0000226074.97314.e0. [DOI] [PubMed] [Google Scholar]
- 22.De Vera ME, Dvorchik I, Tom K, Eghtesad B, Thai N, Shakil O, et al. Survival of liver transplant patients coinfected with HIV and HCV is adversely impacted by recurrent hepatitis C. Am J Transplant. 2006;6(12):2983–93. doi: 10.1111/j.1600-6143.2006.01546.x. [DOI] [PubMed] [Google Scholar]
- 23.Duclos-Vallee J-C, Feray C, Sebagh M, Teicher E, Roque-Afonso A-M, Roche B, et al. Survival and recurrence of hepatitis C after liver transplantation in patients coinfected with human immunodeficiency virus and hepatitis C virus. Hepatology. 2008;47(2):407–17. doi: 10.1002/hep.21990. [DOI] [PubMed] [Google Scholar]
- 24.Mindikoglu AL, Regev A, Magder LS. Impact of human immunodeficiency virus on survival after liver transplantation: Analysis of united network for organ sharing database. Transplantation. 2008;85(3):359–68. doi: 10.1097/TP.0b013e3181605fda. [DOI] [PubMed] [Google Scholar]
- 25.Ragni MV, Belle SH, Im K, Neff G, Roland M, Stock P, et al. Survival of human immunodeficiency virus-infected liver transplant recipients. J Infect Dis. 2003;188(10):1412–20. doi: 10.1086/379254. [DOI] [PubMed] [Google Scholar]
- 26.Schreibman I, Gaynor JJ, Jayaweera D, Pyrsopoulos N, Weppler D, Tzakis A, et al. Outcomes after orthotopic liver transplantation in 15 HIV-infected patients. Transplantation. 2007;84(6):697–705. doi: 10.1097/01.tp.0000282873.24648.5b. [DOI] [PubMed] [Google Scholar]
- 27.Testillano M, Fernandez JR, Suarez MJ, Gastaca M, Bustamante J, Pijoan JI, et al. Survival and hepatitis C virus recurrence after liver transplantation in HIV− and hepatitis C virus-coinfected patients: experience in a single center. Transplant Proc. 2009;41(3):1041–3. doi: 10.1016/j.transproceed.2009.02.030. [DOI] [PubMed] [Google Scholar]
- 28.Pelletier SJ, Norman SP, Christensen LL, Stock PG, Port FK, Merion RM. Review of transplantation in HIV patients during the HAART era. Clin Transpl. 2004:63–82. [PubMed] [Google Scholar]
- 29.Goodman C. Literature searching and evidence interpretation for assessing health care practices. Stockholm, Sweden: The Swedish council on Technology Assessment in Health Care. 1993 doi: 10.1017/s0266462300008321. 81 p. SBU-Report No 119E. [DOI] [PubMed] [Google Scholar]
- 30.EBPG Expert Group on Renal Transplantation. European best practice guidelines for renal transplantation Section IV: Long-term management of the transplant recipient. Nephrol Dial Transplant. 2002;17:60–7. IV.13 Analysis of patient and graft survival. (Suppl 4) [PubMed] [Google Scholar]
- 31.Norris S, Houlihan D. Liver transplantation in HIV-positive patients. Expert Rev Gastroenterol Hepatol. 2008;2(1):39–46. doi: 10.1586/17474124.2.1.39. [DOI] [PubMed] [Google Scholar]