

Executive Summary
In February 2010, the Medical Advisory Secretariat (MAS) began work on evidence-based reviews of the literature surrounding three pharmacogenomic tests. This project came about when Cancer Care Ontario (CCO) asked MAS to provide evidence-based analyses on the effectiveness and cost-effectiveness of three oncology pharmacogenomic tests currently in use in Ontario.
Evidence-based analyses have been prepared for each of these technologies. These have been completed in conjunction with internal and external stakeholders, including a Provincial Expert Panel on Pharmacogenomics (PEPP). Within the PEPP, subgroup committees were developed for each disease area. For each technology, an economic analysis was also completed by the Toronto Health Economics and Technology Assessment Collaborative (THETA) and is summarized within the reports.
The following reports can be publicly accessed at the MAS website at: www.health.gov.on.ca/mas or at www.health.gov.on.ca/english/providers/program/mas/mas_about.html
Gene Expression Profiling for Guiding Adjuvant Chemotherapy Decisions in Women with Early Breast Cancer: An Evidence-Based and Economic Analysis
Epidermal Growth Factor Receptor Mutation (EGFR) Testing for Prediction of Response to EGFR-Targeting Tyrosine Kinase Inhibitor (TKI) Drugs in Patients with Advanced Non-Small-Cell Lung Cancer: an Evidence-Based and Economic Analysis
K-RAS testing in Treatment Decisions for Advanced Colorectal Cancer: an Evidence-Based and Economic Analysis.
Objective
The objective of this systematic review is to determine the predictive value of KRAS testing in the treatment of metastatic colorectal cancer (mCRC) with two anti-EGFR agents, cetuximab and panitumumab. Economic analyses are also being conducted to evaluate the cost-effectiveness of KRAS testing.
Clinical Need: Condition and Target Population
Metastatic colorectal cancer (mCRC) is usually defined as stage IV disease according to the American Joint Committee on Cancer tumour node metastasis (TNM) system or stage D in the Duke’s classification system. Patients with advanced colorectal cancer (mCRC) either present with metastatic disease or develop it through disease progression.
KRAS (Kristen-RAS, a member of the rat sarcoma virus (ras) gene family of oncogenes) is frequently mutated in epithelial cancers such as colorectal cancer, with mutations occurring in mutational hotspots (codons 12 and 13) of the KRAS protein. Involved in EGFR-mediated signalling of cellular processes such as cell proliferation, resistance to apoptosis, enhanced cell motility and neoangiogenesis, a mutation in the KRAS gene is believed to be involved in cancer pathogenesis. Such a mutation is also hypothesized to be involved in resistance to targeted anti-EGFR (epidermal growth factor receptor with tyrosine kinase activity) treatments such as cetuximab and panitumumab, hence, the important in evaluating the evidence on the predictive value of KRAS testing in this context.
KRAS Mutation Testing in Advanced Colorectal Cancer
Both cetuximab and panitumumab are indicated by Health Canada in the treatment of patients with metastatic colorectal cancer whose tumours are WT for the KRAS gene. Cetuximab may be offered as monotherapy in patients intolerant to irinotecan-based chemotherapy or in patients who have failed both irinotecan and oxaliplatin-based regimens and who received a fluoropyrimidine. It can also be administered in combination with irinotecan in patients refractory to other irinotecan-based chemotherapy regimens. Panitumumab is only indicated as a single agent after failure of fluoropyrimidine-, oxaliplatin-, and irinotecan-containing chemotherapy regimens.
In Ontario, patients with advanced colorectal cancer who are refractory to chemotherapy may be offered the targeted anti-EGFR treatments cetuximab or panitumumab. Eligibility for these treatments is based on the KRAS status of their tumour, derived from tissue collected from surgical or biopsy specimens. It is believed that KRAS status is not affected by treatments, therefore, for patients for whom surgical tissue is available for KRAS testing, additional biopsies prior to treatment with these targeted agents is not necessary. For patients that have not undergone surgery or for whom surgical tissue is not available, a biopsy of either the primary or metastatic site is required to determine their KRAS status. This is possible as status at the metastatic and primary tumour sites is considered to be similar.
Research Question
To determine if there is predictive value of KRAS testing in guiding treatment decisions with anti-EGFR targeted therapies in advanced colorectal cancer patients refractory to chemotherapy.
Research Methods
Literature Search
The Medical Advisory Secretariat followed its standard procedures and on May 18, 2010, searched the following electronic databases: Ovid MEDLINE, EMBASE, Ovid MEDLINE In-Process & Other Non-Indexed Citations, Cochrane Central Register of Controlled Trials, Cochrane Database of Systematic Reviews and The International Network of Agencies for Health Technology Assessment database.
The subject headings and keywords searched included colorectal cancer, cetuximab, panitumumab, and KRAS testing. The search was further restricted to English-language articles published between January 1, 2009 and May 18, 2010 resulting in 1335 articles for review. Excluded were case reports, comments, editorials, nonsystematic reviews, and letters. Studies published from January 1, 2005 to December 31, 2008 were identified in a health technology assessment conducted by the Agency for Healthcare Research and Quality (AHRQ), published in 2010. In total, 14 observational studies were identified for inclusion in this EBA: 4 for cetuximab monotherapy, 7 for the cetuximab-irinotecan combination therapy, and 3 to be included in the review for panitumumab monotherapy
Inclusion Criteria
English-language articles, and English or French-language HTAs published from January 2005 to May 2010, inclusive.
Randomized controlled trials (RCTs) or observational studies, including single arm treatment studies that include KRAS testing.
Studies with data on main outcomes of interest, overall and progression-free survival.
Studies of third line treatment with cetuximab or panitumumab in patients with advanced colorectal cancer refractory to chemotherapy.
For the cetuximab-irinotecan evaluation, studies in which at least 70% of patients in the study received this combination therapy.
Exclusion Criteria
Studies whose entire sample was included in subsequent publications which have been included in this EBA.
Studies in pediatric populations.
Case reports, comments, editorials, or letters.
Outcomes of Interest
Overall survival (OS), median
Progression-free-survival (PFS), median.
Response rates.
Adverse event rates.
Quality of life (QOL).
Summary of Findings of Systematic Review
Cetuximab or Panitumumab Monotherapy
Based on moderate GRADE observational evidence, there is improvement in PFS and OS favouring patients without the KRAS mutation (KRAS wildtype, or KRAS WT) compared to those with the mutation.
Cetuximab-Irinotecan Combination Therapy
There is low GRADE evidence that testing for KRAS may optimize survival benefits in patients without the KRAS mutation (KRAS wildtype, or KRAS WT) compared to those with the mutation.
However, cetuximab-irinotecan combination treatments based on KRAS status discount any effect of cetuximab in possibly reversing resistance to irinotecan in patients with the mutation, as observed effects were lower than for patients without the mutation. Clinical experts have raised concerns about the biological plausibility of this observation and this conclusion would, therefore, be regarded as hypothesis generating.
Economic Analysis
Cost-effectiveness and budget impact analyses were conducted incorporating estimates of effectiveness from this systematic review. Evaluation of relative cost-effectiveness, based on a decision-analytic cost-utility analysis, assessed testing for KRAS genetic mutations versus no testing in the context of treatment with cetuximab monotherapy, panitumumab monotherapy, cetuximab in combination with irinotecan, and best supportive care.
Of importance to note is that the cost-effectiveness analysis focused on the impact of testing for KRAS mutations compared to no testing in the context of different treatment options, and does not assess the cost-effectiveness of the drug treatments alone.
Conclusions
KRAS status is predictive of outcomes in cetuximab and panitumumab monotherapy, and in cetuximab-irinotecan combination therapy.
While KRAS testing is cost-effective for all strategies considered, it is not equally cost-effective for all treatment options.
Background
In February 2010, the Medical Advisory Secretariat (MAS) began work on evidence-based reviews of the literature surrounding three pharmacogenomic tests. This project came about when Cancer Care Ontario (CCO) asked MAS to provide evidence-based analyses on the effectiveness and cost-effectiveness of three oncology pharmacogenomic tests currently in use in Ontario.
Evidence-based analyses have been prepared for each of these technologies. These have been completed in conjunction with internal and external stakeholders, including a Provincial Expert Panel on Pharmacogenomics (PEPP). Within the PEPP, subgroup committees were developed for each disease area. For each technology, an economic analysis was also completed by the Toronto Health Economics and Technology Assessment Collaborative (THETA) and is summarized within the reports.
The following reports can be publicly accessed at the MAS website at:
www.health.gov.on.ca/mas or at
www.health.gov.on.ca/english/providers/program/mas/mas_about.html
Gene Expression Profiling for Guiding Adjuvant Chemotherapy Decisions in Women with Early Breast Cancer: An Evidence-Based and Economic Analysis
Epidermal Growth Factor Receptor Mutation (EGFR) Testing for Prediction of Response to EGFR-Targeting Tyrosine Kinase Inhibitor (TKI) Drugs in Patients with Advanced Non-Small-Cell Lung Cancer: an Evidence-Based and Economic Analysis
K-RAS testing in Treatment Decisions for Advanced Colorectal Cancer: an Evidence-Based and Economic Analysis
Objective of Analysis
The objective of this systematic review is to determine the predictive value of KRAS testing in the treatment of metastatic colorectal cancer (mCRC) with two anti-EGFR agents, cetuximab and panitumumab. Economic analyses are also being conducted to evaluate the cost-effectiveness and budget impact of KRAS testing.
Clinical Need and Target Population
Metastatic colorectal cancer (mCRC) is usually defined as stage IV disease according to the American Joint Committee on Cancer tumour node metastasis (TNM) system or stage D in the Duke’s classification system. (1) Patients with advanced colorectal cancer (mCRC) either present with metastatic disease or develop it through disease recurrence.
KRAS (Kristen-RAS, a member of the rat sarcoma virus (ras) gene family of oncogenes) is frequently mutated in epithelial cancers such as colorectal cancer, with mutations occurring in mutational hotspots (codons 12 and 13) of the KRAS protein. (2) Involved in EGFR-mediated signalling of cellular processes such as cell proliferation, resistance to apoptosis, enhanced cell motility and neoangiogenesis, a mutation in the KRAS gene is believed to be involved in cancer pathogenesis. Such a mutation is also hypothesized to be involved in resistance to targeted anti-EGFR (epidermal growth factor receptor with tyrosine kinase activity) treatments such as cetuximab and panitumumab, hence, the important in evaluating the evidence on the predictive value of KRAS testing in this context.
Ontario Context
Both cetuximab and panitumumab are indicated by Health Canada in the treatment of patients with metastatic colorectal cancer whose tumours are wildtype (WT) for the KRAS gene. A tumour that is WT means that a KRAS mutation has not been identified through mutation testing as described in the next section.
Cetuximab may be offered as monotherapy in patients intolerant to irinotecan-based chemotherapy or in patients who have failed both irinotecan and oxaliplatin-based regimens and who received a fluoropyrimidine. It can also be administered in combination with irinotecan in patients refractory to other irinotecan-based chemotherapy regimens. Panitumumab is only indicated as a single agent after failure of fluoropyrimidine-, oxaliplatin-, and irinotecan-containing chemotherapy regimens.
In Ontario, patients with advanced colorectal cancer who are refractory to chemotherapy may be offered the targeted anti-EGFR treatments cetuximab or panitumumab. Eligibility for these treatments is based on the KRAS status of their tumour, derived from tissue collected from surgical or biopsy specimens. It is believed that KRAS status is not affected by treatments, therefore, for patients for whom surgical tissue is available for KRAS testing, additional biopsies prior to treatment with these targeted agents is not necessary. For patients that have not undergone surgery or for whom surgical tissue is not available, a biopsy of either the primary or metastatic site is required to determine their KRAS status. This is possible as status at the metastatic and primary tumour sites is considered to be similar. (3)
The Ontario prevalence of KRAS mutations in advanced colorectal cancer patients in Ontario, based on 1000 samples, is 43%. The remaining 57% have a non-mutated KRAS gene, or are KRAS wild-type (KRAS WT).
KRAS Mutation Testing
KRAS testing is presently being conducted by many laboratories in Ontario. Laboratories require a licence for KRAS testing which they obtain from the Ministry of Health and Long-Term Care.
KRAS testing costs vary depending on methods used (Expert consultation, April 2010) and are currently funded by Amgen and Bristol Myers Squibb, manufacturers of cetuximab and panitumumab, respectively.
The laboratory procedures for testing are based on polymerase chain reaction (PCR) methods. These include direct sequencing (DR), RFLP, allele-specific probes, high resolution melting analysis confirmed by DR, amplification refractory mutation system (ARMS), and pyrosequencing. Advantages and disadvantages of these tests include turnaround time (from days to weeks) and sensitivity (ranging from 1% to 25%). A sensitivity of 1%, which is the better measure compared to 25% sensitivity, means that mutations can be detected in the presence of only 1% affected cells. Details of these laboratory procedures can be found in a thorough review by Soulieres et al. (4)
The TheraScreen KRAS mutation kit, a commercial kit from DxS, Manchester, UK, is also available in Canada though distribution by Roche Diagnostics. A combination of ARMS and real-time PCR technology, it can detect KRAS mutations in codons 12 and 13 with a sensitivity of 1 to 5 %. Approved by Health Canada in 2009, it is licenced as a Class 3 device (Licence number 79697).
Evidence-Based Analysis
Research Question
To determine if there is predictive value of KRAS testing in guiding treatment decisions with anti-EGFR targeted therapies in advanced colorectal cancer.
Research Methods
Literature Search Strategy
The Medical Advisory Secretariat followed its standard procedures and on May 18, 2010, searched the following electronic databases: Ovid MEDLINE, EMBASE, Ovid MEDLINE In-Process & Other Non-Indexed Citations, Cochrane Central Register of Controlled Trials, Cochrane Database of Systematic Reviews and The International Network of Agencies for Health Technology Assessment database.
The subject headings and keywords searched included colorectal cancer, cetuximab, panitumumab, and KRAS testing. The search was further restricted to English-language articles published between January 1, 2009 and May 18, 2010 resulting in 1335 articles for review. Excluded were case reports, comments, editorials, nonsystematic reviews, and letters. The detailed search strategy can be viewed in Appendix 1.
Studies published from January 1, 2005 to December 31, 2008 were identified in a health technology assessment published by the Agency for Healthcare Research and Quality (AHRQ) in 2010. (2)
In total, 14 observational studies were identified for inclusion in this EBA: 4 for cetuximab monotherapy, 7 for the cetuximab-irinotecan combination therapy, and 3 to be included in the review for panitumumab monotherapy.
Inclusion Criteria
English-language articles, and English or French-language HTAs published from January 2005 to May 2010, inclusive.
Randomized controlled trials (RCTs) or observational studies, including single arm treatment studies that include KRAS testing.
Studies with data on main outcomes of interest, overall and progression-free survival.
Studies of third line treatment with cetuximab or panitumumab in patients with advanced colorectal cancer refractory to chemotherapy.
For the cetuximab-irinotecan evaluation, studies in which at least 70% of patients in the study received this combination therapy.
Exclusion Criteria
Studies whose entire sample was included in subsequent publications which have been included in this EBA.
Studies in pediatric populations.
Case reports, comments, editorials, or letters.
Intervention
KRAS mutation testing.
Outcomes of Interest
Overall survival (OS), median
Progression-free-survival (PFS), median.
Response rates.
Adverse event rates.
Quality of life (QOL).
Statistical Analysis
Data for median overall and progression-free-survival between KRAS mutated and wildtype patients treated with cetuximab or panitumumab monotherapy, or the cetuximab-irinotecan combination therapy are presented as reported in the existing literature. Pooling of studies was only possible when 95% confidence intervals of the median survival were available, for conversion of medians to mean survival times by the method of Hozo et al. (5) Pooling of studies was based on the random effects model comparing mean survival times in months between KRAS mutated and wildtype patients. Pooling was conducted in Review Manager 5.
Results of Literature Review and Evidence-Based Analysis
Two recent health technology assessments, one by the Agency for Healthcare Research and Quality (AHRQ) and the other by Blue Cross Blue Shield (6), were identified in the literature from 2005 to 2010. The HTA by AHRQ, published in 2010 (2), was used as a source of studies from 2005 to 2008. A literature search for studies from January 1 2009 to May 18 2010 gave rise to a total of 1335 references, although no further studies were identified for inclusion in this MAS EBA.
Table 1: Summary and Focus of Previous Health Technology Assessments on KRAS Testing.
| Year | Author | Focus of Assessment |
|---|---|---|
| 2010 | Agency for Healthcare Research and Quality (AHRQ)(2) | To evaluate whether KRAS testing predicts response to cetuximab or panitumumab therapy. |
| 2009 | Blue Cross Blue Shield (6) | To evaluate and summarize the evidence of using KRAS mutation status as a predictor of non-response to EGFR targeted therapy with cetuximab and panitumumab in patients with metastatic colorectal cancer. |
EGFR epithelial growth factor receptor;
The AHRQ review (2) found that a substantial body of evidence consisting of small retrospective analyses and analyses based on RCTs suggests that the presence of a KRAS mutation predicts differential response to anti-EGFR therapy in colorectal cancer patients. The review by Blue Cross Blue Shield (6) concluded similarly that there is sufficient evidence of the clinical validity of KRAS mutation testing and its clinical utility in guiding anti-EGFR therapy selection in patients with metastatic colorectal cancer.
Medical Advisory Secretariat Review
The Medical Advisory Secretariat review includes 14 retrospective analyses by KRAS status within 2 previously conducted anti-EGFR therapy RCTs and 12 single arm treatment studies. In total, 4 studies were included in the cetuximab review, and 3 studies in the panitumumab monotherapy review. These numbers are similar to those identified in the AHRQ review. For the cetuximab-irinotecan combination therapy, 7 studies in which at least 70% of the study sample received irinotecan were included. Excluded from the combination therapy review were also studies whose entire sample was subsequent published in an article included in this review. A thorough clinical review of all studies was also conducted to ensure similarities in treatment regimens, outcomes and timing of measurements, and patient characteristics. Details of patient and study characteristics for studies included in this MAS review are available in Appendix 2.
Table 2: Quality of Evidence of Included Studies (7).
| Study Design | Level of Evidence† | Number of Eligible Studies |
|---|---|---|
| Large RCT, systematic review of RCTs | 1 | |
| Large RCT unpublished but reported to an international scientific meeting | 1(g) | |
| Small RCT | 2 | |
| Small RCT unpublished but reported to an international scientific meeting | 2(g) | |
| Non-RCT with contemporaneous controls | 3a | 2 + 12 |
| Non-RCT with historical controls | 3b | |
| Non-RCT presented at international conference | 3(g) | |
| Surveillance (database or register) | 4a | |
| Case series (multisite) | 4b | |
| Case series (single site) | 4c | |
| Retrospective review, modelling | 4d | |
| Case series presented at international conference | 4(g) | |
| Total |
RCT refers to randomized controlled trial;
Cetuximab Monotherapy
Four observational studies were included in the review of KRAS testing in the context of treatment with cetuximab as a monotherapy. The study by Karapetis et al. (8) is a retrospective analysis (stratified by KRAS status) of the CO.17 RCT by Jonker et al. (9) which compared the effectiveness of cetuximab and best-supportive care (BSC) compared to BSC in the treatment of patients with advanced colorectal cancer refractory to chemotherapy. The original CO.17 trial included 572 patients and did not allow cross-over from the BSC arm to the treatment arm, whereas the Karapetis data included 394 patients (or 68.8% of the Jonker et al. sample) for whom KRAS status was available. Nevertheless, data are presented within the context of the original CO.17 trial arms of cetuximab and best-supportive care (BSC) or BSC, further stratified by KRAS status. This feature of the Karapetis data allows for the testing of an interaction between KRAS and the treatment options in relation to the outcomes of interest, OS and PFS. Considered an observational study as randomization was not based on KRAS status, this retrospective analysis of a prospective study, which allows for testing of the interaction mentioned, is considered higher quality evidence than the remaining observational studies which are single arm studies (with no comparison). For this reason, The GRADE evaluation which is seen in the section on ‘Quality of Evidence’, is based on this higher quality evidence and not on the single arm studies.
Furthermore, the Karapetis data is presented first in this section in that it is the only study with a comparison group (BSC) thus allowing for an examination of the presence of a prognostic and/or predictive effect of KRAS status. With respect to the prognostic value of KRAS status, there was no evidence of a prognostic effect as survival times were similar in the BSC arm for OS (4.6 and 4.8 months) and PFS (1.8 and 1.9 months) for KRAS mutated and WT patients, respectively. Therefore, all assessments in this EBA are based on the predictive value and not the prognostic value of KRAS status.
With respect to the treatment-KRAS interaction effect, Karapetis et al. showed a significant KRAS-treatment interaction (p<0.05) for both OS and PFS. This significant interaction indicates that the effect of cetuximab differs by KRAS status, with improved OS and PFS favouring the KRAS WT compared to the mutated patients treated with cetuximab.
In an effort to include all relevant studies in this systematic review, the treatment arm of the Karapetis study is presented in Tables 3 and 4 in addition to the remaining 3 observational (single arm) treatment studies. As seen in Table 3, the median PFS is approximately 2.0 months and 4.0 months for the KRAS mutated and WT patients, respectively. Hazard ratios (HR) and/or p-values of comparisons of median survival between the two groups, KRAS mutated and WT, are also reported where available. Hazard ratios and p-values presented indicate a better PFS for patients without the mutation (WT) compared to those with the mutation. Similarly, the median OS was in favour of the KRAS WT patients, with an approximate median survival of 5.5 months and 8.0 months for the KRAS mutated and WT patients, respectively. Hazard ratios (HR) and/or p-values of comparisons of median OS between the two groups were also in favour of KRAS WT patients. (Table 4)
Table 3: Median Progression-Free-Survival by KRAS Status in Advance Colorectal Cancer Patients Treated with Cetuximab.
| Median PFS in mos. (95% CI) |
||||
|---|---|---|---|---|
| Study (N patients) |
N KRAS tests, % mutated |
KRAS Mutated | KRAS WT | HR (95% CI), p-value |
| Karapetis et al. 2008 (287) (8) |
198 42.3% |
1.8 | 3.7 | NR, NR |
| Lurje et al. 2008 (346) (10) |
130 32.3% |
1.3 | 1.4 | RR=1.49 (1.01- 2.20), p=0.02 |
| Cappuzzo et al. 2008 (85) (11) |
80 52.5% |
4.4 | 5.4 | NR, p=0.02 |
| Khambata-Ford et al. 2007 (110)(12) |
80 37.5% |
1.97 | 2.03 | 1.4 (0.87-2.6), p=0.14 |
NR: not reported.
Table 4: Median Overall Survival by KRAS Status in Advance Colorectal Cancer Patients Treated with Cetuximab.
| Median PFS in mos. (95%CI) |
||||
|---|---|---|---|---|
| Study (N patients) |
N KRAS tests, % mutated |
KRAS Mutated | KRAS WT | HR (95% CI), p-value |
| Karapetis et al. 2008 (287) (8) |
198 42.3% |
4.5 | 9.5 | NR, NR |
| Lurje et al. 2008 (346) (10) |
130 32.2% |
4.9 | 6.6 | RR=1.59 (1.05-2.40), p=0.02 |
| Cappuzzo et al. 2008 (85) (11) |
80 52.5% |
9.5 | 10.8 | NR, p=0.3 |
| Khambata-Ford et al. 2007 (110) (12) |
80 37.5% |
NR | NR | NR, NR |
NR: not reported.
Cetuximab-Irinotecan Combination Therapy
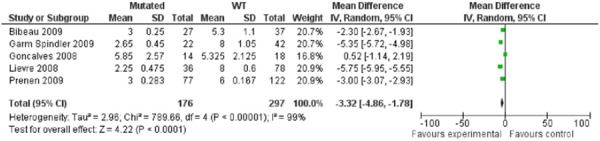
In assessing the predictive value of KRAS testing in the context of patients treated with the cetuximab-irinotecan combination therapy, the PFS was approximately 3.0 and 6.0 months for the mutated compared to the WT patients. (Table 5) In pooling 5 of 7 studies for whom relevant data was available, a mean difference of 3.32 months (95%CI: 1.78-4.86) was significantly in favour of the KRAS WT patients (p<0.00001). (Figure 1) However, the test for heterogeneity was significant (p<0.00001, I2=99%) which suggests important heterogeneity in the data, in spite of considerable efforts to minimize the clinical heterogeneity in the data. Efforts to minimize clinical heterogeneity included a review of all studies with an expert in colorectal cancer treatment for similarities in treatment regimens, including dosages, patient characteristics with respect to stage of disease and previous treatments to ensure that studies were assessing effects of third line therapies. Studies were also reviewed with an expert in laboratory medicine with specific expertise in genetic testing to ensure that laboratory methods used in testing for KRAS and the prevalence of mutations were compatible across studies, and not likely to contribute to analytic and clinical heterogeneity.
Table 5: Median Progression-Free-Survival by KRAS Status in Advance Colorectal Cancer Patients Treated with Cetuximab-Irinotecan Combination Therapy.
| Median PFS in mos. (95%CI) |
||||
|---|---|---|---|---|
| Study (N patients) |
N KRAS tests, % mutated |
KRAS Mutated |
KRAS WT |
HR (95% CI), p-value |
| Bibeau et al. 2009 (69) (13) |
64 42.2% |
3 | 5.3 | 1.8 (1.1-3.1), p=0.024 |
| Oden-Gangloff et al. 2009 (64) (14) |
64 28% |
3 | 5 | NR, p=0.034 |
| Garm Spindler et al. 2009 (71) (15) |
64 34% |
2.3 | 8.0 | NR, p=<0.009 |
| Goncalves et al., 2008 (32) (16) |
32 43.8% |
4.7 | 3.9 | NR, p=0.97 |
| Prenen et al., 2009 (200) (17) |
199 38.7% |
3 | 6 | 0.56 (0.41-0.77), mutant referent, p=<0.0001 |
| Loupakis et al. 2009 (102) (18) |
88/96 primary, 48/59 mets 40% (n=88) |
3.1 | 4.2 | 2.2 (1.4-3.7), p=0.003 |
| Lievre et al. 2008 (234) (19) |
114 27% (n=89) |
2.25 | 8 | 3.3 (2.0-5.4), p=0.0001 |
NR: not reported.
Figure 1: Pooling of Studies for Cetuximab-Irinotecan Combination Therapy: Mean Progression-Free-Survival.
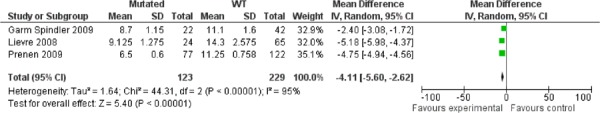
The median OS was also highest for patients without the mutation (approximately 14 months) compared to those with the mutation (8 months) (Table 6) with a pooled mean difference of 4.11 months (95%CI: 2.62-5.60) in favour of the WT patients. Similar to the pooled estimates of the PFS data, there was significant heterogeneity in the pooling of the OS data (p<0.00001, I2=95%, Figure 2).
Table 6: Median Overall Survival by KRAS Status in Advance Colorectal Cancer Patients Treated with Cetuximab-Irinotecan Combination Therapy.
| Median OS in mos. (95%CI) |
||||
|---|---|---|---|---|
| Study (N patients) |
N KRAS tests, % mutated |
KRAS Mutated |
KRAS WT | HR (95% CI), p-value |
| Bibeau et al. 2009 (69) (13) |
64 42.2% |
8.7 | 10.8 | 1.6 (0.8-2.9), p=0.147 |
| Oden-Gangloff et al. 2009 (64) (14) |
64 28% |
NR | NR | NR, NR |
| Garm Spindler et al. 2009 (71) (15) |
64 34% |
8.7 | 11.1 | NR, p=0.46 |
| Goncalves et al. 2008 (32) (16) |
32 43.8% |
13.8 | 20.8 | NR, p=0.47 |
| Prenen et al. 2009 (200) (17) |
199 38.7% |
6.5 | 11.25 | 0.50 (0.37-0.69), mutant referent p=<0.0001 |
| Loupakis et al. 2009 (102) (18) |
88/96 primary 48/59 mets 40% (n=88) |
6.1 | 13.5 | 2.2 (1.5-4.5), p=0.0004 |
| Lievre et al. 2008 (234) (19) |
114 27% (n=89) |
10.1 | 14.3 | 2.4 (1.4-4.1), p=0.0001 |
NR: not reported.
Figure 2: Pooling of Studies for Cetuximab-Irinotecan Combination Therapy: Mean Overall Survival.
Panitumumab Monotherapy
Similar to the analysis of Karapetis et al. for cetuximab monotherapy, Amado et al. published in 2008 (20) a retrospective analysis (stratified by KRAS status) of a previously conducted RCT of panitumumab compared to BSC by Van Cutsem et al. (21) Similar to the cetuximab monotherapy assessment of quality of data, the GRADE evaluation as presented in the ‘Quality of Evidence’ section is based on this study mainly and not on the single arm studies which are considered lower quality observational data.
In the Amado study, 427 of the 463 patients in the Van Cutsem trial with known KRAS status were included. Testing of the KRAS-treatment interaction term was significant, although not for the outcome of OS. These results suggest a benefit with respect to PFS for KRAS WT patients in being treated with panitumumab. The lack of a significant effect for OS, however it likely attributable to the fact that crossover was allowed in this RCT, with approximately 76% of the BSC patients receiving treatment.
When the treatment arm of the Amado et al. study was included with the remaining single arm studies of patients treated with panitumumab, overall survival (Table 8) and PFS (Table 7) were both improved for patients without the mutation. The survival times were similar to that of cetuximab monotherapy, and lower for both outcomes than that observed for the cetuximab-irinotecan combination therapy. This observation of increased survival in the cetuximab-irintotecan combination therapy for patients with and without the KRAS mutation lead to a further examination of response rates to determine if any additional effects could be observed.
Table 8: Median Overall Survival by KRAS Status in Advance Colorectal Cancer Patients Treated with Panitumumab.
| Median OS in mos. (95%CI) |
||||
|---|---|---|---|---|
| Study (N patients) |
KRAS tests, % mutated |
KRAS Mutated |
KRAS WT | HR (95% CI), p-value |
| Amado et al. 2008 (231) (20) |
208 43% |
4.9 | 8.1 | NR, NR |
| Freeman et al. 2008 (533) (23) |
62 38.7% |
5.55 | 10.73 | 2.00 (1.11-3.33), p=<0.015 |
| Muro et al. 2009 (60) (24) |
24 42% |
NR | NR | NR, NR |
NR: not reported.
Table 7: Median Progression-Free-Survival by KRAS Status in Advance Colorectal Cancer Patients Treated with Panitumumab.
| Median PFS in mos. (95%CI) |
||||
|---|---|---|---|---|
| Study (N patients) |
N KRAS tests, % mutated |
KRAS Mutated |
KRAS WT | HR (95% CI), p-value |
| Amado et al. 2008 (231) (20) |
208 43% |
1.85 | 3.08 | NR, NR |
| Freeman et al. 2008 (533) (23) |
62 38.7% |
1.85 | 4.05 | 2.50 (1.43-5.00), p=<0.002 |
| Muro et al. 2009 (60) (24) |
24 42% |
1.83 | 3.30 | NR, NR |
NR: not reported.
Whereas the response rates (partial response) were approximately 1% for the mutated and 10-15% for the WT groups for both cetuximab and panitumumab monotherapies, the stable disease rates were similar for both the mutated and non-mutated patients treated with the cetuximab-irinotecan combination. The response rates for the cetuximab-irinotecan combination studies presented in Table 10, however, are suggestive of similar partial response rates to the monotherapies, although stable disease rates are approximately 45% and appear to be higher in the mutated patients (range 37-64%) than in the WT patients (range 26.2%-51.6%). This is in contrast to the stable disease rates for the monotherapies that are between 8% and 53%, although much higher for the WT than the mutated patients.
Table 10: Quality of Life Measures by KRAS Status.
| QOL Measure in Global Health Status |
KRAS Mutated (n=81) |
KRAS WT (n=117) |
|---|---|---|
| Mean change in score at 8 wks | ||
| Cetuximab | -4.7 | 3.2 |
| BSC | -9.6 | -7.7 |
| Mean change in score at 16 wks | ||
| Cetuximab | -9.5 | -0.2 |
| BSC | -13.9 | -18.1 |
QOL: quality of life; BSC: best supportive care.
There was much discussion of the interpretation of these response rate data for the cetuximab-irinotecan combination which are suggestive of a role of cetuximab in the reversal of resistance to irinotecan as all treated patients had previously received irinotecan. This possible reversal of resistance was also mentioned by Cunningham et al. (22) Clinical experts, however, indicate that it is unclear how irinotecan resistance is defined in these patients, which could include failure of treatment or toxicity at different time points prior to initiation of the cetuximab-irinotecan combination therapy. In addition, it was suggested that since these studies were conducted prior to the availability of oxaliplatin as a further treatment option, the increased OS and PFS compared to the monotherapies may be due to the expected survival advantage for patients at an earlier stage in their treatment process.
Table 9: Response Rates for Cetuximab-Irinotecan Combination Therapy by KRAS Status.
| Study | N tests Response |
KRAS Mutated | KRAS WT |
|---|---|---|---|
| Bibeau et al. (13) | N PR SD PD |
27 4% 37% 59% |
37 27% 41% 32% |
| Oden-Gangloff et al. (14) | N CR + PR SD PD |
18 0% 38.9% 61.1% |
46 34.8% 34.8% 30.4% |
| Garm Spindler et al. (15) | N PR SD PD |
22 0% 54.5% 45.5% |
42 40% 26.2% 33.3% |
| Goncalves et al. (16) | N PR SD PD |
14 14.3% NR NR |
18 38.9% NR NR |
| Prenen et al. (17) | N CR + PR SD PD |
77 0% + 1.3% 63.6% 57.4% |
122 0.8% + 29.5% 51.6% 18.0% |
| Loupakis et al. (18) | Primary (N) Response Non-response Mets (N) Response Non-response |
53 6% 94% 27 10% 90% |
35 25% 75% 21 41% 59% |
| Lievre et al. (19) | N CR + PR SD PD |
36 0% + 0% 38.9% 61.1% |
78 2.6% + 41.0% 33.3% 23.1% |
CR: complete response; PR: partial response; SD: stable disease; PD: progressive disease; NR: not reported..
Adverse Events and Quality of Life
Adverse events data was reported in both Karapetis et al. (8) and Amado et al. (20) Karapetis et al reported rash during or within 30 days of cetuximab treatment at a rate of 94.9% in WT patients compared to 84.0% in those with the KRAS mutation (p=0.02). Although rates are high in both groups, quality of life (QOL) data from this study (Table XX) suggests that KRAS WT patients confer an improvement in their measures in spite of adverse events whereas patients with the mutation experience deterioration in their QOL. Global health status (including role function, fatigue, nausea, pain, sleep, financial impact, social function, appetite and constipation) derived from the European Organization for Research and Treatment of Cancer (EORTC) questionnaire (QLQ-C30) was significantly better for patients treated with cetuximab + BSC compared to BSC at 8 weeks (mean change in score of 3.2 versus -7.7, p<0.05) and 16 weeks (mean change in score of -0.2 versus -18.1, p<0.05) from baseline among KRAS WT patients only. Among patients with the mutation, the deterioration in QOL was not significantly different between the treated and BSC patients at 8 weeks (mean change in score of -4.7 versus -9.6, p>0.05) and at 16 weeks (mean change in score of -9.5 versus -13.9, p>0.05). It is thought that the benefit that drives the utility in WT patients is likely attributable to a treatment response that mutated patients do not experience (Expert opinion, August 2010).
Adverse events data was also reported by Amado et al. (Table 11) for treatment with panitumumab. Mutated patients received on average 5 infusions and WT patients received a mean of 10 infusions. The grade 3 or 4 adverse event rate (which includes multiple events per patient) was 28% and 44% for mutated and WT patients, respectively. These rates include grade 3 treatment- and integument-related events and grade 3 diarrhea. In addition, there was a 3% rate of hypomagnesemia (any grade) among WT and 1% of grade 2 infusion reactions in the KRAS mutated patients.
Table 11: Adverse Events (Amado et al. 2008).
| Adverse Event Rates | KRAS Mutated (5 infusions) |
KRAS WT (10 infusions) |
|---|---|---|
| Grade 3 or 4 | 28% | 44% |
| Grade 3 treatment related | 12% | 25% |
| Grade 3 integument-related | 13% | 25% |
| Grade 4 integument-related | 1% | 0% |
| Diarrhea any grade | 19% | 24% |
| Grade 3 diarrhea | 1% | 2% |
| Hypomagnesemia any grade | 0% | 3% |
| Grade 2 infusion reaction | 1% | 0% |
Quality of Evidence
The quality of the body of evidence was assessed as high, moderate, low, or very low according to the GRADE Working Group criteria (25) as presented below.
Quality refers to the criteria such as the adequacy of allocation concealment, blinding and follow-up.
Consistency refers to the similarity of estimates of effect across studies. If there are important and unexplained inconsistencies in the results, our confidence in the estimate of effect for that outcome decreases. Differences in the direction of effect, the magnitude of the difference in effect, and the significance of the differences guide the decision about whether important inconsistency exists.
Directness refers to the extent to which the interventions and outcome measures are similar to those of interest.
As stated by the GRADE Working Group, the following definitions of quality were used in grading the quality of the evidence:
| High | Further research is very unlikely to change confidence in the estimate of effect. |
| Moderate | Further research is likely to have an important impact on confidence in the estimate of effect and may change the estimate. |
| Low | Further research is very likely to have an important impact on confidence in the estimate of effect and is likely to change the estimate. |
| Very Low | Any estimate of effect is very uncertain |
Table 12: GRADE Quality of Evidence for the Predictive Value of KRAS Mutation Testing for Treatment with Cetuximab Monotherapy.
| Outcome | Explanation | GRADE |
|---|---|---|
| Design | 4 observational studies, 1 as subgroup analyses of prior drug RCT. | Moderate |
| Quality | Subgroup analysis within RCT is well conducted, within original arms of RCT. | Moderate |
| Consistency | Consistent for PFS, OS, and response rates. | Moderate |
| Directness | Treatments and outcomes of interest were specific to the objectives of this EBA. | Moderate |
| Quality of evidence | Moderate |
Table 13: Factors Affecting GRADE Quality of Evidence for Cetuximab Monotherapy.
| Factor | Explanation | Effect on GRADE |
|---|---|---|
| Risk of Bias | ||
| Study design | Observational studies with one retrospective analysis of KRAS status within context of arms of an RCT. | Moderate |
| Limitations | One retrospective analysis of RCT-based drug trial. Retrospective single arm studies with no comparison group. | Unchanged |
| Indirectness | ||
| Outcomes | Main outcomes were overall survival and progression-free-survival. Studies included these outcomes directly. | Unchanged |
| Patient populations, diagnostic test, comparison test, and indirect comparisons | Study population was advanced colorectal cancer with similar patient characteristics and treatment regimens. | Unchanged |
| Important inconsistency in study results | No inconsistency. | Unchanged |
| Imprecise evidence | Survival (PFS and OS) were sufficiently precise. | Unchanged |
| Publication bias | No known publication bias | Unchanged |
| Quality of evidence | Moderate | |
Table 14: GRADE Quality of Evidence for the Predictive Value of KRAS Mutation Testing for Treatment with Cetuximab-Irinotecan Combination Therapy.
| Outcome | Explanation | GRADE |
|---|---|---|
| Design | 7 observational single arm treatment studies. | Moderate |
| Quality | No comparison group. | Moderate → Low |
| Consistency | Consistent for PFS, OS, and response rates. | Low |
| Directness | Treatments and outcomes of interest were specific to the objectives of this EBA. | Low |
| Quality of evidence | Low |
Table 15: Factors Affecting GRADE Quality of Evidence for Treatment with Cetuximab-Irinotecan Combination Therapy.
| Factor | Explanation | Effect on GRADE |
|---|---|---|
| Risk of Bias | ||
| Study design | Observational studies. | Moderate |
| Limitations | Retrospective single arm studies with no comparison group. | Moderate → Low |
| Indirectness | ||
| Outcomes | Main outcomes were overall survival and progression-free-survival. Studies included these outcomes directly. | Unchanged |
| Patient populations, diagnostic test, comparison test, and indirect comparisons | Study population was advanced colorectal cancer with similar patient characteristics and treatment regimens. | Unchanged |
| Important inconsistency in study results | No inconsistency. | Unchanged |
| Imprecise evidence | Survival (PFS and OS) were sufficiently precise. | Unchanged |
| Publication bias | No known publication bias | Unchanged |
| Quality of evidence | Low | |
Table 16: GRADE Quality of Evidence for the Predictive Value of KRAS Mutation Testing for Panitumumab Monotherapy.
| Outcome | Explanation | GRADE |
|---|---|---|
| Design | 3 observational studies, 1 as subgroup analyses of prior drug RCT. | Moderate |
| Quality | Subgroup analysis within RCT is well conducted, within original arms of RCT. | Moderate |
| Consistency | Consistent for PFS, OS, and response rates. | Moderate |
| Directness | Treatments and outcomes of interest were specific to the objectives of this EBA. | Moderate |
| Quality of evidence | Moderate |
Table 17: Factors Affecting GRADE Quality of Evidence for Panitumumab Monotherapy.
| Factor | Explanation | Effect on GRADE |
|---|---|---|
| Risk of Bias | ||
| Study design | Observational studies. One retrospective analysis of RCT-based drug trial. | Moderate |
| Limitations | One retrospective analysis of RCT-based drug trial. Retrospective single arm studies with no comparison group. | Unchanged |
| Indirectness | ||
| Outcomes | Main outcomes were overall survival and progression-free-survival. Studies included these outcomes directly. | Unchanged |
| Patient populations, diagnostic test, comparison test, and indirect comparisons | Study population was advanced colorectal cancer with similar patient characteristics and treatment regimens. | Unchanged |
| Important inconsistency in study results | No inconsistency. | Unchanged |
| Imprecise evidence | Survival (PFS and OS) were sufficiently precise. | Unchanged |
| Publication bias | No known publication bias | Unchanged |
| Quality of evidence | Moderate | |
Summary of Findings
Cetuximab or Panitumumab Monotherapy
Based on moderate GRADE observational evidence, there is improvement in PFS and OS favouring patients without the KRAS mutation (KRAS wildtype, or KRAS WT) compared to those with the mutation.
Cetuximab-Irinotecan Combination Therapy
There is low GRADE evidence that testing for KRAS may optimize survival benefits in patients without the KRAS mutation (KRAS wildtype, or KRAS WT) compared to those with the mutation.
However, cetuximab-irinotecan combination treatments based on KRAS status discount any effect of cetuximab in possibly reversing resistance to irinotecan in patients with the mutation, as observed effects were lower than for patients without the mutation. Clinical experts have raised concerns about the biological plausibility of this observation and this conclusion would, therefore, be regarded as hypothesis generating.
Existing Guidelines for KRAS Testing in Anti-EGFR Targeted Therapy
Clinical guidelines from Cancer Care Ontario (CCO) published in 2008 (26) and the American Society of Clinical Oncology (ASCO) published in 2009 (27) were identified for this review.
The CCO review reviewed studies to 2008 and conclude, with respect to treatment with cetuximab or panitumumab by KRAS status that there is good evidence that both cetuximab and panitumumab improve PFS and objective response rate compared to BSC alone in chemotherapy refractory patients. This benefit is most pronounced in patients with K-RAS wild-type tumours.
The ASCO provisional clinical opinion, based on a systematic review of the relevant literature, concludes that all patients with metastatic colorectal carcinoma who are candidates for anti-EGFR monoclonal antibody therapy should have their tumour tested for KRAS mutations in a CLIA-accredited laboratory. If KRAS mutation in codon 12 or 13 is detected, then patients with metastatic colorectal carcinoma should not receive anti-EGFR monoclonal antibody therapy as part of their treatment.
Economic Analysis
Disclaimer: The Medical Advisory Secretariat uses a standardized costing method for its economic analyses of interventions. The main cost categories and the associated methods from the province’s perspective are as follows:
Hospital: Ontario Case Costing Initiative cost data are used for in-hospital stay, emergency visit and day procedure costs for the designated International Classification of Diseases (ICD) diagnosis codes and Canadian Classification of Health Interventions procedure codes. Adjustments may be required to reflect accuracy in estimated costs of the diagnoses and procedures under consideration. Due to the difficulties of estimating indirect costs in hospitals associated with a particular diagnosis or procedure, the secretariat normally defaults to considering direct treatment costs only.
Nonhospital: These include physician services costs obtained from the Ontario Schedule of Benefits, laboratory fees from the Ontario Schedule of Laboratory Fees, drug costs from the Ontario Drug Benefit Formulary, and device costs from the perspective of local health care institutions whenever possible or its manufacturer.
Discounting: For cost-effectiveness analyses, a discount rate of 5% is applied as recommended by economic guidelines.
Downstream costs: All numbers reported are based on assumptions on population trends (i.e. incidence, prevalence and mortality rates), time horizon, resource utilization, patient compliance, healthcare patterns, market trends (i.e. rates of intervention uptake or trends in current programs in place in the Province), and estimates on funding and prices. These may or may not be realized by the system or individual institutions and are often based on evidence from the medical literature, standard listing references and educated hypotheses from expert panels. In cases where a deviation from this standard is used, an explanation is offered as to the reasons, the assumptions, and the revised approach. The economic analysis represents an estimate only, based on the assumptions and costing methods that have been explicitly stated above. These estimates will change if different assumptions and costing methods are applied to the analysis.
Study Question
The objective of the current economic analysis was to determine the cost effectiveness of k-RAS oncogene (KRAS) testing for the third-line treatment of (stage IV) metastatic colorectal cancer (mCRC) in Ontario. Third-line treatments used in this analysis consisted of the following drug regimens: cetuximab and panitumumab monoclonal anti-body (MoAb) anti-EGFR monotherapies, and cetuximab used in combination with irinotecan chemotherapy. Note that the comparative cost-effectiveness analysis focuses on the benefit of KRAS genetic testing – comparison was made between strategies showing the benefit of KRAS testing and not necessarily the benefit of drug treatments alone.
Economic Analysis Overview
A decision-analytic cost-utility analysis (CUA) was conducted to evaluate the relative cost-effectiveness of testing for KRAS genetic mutations with subsequent treatment by four options: cetuximab monotherapy, panitumumab monotherapy, cetuximab in combination with irinotecan, and best supportive care (BSC). Best supportive care was defined identically as Jonker et al. 2007 as being: “... those measures designed to provide palliation of symptoms and improve quality of life as much as possible”. (9) As the definition of BSC was synonymous with that defined by Jonker et al. 2007, cost parameters used for BSC as taken from Mittmann et al. 2009 were consistent in terms of the definition of patient population. (28)
The physician and hospital costs for the non-invasive imaging tests were taken from 2009 Ontario Health Insurance Plan (OHIP) and the Ontario Case Costing Initiative (OCCI) administrative databases. (29;30) Costs of drug treatments were taken from publicly listed prices provided by the New Drug Funding Program (NDFP) as administered by Cancer Care Ontario (CCO); values provided were based on consultations with experts.
A budget impact analysis (BIA) was performed assessing the effect of replacing a certain proportion of patients (cases) with the drug regimen of interest; either cetuximab, panitumumab, or cetuximab in combination with irinotecan. The costs and volume of patients presented in this BIA were estimated from expert consultation and CCO data sources from 2009.
Economic Literature Review
A literature search was performed on May 20th, 2010 using OVID MEDLINE, MEDLINE In-Process and Other Non-Indexed Citations, OVID EMBASE, Wiley Cochrane, and EconLit. The range of dates used for the systematic search was: 1996 to Week 2 2010 for MEDLINE, and 1980 to Week 19 2010 for EMBASE. Included studies were those with full economic evaluations describing both costs and consequences of KRAS genetic testing for (stage IV) mCRC patients.
According to the systematic review performed, there were no health economic evaluations found comparing the relative cost-effectiveness of KRAS genetic testing for the population and therapies of interest. However, a CUA was done by Mittmann et al. in 2009 related to the results of the CO-17 trial conducted by Jonker et al. in 2007, which included patients from Ontario. (9;28) Costs and effects (health-related quality-of-life utilities) specific to mCRC third-line patients receiving, separately, cetuximab monotherapy and BSC were taken from Mittmann et al. 2009 and used in the current economic evaluation and decision-analytic model.
Target Population
The target population in this economic evaluation was defined as patients diagnosed with (stage IV) metastatic colorectal cancer (mCRC) from whom cetuximab or panitumumab monotherapies, or cetuximab and irinotecan combination therapy were indicated as third-line treatments. According to Health Canada this indication requires certain restrictions for patients for each treatment option as follows: a) for cetuximab monotherapy, patients must be intolerant to irinotecan, or have failed on both irinotecan- and oxaliplatin-based regimens and have received a fluoropyrimidine (chemotherapy) as previous treatments; b) for panitumumab monotherapy, patients must have failed on fluoropyrimidine-, oxaliplatin-, and irinotecan-containing chemotherapy regimens; and c) for cetuximab and irinotecan combination therapy, patients must be refractory to other irinotecan-based chemotherapy regimens. (31;32)
In addition to the restrictions listed above for the three treatment options considered in the current evaluation, patients must have tested negative for KRAS mutations (i.e. KRAS wild-type). It is important to note that for comparison purposes, certain strategies consisted of treating patients with KRAS mutations; while the benefit of KRAS genetic testing was the focus of the evaluation, treating mCRC patients with KRAS mutations using the three treatments above is not indicated in Ontario.
Perspective
The analytic perspective was that of the Ontario Ministry of Health and Long-Term Care (MOHLTC).
Comparators
The seven strategies listed in Table 18 were used to evaluate the benefit of KRAS genetic testing for third-line treatment(s) of mCRC:
Table 18: Cost-effectiveness strategies evaluating the benefit of KRAS testing.
| Number | Label | Description |
| 0 | Best supportive care (No KRAS test; No treatment) | All patients were treated with BSC (i.e. no MoAb anti-EGFR therapy or chemotherapy) |
| 1a | Cetuximab (Perform KRAS test) | In addition to BSC treatment, patients with KRAS wild-type received cetuximab monotherapy; patients with KRAS mutations received only BSC |
| 1b | Cetuximab (No KRAS test) | All patients received both BSC and cetuximab monotherapy (i.e. this includes both KRAS wild-type and KRAS mutated patients) |
| 2a | Panitumumab (Perform KRAS test) | In addition to BSC treatment, patients with KRAS wild-type received panitumumab monotherapy; patients with KRAS mutations received only BSC |
| 2b | Panitumumab (No KRAS test) | All patients received both BSC and panitumumab monotherapy (i.e. this includes both KRAS wild-type and KRAS mutated patients) |
| 3a | Cetuximab + Irinotecan (Perform KRAS test) | In addition to BSC treatment, patients with KRAS wild-type received cetuximab and irinotecan combination treatment; patients with KRAS mutations received only BSC |
| 3b | Cetuximab + Irinotecan (No KRAS test) | All patients received both BSC and cetuximab and irinotecan combination treatment (i.e. this includes both KRAS wild-type and KRAS mutated patients) |
Time Horizon
The time horizon used in the model was life-time in length (i.e. the model’s patient cohort was followed until death).
Discounting
All costs and effects (quality-adjusted life years, or QALYs) were discounted at a common rate of 5% per annum.(33)
Model Structure
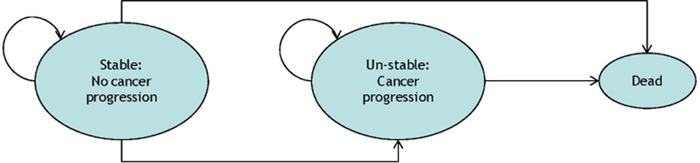
A schematic of the Markov model is shown in Figure 3. Metastatic CRC Patients receiving third-line treatment with cetuximab, panitumumab or cetuximab and irinotecan combination therapy begin the Markov process in the health state labelled “Stable: No cancer progression”. Subsequent state transitions were informed by the median overall survival time (OS) and progression-free survival time (PFS) for transitions to the “Dead” and “Un-stable: Cancer progression” health states, respectively. The model also incorporated adverse events (AEs) specific to each treatment as summarized in the Parameter Estimates section. Note that the cycle length in the Markov model was one month.
Figure 3: KRAS CEA Markov model showing the three health states and possible state transitions.
Outcomes
The outcome of interest was the lifetime-aggregated QALYs (per patient) associated with each strategy.
Resource Use and Costs
Costs were reported in 2009 Canadian dollars (CAD) and were taken from literature, 2009 OHIP and OCCI administrative databases. Table 19 summarizes the drug costs used in current the CUA, where an average value of 1.75 m2 was used for Body Surface Area (BSA) and an average value of 64.1 kg was used for mass (body weight). The CCO prices listed under the “Reference” column were obtained through consultation with experts and publicly listed NDFP drug prices. Note that the cost per “cycle” refers to the one-month cycle used in the Markov model; actual drug cycles are listed under “Drug dose”. The cost of the KRAS genetic test was taken from expert consultations and estimated as being $500 (range $150-$500).
Table 19: Drug costs (CAD) used in the Markov model for third-line treatment of mCRC.
| Treatment | Drug dose | Drug cost | Cost per cycle (month) | Reference |
| Cetuximab | 400 mg/m2 initial; 250 mg/m2 weekly |
$2,345; $1,466 |
$2,345; $5,862 |
CCO (NDFP price); $3.35/mg; BSA=1.75m2 |
| Panitumumab | 6 mg/kg every 2 weeks |
$2,308 | $4,615 | CCO (NDFP price); $6/mg; Average mass=64.1kg |
| Irinotecan | 180 mg/m2 every 2 weeks |
$158 | $315 | CCO (NDFP price); $0.50/mg; BSA=1.75m2 |
Note: NDFP prices listed are public prices derived from consultations with CCO experts.
Other treatment costs were estimated for patient management and the administration of MoAb and chemotherapy. BSC management costs were estimated from Mittmann 2009: approximately $61/month, based on an aggregated average of $1,093 over 18 months per patient. (28) The hospital cost of outpatient administration of MoAb treatment (cetuximab or panitumumab monotherapy) was estimated from FY2008 OCCI data as being $118. This was derived by subtracting the average drug cost per oncology visit ($92; (34)) from the average cost reported for oncology outpatient functional centres ($210; (29)), where patients had: a most responsible diagnosis of chemotherapy (ICD-10-CA code of Z51.1 or Z51.2), and a principal procedure of monoclonal antibody targeted injection (CCI code of 8.NZ.70.HZ-CC). (35;36) In a similar way, the hospital cost of outpatient administration of a MoAb with chemotherapy (cetuximab with irinotecan) was estimated as being $329 per patient (i.e. subtraction of $92 from $421, reported for ICD-10-CA codes of Z51.1 or Z51.2, together with CCI codes of 1.ZZ.35.HA-M0 to 1.ZZ.35.HA-M9).(35;36) Oncology physician costs were estimated as being $132.50 per consultation and $64.05 per additional assessment, related to patient follow up and the treatment of potential adverse events.
The costs for certain AEs were estimated from the literature and hospital administrative databases. The cost of grade 3 or 4 AEs, as defined by criteria published by the National Cancer Institute Common Toxicity Criteria (37), was estimated for the following AEs: rash ($992.50; (28)), pain ($27; (28)), non-neutropenic infection ($2,340; (28)), neutropenia ($4,645; medical oncology inpatient diagnosis code of D70.0; (36)), hypomagnesemia ($318; outpatient diagnosis code of E83.4; (36)), and diarrhea ($357; outpatient dehydration diagnosis code of E86.0 with infusion procedure codes 1.LZ.35.XX-C7, 1.LZ.35.XX-T9 and 1.LZ.35.XX-Z9, where “XX” can be HH, HA or HR; (35)).
Parameter Estimates
The effectiveness of treatments for third-line therapy for mCRC patients was summarized from the literature and shown in Table 20. Adverse events parameters are summarized in Table 21 and show the proportion of patients with the specified AE (grade 3 or 4 as defined by NCI-CTC). Note that the percentages were “normalized” and re-calculated such that the totals sum to 100% for the given list of AEs. Values related to BSC were taken from Jonker et al. 2007 and Karapetis 2008; values for cetuximab-related therapies were taken from Cunningham 2004, Jonker et al. 2007, Karapetis et al. 2008, and Loupakis et al. 2009; and values for panitumumab were taken from Van Cutsem et al. 2008 and Amado et al. 2008.(8;9;20;22;38)
Table 20: Treatment effectiveness parameters used in the Markov model.
| Treatment | KRAS status | Median PFS (months) | Median OS (months) | Reference |
|---|---|---|---|---|
| Best supportive care | WT + Mutated | 1.8 | 4.6 | (9) |
| Best supportive care | WT | 1.9 | 4.8 | (8) |
| Best supportive care | Mutated | 1.8 | 4.6 | (8) |
| Cetuximab | WT + Mutated | 1.9 | 6.1 | (9) |
| Cetuximab | WT | 3.7 | 9.5 | (8) |
| Cetuximab | Mutated | 1.8 | 4.5 | (8) |
| Panitumumab | WT + Mutated | 2.4 | 6.3 | (39) |
| Panitumumab | WT | 3.1 | 8.1 | (20) |
| Panitumumab | Mutated | 1.8 | 4.9 | (20) |
| Cetuximab + Irinotecan | WT + Mutated | 4.1 | 8.6 | (22) |
| Cetuximab + Irinotecan | WT | 5.1 | 14.7 | (38) |
| Cetuximab + Irinotecan | Mutated | 3.8 | 9.7 | (38) |
Note: “WT” denotes KRAS wild-type genetic status and “Mutated” denotes a KRAS genetic mutation.
Table 21: Selected grade 3 or 4 (NCI-CTC) adverse events and treatment-specific percent occurrences (normalized).
| Treatment | Source | Rash | Abdominal Pain | Non-neutro. Infection | Neutropenia | HypoMg | Diarrhea | Total% |
| Best supportive care | Original % from study Re-calculated % from selection of AE’s |
0.4% 1.9% |
15.7% 72.7% |
5.5% 25.5% |
21.6% 100.0% |
|||
| Cetuximab | Original % from study Re-calculated % from selection of AE’s |
11.8% 26.2% |
13.2% 29.3% |
12.8% 28.4% |
5.2% 11.6% |
2.0% 4.4% |
45.0% 100.0% |
|
| Panitumumab | Original % from study Re-calculated % from selection of AE’s |
8.4% 50.0% |
7.4% 44.1% |
1.0% 5.9% |
||||
| Cetuximab + Irinotecan | Original % from study Re-calculated % from selection of AE’s |
9.4% 21.9% |
3.3% 7.6% |
9.4% 21.9% |
21.0% 48.6% |
43.2% 100.0% |
Quality-of-life utility weights used to calculate patient QALYs were based on literature estimates. A baseline utility value of 0.71 was assigned to all patients and was based on utility values reported for mCRC patients treated by only BSC as third-line therapy. (28) A utility increase of 0.07 associated cetuximab, panitumumab or cetuximab with irinotecan treatments was applied to patients for all strategies except BSC, and was calculated from Mittmann et al. using 4-24 week averaged utility values. (28) In a separate sensitivity analysis, the utility increase for panitumumab was estimated at 0.12 and taken from Siena et al.(40)
Sensitivity Analysis
A probabilistic sensitivity analysis (PSA) was conducted to assess the relative percentage cost-effectiveness of the KRAS testing strategies listed in the Comparators section for different willingness-to-pay (WTP) thresholds. The following is a list of strategies considered in the PSA: 0) Best supportive care (No KRAS test; No treatment); 1a) Cetuximab (Perform KRAS test); 2a) Panitumumab (Perform KRAS test); and 3a) Cetuximab + Irinotecan (Perform KRAS test). The range of parameter values used in the PSA is summarized in Table 22.
Table22: Effectiveness, cost and utility parameter ranges used in the PSA analysis.
| Parameter | PFS Range (months) | OS Range (months) | Cost Range (per cycle) | Utility Range |
| Cetuximab - WT Cetuximab - Mutated |
1.40 - 5.40 1.30 - 4.40 |
6.60 - 10.80 4.50 - 9.50 |
$2,931 - $5,862 |
|
| Panitumumab - WT Panitumumab - Mutated |
3.08 - 4.50 1.83 - 1.85 |
8.10 - 10.73 4.90 - 5.55 |
$2,308 - $4,615 |
0.07 - 0.12 |
| Cetuximab + Irinotecan - WT Cetuximab + Irinotecan - Mutated |
3.90 - 8.00 2.25 - 4.70 |
10.80 - 20.80 6.10 - 13.80 |
$158 - $315 |
Note: The cost ranges specified are general drug costs; the range specified for “Cetuximab + Irinotecan” actually refers to the cost of irinotecan only.
Results and Discussion
A summary of the results showing the benefit of KRAS genetic testing is presented in Table 23. All strategies considering KRAS testing for third-line treatment of mCRC disease were found to be cost-effective when compared to the corresponding strategies of no KRAS testing. Specifically, KRAS testing was found to be cost-effective for cetuximab monotherapy (at a WTP threshold of $54,802); KRAS testing was found to be cost-effective for panitumumab monotherapy (at a WTP threshold of $47,795); and KRAS testing was found to be cost-effective for cetuximab with irinotecan combination therapy (at a WTP threshold of $42,701).
Table 23: Cost-effectiveness of KRAS genetic testing - treatment-specific results.
| Strategy | Cost | Incremental Cost | Effect (QALY) | Incremental Effect | ICER ($/QALY) |
| Cost-effectiveness of KRAS testing for cetuximab monotherapy | |||||
| 0: BSC (No KRAS test; No treatment) | $1,414 | 0.7455 | |||
| 1a: Cetuximab (Perform KRAS test) | $18,305 | $16,891 | 1.0537 | 0.3082 | 54,802 |
| 1b: Cetuximab (No KRAS test) | $29,399 | $11,094 | 1.0447 | -0.0090 | (Dominated) |
| Cost-effectiveness of KRAS testing for panitumumab monotherapy | |||||
| 0: BSC (No KRAS test; No treatment) | $1,414 | 0.7455 | |||
| 2a: Panitumumab (Perform KRAS test) | $12,236 | $10,821 | 0.9719 | 0.2264 | 47,795 |
| 2b: Panitumumab (No KRAS test) | $20,424 | $8,188 | 0.9985 | 0.0266 | 308,236 |
| Cost-effectiveness of KRAS testing for cetuximab with irinotecan combination therapy | |||||
| 0: BSC (No KRAS test; No treatment) | $1,414 | 0.7455 | |||
| 3a: Cetuximab + Irinotecan (Perform KRAS test) | $23,373 | $21,959 | 1.2596 | 0.5141 | 42,710 |
| 3b: Cetuximab + Irinotecan (No KRAS test) | $44,798 | $21,425 | 1.3907 | 0.1311 | 163,396 |
When all treatment strategies were considered in the CUA simultaneously (Table24), performing KRAS testing for cetuximab with irinotecan combination therapy was the preferred cost-effective option (at a WTP threshold of $42,710). For a WTP threshold of $50K, this strategy yielded the greatest effect (QALYs) and had the lowest ICER value. If a higher WTP threshold is considered, the strategy of not testing for KRAS genetic mutations is cost-effective at a WTP threshold of $163,396. This latter result was due to the combination treatment contributing QALYs (having beneficial effect) to both the KRAS wild-type and mutated patient groups. However, further research may be needed to determine the exact benefit of using cetuximab with irinotecan therapy on mCRC patients (both KRAS wild-type and mutated).
Table 24: Relative cost-effectiveness of KRAS genetic testing for all treatment strategies.
| Strategy | Cost | Incremental Cost | Effect (QALY) | Incremental Effect | ICER ($/QALY) |
| 0: BSC (No KRAS test; No treatment) | $1,414 | 0.7455 | |||
| 2a: Panitumumab (Perform KRAS test) | $12,236 | $10,821 | 0.9719 | 0.2264 | (Ext.Dom.) |
| 1a: Cetuximab (Perform KRAS test) | $18,305 | $6,069 | 1.0537 | 0.0818 | (Ext.Dom.) |
| 2b: Panitumumab (No KRAS test) | $20,424 | $2,119 | 0.9985 | -0.0552 | (Dominated) |
| 3a: Cetuximab + Irinotecan (Perform KRAS test) | $23,373 | $5,068 | 1.2596 | 0.2059 | 42,710 |
| 1b: Cetuximab (No KRAS test) | $29,399 | $6,026 | 1.0447 | -0.2149 | (Dominated) |
| 3b: Cetuximab + Irinotecan (No KRAS test) | $44,798 | $21,425 | 1.3907 | 0.1311 | 163,396 |
Note: “Ext. Dom.” represents strategies which are ruled out due to extended dominance.
Results of the PSA showed that for all strategies involving KRAS genetic testing, cetuximab with irinotecan combination therapy was the cost-effective option for increasing values of WTP. For lower WTP values, the probability of specific KRAS testing strategies being cost-effective varied. At a WTP of $50K, the probabilities of cetuximab monotherapy, panitumumab monotherapy and cetuximab with irinotecan combination therapy being cost-effective were approximately 14%, 44% and 42%, respectively. The strategy of not performing the KRAS test and treating patients with BSC alone was not cost-effective (zero probability) for WTP values greater than $45K.
Budget Impact Analysis
The BIA calculation of the current CUA was based on the number of drug claims reported by the NDFP and through consultations with experts. The number of mCRC patients using panitumumab as third-line therapy in Ontario in FY2009 was 145 according to the NDFP. The corresponding number of cetuximab with irinotecan patients was about 38, however, the number of cetuximab monotherapy patients was unavailable as this treatment option is not funded by the NDFP and is available only out-of-country. It was assumed (expert consultation) that the distribution of treatments for third-line treatment of mCRC was approximately 30% for cetuximab, 20% for panitumumab and 30% for cetuximab with irinotecan combination therapy (and 30% for BSC for a total of 100%). Using these proportions, it was estimated that the number of patients using cetuximab monotherapy in 2009 was 218.
Using the average cost of treatments reported in Tables 23 and 24, the impact of having 50% of patients on any given therapy was calculated for the BIA. The results are summarized in Table 25, where the “estimated FY2009 costs” were calculated from the current distribution of mCRC patients using third-line therapy (i.e. 30% cetuximab, 20% panitumumab, 30% cetuximab with irinotecan), and the “Re-calculated FY2009” costs were based on the re-calculated patient proportions or number of patients for the impact analysis. The effect of shifting patients, where 50% of mCRC patients would use the indicated third-line therapy in Table 25, was estimated as the simple difference between the estimated costs given the current distribution and the estimated (re-calculated) costs given the new distribution. As a result, estimates of the yearly cost savings (if any) of the different distributions of patients on a given third-line therapy were: a yearly increase of $0.07M for cetuximab, a yearly decrease of $1.76M for panitumumab, and a yearly increase of $1.63M for cetuximab with irinotecan combination therapy.
Table 25: Cost differences between the current distribution of treatments and future 50%-distributions.
| Strategy | Patients (%) | Re-calculated patients (N) | Estimated FY2009 costs | Re-calculated FY2009 costs | Impact (cost difference) |
| Assuming 50% of patients are using cetuximab monotherapy | |||||
| 1a: Cetuximab (Perform KRAS test) | 50% | 363 | $3.98M | $6.64M | $2.65M |
| 2a: Panitumumab (Perform KRAS test) | 10% | 73 | $1.77M | $0.89M | -$0.89M |
| 3a: Cetuximab + Irinotecan (Perform KRAS test) | 10% | 73 | $3.39M | $1.69M | -$1.69M |
| Total | 70% | 508 | $9.14M | $9.22M | $0.07M |
| Assuming 50% of patients are using panitumumab monotherapy | |||||
| 1a: Cetuximab (Perform KRAS test) | 12% | 87 | $3.98M | $1.59M | -$2.39M |
| 2a: Panitumumab (Perform KRAS test) | 50% | 363 | $1.77M | $4.44M | -$2.66M |
| 3a: Cetuximab + Irinotecan (Perform KRAS test) | 8% | 58 | $3.39M | $1.38M | -$2.03M |
| Total | 70% | 508 | $9.14M | $7.38M | -$1.76M |
| Assuming 50% of patients are using cetuximab with irinotecan combination therapy | |||||
| 1a: Cetuximab (Perform KRAS test) | 12% | 87 | $3.98M | $1.59M | -$2.39M |
| 2a: Panitumumab (Perform KRAS test) | 8% | 58 | $1.77M | $0.71M | -$1.06M |
| 3a: Cetuximab + Irinotecan (Perform KRAS test) | 50% | 363 | $3.39M | $8.47M | $5.08M |
| Total | 70% | 508 | $9.14 M | $10.77M | $1.63M |
Conclusions
KRAS status is predictive of outcomes in cetuximab and panitumumab monotherapy, and in cetuximab-irinotecan combination therapy.
While KRAS testing is cost-effective for all strategies considered, it is not equally cost-effective for all treatment options.
Appendix 1: Literature Search Strategies
Search date: May 18, 2010
Databases searched: Databases searched: OVID MEDLINE, MEDLINE In-Process and Other Non-Indexed Citations, OVID EMBASE, Wiley Cochrane, CINAHL, Centre for Reviews and Dissemination/International Agency for Health Technology Assessment
Database: Ovid MEDLINE(R) <1996 to May Week 1 2010>
Search Strategy:
--------------------------------------------------------------------------------
exp Colorectal Neoplasms/ or crc.ti,ab. (67094)
((colorectal or colon or rectal or rectum) adj2 (cancer* or carcinoma* or neoplas* or adenocarcinoma* or tumo?r*)).ti,ab. (60335)
1 or 2 (79670)
exp Genes, ras/ or exp ras Proteins/ (13387)
(Therascreen or k-ras or kras or Kirsten-RAS or Kirsten rat sarcoma 2 viral oncogene).af. (4204)
(cetuximab or erbitux or panitumumab or vectibix or abx-egf).af. (1873)
or/4-6 (16083)
3 and 7 (2515)
limit 8 to (english language and humans and yr=“2009 -Current”) (384)
limit 9 to (case reports or comment or editorial or letter) (59)
9 not 10 (325)
from 11 keep 1-325 (325)
Database: EMBASE <1980 to 2010 Week 19>
Search Strategy:
--------------------------------------------------------------------------------
exp colon tumor/ (102815)
((colorectal or colon or rectal or rectum) adj2 (cancer* or carcinoma* or neoplas* or adenocarcinoma* or tumo?r*)).ti,ab. (80141)
1 or 2 (120553)
exp oncogene k ras/ (3703)
exp K ras protein/ (2039)
(Therascreen or k-ras or kras or Kirsten-RAS or Kirsten rat sarcoma 2 viral oncogene).af. (6807)
exp cetuximab/ (7002)
exp panitumumab/ (1777)
(cetuximab or erbitux or panitumumab or vectibix or abx-egf).af. (7310)
or/4-9 (13551)
3 and 10 (5122)
limit 11 to (human and english language and yr=“2009 -Current”) (1010)
Appendix 2: Study and Patient Characteristics
Cetuximab Monotherapy
| Study | Patient and Sample Characteristics | Treatments Received |
| Karapetis, 2008 | N=394 of 572 pts (68.9%) in CO. 17 RCT of cetux + BSC vs. BSC. Advanced crc in whom all chemo had failed and no other standard anticancer therapy available. Kras mutation 42.3%. PCR: direct sequencing 2. |
IV loading dose of 400 mg/sq m body-surface area, administered over 120 mins, on day 1, followed by infusion of 250 mg/sq m, administered over 60 mins, weekly. Continued until disease progression or intolerable toxicity. Tumour response or progression assessed every 8 wks. |
| Lurje, 2008 | N=130 of 346 pts (38%) in open-label multi-center study. Histopathologically confirmed metastatic crc who had failed at least 2 prior chemo or an adjuvant therapy plus one chemo regimen(s). Kras mutation 32.3%. PCR: direct sequencing 12/13. |
2 wks initial treatment followed by formal skin rash evaluation. Treatment continued in absence of intolerable or progressive disease, defined as at least 25% increase in measurable disease, unequivocal growth of existing nonmeasurable disease, appearance of one or more new lesions, or reappearance of old lesions assessed every 6 wks based on modified WHO criteria. |
| Cappuzzo, 2008 | N=80 of 85 pts. with chemo-refractory (including irinotecan and oxaliplatin) metastatic crc exposed to cetuximab therapy and previously evaluated for EGFR. Kras mutation 52.5% (42/80). PCR: surveyor ® DNA endonuclease. | 400 mg/sq m, followed by weekly infusion of 250 mg/sq m. Disease assessment every 2 mos. based on RECIST criteria. |
| Khambata-Ford, 2007 | N=80 of 110 pts. with metastatic crc having received at least one prior chemo regimen for advanced disease or refused prior treatment. At least 18 yrs of age with life expectancy of 4 mos, ECOG score of 0 to 2 and standard lab values within normal limits. Kras mutation 37.5%. PCR: direct sequencing 2. |
Standard dosing regimen (400 mg/sq m loading dose, followed by 250 mg/sq m weekly) for first 3 wks; thereafter, pts eligible for dose escalation every 3 wks to maximum of 400 mg/sq m if less than grade 3 rash. Tumour response assessed every 9 wks (one cycle of therapy) based on modified WHO criteria. |
Cetuximab-Irinotecan Combination Therapy
| Study | Patient and Sample Characteristics | Treatments Received |
| Bibeau, 2009 | N=64 of 69 pts. (92.8%) with histologically proven crc,. Irinotecan resistant. 78% had at least 2 previous lines for metastatic disease. Kras mutation 42.2%. (27/64) PCR: multiplex primer extension method sequencing. |
Standard cetuximab dosage + irinotecan. Tumor response evaluated every 2 to 3 months by RECIST criteria. |
| Oden-Gangloff, 2009 | N=64 chemorefractory metastatic crc (90% irinotecan refractory). 44 pts from Di Fiore 2007 study. Kras mutation 28% (19/64). PCR: multiplex primer extension method sequencing. | Cetux + irinotecan (n=62), cetux + irinotecan + oxaliplatin-based chemo (n=1), cetuximab alone (n=1). Tumor response according to response criteria in solid tumors. |
| Garm Spindler, 2009 | N=64 of 71 pts (90.1%) with histologically confirmed metastatic crc referred for 3rd line cetux + irinotecan. Refractory to prior fluoropyrimidine, oxaliplatin, and irinotecan, age over 18 yrs. Kras mutation 34%.(22/64). PCR: direct sequencing (DxS) with PCR kit. |
Irinotecan 350 mg/sq m every 3 wks + cetuximab 400 mg/sq m loading dose followed by weekly 250 mg/sq m, until disease progression as assessed by RECIST. |
| Goncalves, 2008 | N=32 EGFR positive metastatic crc. Kras mutation 43.8% (14/32)codons 12/13. PCR: direct sequencing. |
In 26 pts: cetux (loading dose 400 mg/sq m, followed by 250 mg/sq m weekly until progression) + irinotecan (180 mg/sq m every other week). 6 pts from specific trials evaluating dose escalation of cetux mono-therapy (3), cetux+FOLFIRI as 1st line (2), or 2nd line after failure with fluoropyrimidine/oxaliplatin (1). Tumor evaluation at 4 wks, then every 2 mos for 6 mos, then every 3 mos until disease progression, by WHO criteria. |
| Prenen, 2009 | N=199 of 200 (99.5%) irinotecan-refractory pts. with metastatic crc. 184 pts. on cetux+ irinotecan, 16 on cetux alone. Pts. pooled from 4 clinical trials (Babel, Everest, Bond salvage) and outside trials in same setting. Kras mutation 38.7% (77/199). PCR: allele-specific PCR. |
Dosages not reported. May be similar to De Rook et al. 2008. Tumor response assessed by RECIST. |
| Loupakis, 2009 | N=102 pts with irinotecan-refractory metastatic crc whose disease had progressed during or within 3 mos after treatment with an irintotecan-based regimen. 18% received cetux-based therapy as 2nd line, 82% treated after failure of at least 2 line of chemo. Kras tests available on 88/96 primary tumours, 48/59 mets. Kras mutation 40.0% (35/88). PCR: direct sequencing 12/13. | Cetux + irinotecan reported, no dosages. Response evaluated every 8 wks based on RECIST criteria. |
| Lievre, 2008 | N=114 of 234 (48.7%) metastatic crc. 89 as independent series from 6 centers, then pooled pts. from Lievre 2006. Cetux mono (n=2), cetux+irinotecan (n=88), cetux + irinotecan+FOLFIRI (n=10). Kras mutation 27% (24/89). PCR: TaqMan® allelic discrimination assay. | Dosages not reported. Disease assessment based on RECISTcriteria. |
Panitumumab Monotherapy
| Study | Patient and Sample Characteristics | Treatments Received |
| Amado, 2008 | N=427 of 463 pts (92%) in Van Cutsem 2007 RCT of panitum + BSC vs. BSC. Metastatic crc with EGFR expression in ≥1% of tumor cells and documented evidence of disease progression after failure with fluoropyrimidines and prespecified exposure to oxaliplatin and irinotecan. Race: Caucasian. Kras mutation 43% (184/427). PCR: allele-specific PCR. |
6 mg/kg + BSC every 2 wks or BSC. BSC could receive panitum after disease progression. Tumor status assessed every 4 to 8 wks from week 8 until disease progression using RECIST criteria. |
| Freeman, 2008 | N=62 of 533 pts (11.6%) with metastatic crc from 3 phase II clinical trials: 15/182 Berlin et al. 2006, 12/203 Mitchell et al. 2007, 35/148 Hecht et al. 2007. Radiographic or pathologic confirmation of metastatic crc, treatment refractory (disease progression after fluoro-pyrimidine-, oxaliplatin-, and/or irinotecan-containing chemo) Race: 75%-80% Caucasian. Kras mutation 38.7% (24/62). PCR: direct sequencing. |
Two studies: panitum 6 mg/kg every 2wks. One study: 2.5 mg/kg weekly. Tumor assessments at 8 or 9 wks and at scheduled time points, based on RECIST or WHO criteria. |
| Muro, 2009 | N=24: 16/52 (30.8%) metastatic crc pts (Muro et al. 2008) from phase I study with EGFR expression in ≥1% of tumor cells and disease progression during or after fluoro-pyrimidine-, oxaliplatin-, and/or irinotecan-containing chemo. PLUS 8 pts. (Doi et al. 2009) from phase I study. Race: Asian (Japanese). Kras mutation 42.0%. (10/24). PCR: DxS (direct sequencing?) |
Panitum IV infusion of 6 mg/kg every 2 wks over 60 min, until disease progression or intolerable toxicity. Tumor response assessed at 8, 12, 16, 24, 32, 40, 48 wks and every 8 weeks thereafter until disease progression. . |
Suggested Citation
This report should be cited as follows: Medical Advisory Secretariat. KRAS testing for anti-EGFR therapy in advanced colorectal cancer: an evidence-based and economic analysis. Ont Health Technol Assess Ser [Internet]. 2010 Dec [cited YYYY MM DD]; 10(25) 1-49. Available from: http://www.health.gov.on.ca/english/providers/program/mas/tech/reviews/pdf/kras20101213.pdf
Permission Requests
All inquiries regarding permission to reproduce any content in the Ontario Health Technology Assessment Series should be directed to MASinfo.moh@ontario.ca.
How to Obtain Issues in the Ontario Health Technology Assessment Series
All reports in the Ontario Health Technology Assessment Series are freely available in PDF format at the following URL: www.health.gov.on.ca/ohtas.
Print copies can be obtained by contacting MASinfo.moh@ontario.ca.
Conflict of Interest Statement
All analyses in the Ontario Health Technology Assessment Series are impartial and subject to a systematic evidence-based assessment process. There are no competing interests or conflicts of interest to declare.
Peer Review
All Medical Advisory Secretariat analyses are subject to external expert peer review. Additionally, the public consultation process is also available to individuals wishing to comment on an analysis prior to finalization. For more information, please visit
http://www.health.gov.on.ca/english/providers/program/ohtac/public_engage_overview.html.
Contact Information
The Medical Advisory Secretariat
Ministry of Health and Long-Term Care
20 Dundas Street West, 10th floor
Toronto, Ontario
CANADA
M5G 2C2
Email: MASinfo.moh@ontario.ca
Telephone: 416-314-1092
ISSN 1915-7398 (Online)
ISBN 978-1-4435-4831-1 (PDF)
About the Medical Advisory Secretariat
The Medical Advisory Secretariat is part of the Ontario Ministry of Health and Long-Term Care. The mandate of the Medical Advisory Secretariat is to provide evidence-based policy advice on the coordinated uptake of health services and new health technologies in Ontario to the Ministry of Health and Long-Term Care and to the healthcare system. The aim is to ensure that residents of Ontario have access to the best available new health technologies that will improve patient outcomes.
The Medical Advisory Secretariat also provides a secretariat function and evidence-based health technology policy analysis for review by the Ontario Health Technology Advisory Committee (OHTAC).
The Medical Advisory Secretariat conducts systematic reviews of scientific evidence and consultations with experts in the health care services community to produce the Ontario Health Technology Assessment Series.
About the Ontario Health Technology Assessment Series
To conduct its comprehensive analyses, the Medical Advisory Secretariat systematically reviews available scientific literature, collaborates with partners across relevant government branches, and consults with clinical and other external experts and manufacturers, and solicits any necessary advice to gather information. The Medical Advisory Secretariat makes every effort to ensure that all relevant research, nationally and internationally, is considered for the systematic literature reviews conducted.
The information gathered is the foundation of the evidence to determine if a technology is effective and safe for use in a particular clinical population or setting. Information is collected to understand how a new technology fits within current practice and treatment alternatives. Details of the technology’s diffusion into current practice and input from practising medical experts and industry add important information to the review of the provision and delivery of the health technology in Ontario. Information concerning the health benefits; economic and human resources; and ethical, regulatory, social and legal issues relating to the technology assist policy makers to make timely and relevant decisions to optimize patient outcomes.
If you are aware of any current additional evidence to inform an existing evidence-based analysis, please contact the Medical Advisory Secretariat: MASinfo.moh@ontario.ca. The public consultation process is also available to individuals wishing to comment on an analysis prior to publication. For more information, please visit http://www.health.gov.on.ca/english/providers/program/ohtac/public_engage_overview.html.
Disclaimer
This evidence-based analysis was prepared by the Medical Advisory Secretariat, Ontario Ministry of Health and Long-Term Care, for the Ontario Health Technology Advisory Committee and developed from analysis, interpretation, and comparison of scientific research and/or technology assessments conducted by other organizations. It also incorporates, when available, Ontario data, and information provided by experts and applicants to the Medical Advisory Secretariat to inform the analysis. While every effort has been made to reflect all scientific research available, this document may not fully do so. Additionally, other relevant scientific findings may have been reported since completion of the review. This evidence-based analysis is current to the date of the literature review specified in the methods section. This analysis may be superseded by an updated publication on the same topic. Please check the Medical Advisory Secretariat Website for a list of all evidence-based analyses: http://www.health.gov.on.ca/ohtas.
List of Abbreviations
- AE
Adverse event
- AUC
Area under the curve
- BIA
Budget impact analysis
- BSC
Best supportive care
- BSA
Body surface area
- CAD
Canadian dollars
- CCO
Cancer Care Ontario
- CEA
Cost-effectiveness analysis
- CUA
Cost-utility analysis
- CI
Confidence interval(s)
- EBA
Evidence-based analysis
- EGFR
Epidermal growth factor receptor; cell-surface receptor for members of the epidermal growth factor family
- HTA
Health technology assessment
- HR
Hazard ratio
- KRAS
V-Ki-ras2 Kirsten rat sarcoma viral oncogene homolog (protein coded by KRAS gene); k-RAS oncogene
- KRAS WT
KRAS wildtype
- MAS
Medical Advisory Secretariat
- mCRC
Metastatic colorectal cancer
- MoAb
Monoclonal anti-body (for anti-EGFR treatment / as EGFR inhibitor)
- MOHLTC
Ontario Ministry of Health and Long-Term Care
- NCI-CTC
National Cancer Institute Common Toxicity Criteria
- NDFP
New Drug Funding Program
- OHTAC
Ontario Health Technology Advisory Committee
- OR
Odds ratio
- OS
Overall survival
- PCR
Polymerase chain reaction
- PFS
Progression-free survival
- PSA
Probabilistic sensitivity analysis
- QALY
Quality-adjusted life year
- RCT
Randomized controlled trial
- RR
Relative risk
- QOL
Quality of life
- SD
Standard deviation
- WTP
Willingness-to-pay
References
- 1.National Institute for Health and Clinical Excellence (NHS-NICE) Bevacizumab and cetuximab for the treatment of metastatic colorectal cancer. 2009. [[cited: 2010 Oct 26]]. [Internet]. London, UK: National Institute for Health and Clinical Excellence (NHS-NICE) 34 p. NICE technology appraisal guidance 118. Available from: http://www.nice.org.uk/nicemedia/pdf/TA118Guidance.pdf .
- 2.Terasawa T, Dahabreh I, Castaldi PJ, Trikalinos TA. Systematic reviews on selected pharmacogenetic tests for cancer treatment: CYP2D6 for tamoxifen in breast cancer, KRAS for anti-EGFR antibodies in colorectal cancer, and BCR-ABL1 for tyrosine kinase inhibitors in chronic myeloid leukemia. Rockville, Maryland: Agency for Healthcare Research and Quality (AHRQ) 2010. Jul 6. [[cited: 2010 Oct 26]]. [Internet] 169 p. Project ID: GEN0609. Available from: http://www.cms.gov/DeterminationProcess/downloads/id76TA.pdf . [PubMed]
- 3.Artale S, Sartore-Bianchi A, Veronese SM, Gambi V, Sarnataro CS, Gambacorta M, et al. Mutations of KRAS and BRAF in primary and matched metastatic sites of colorectal cancer. J Clin Oncol. 2008;26(25):4217–9. doi: 10.1200/JCO.2008.18.7286. [DOI] [PubMed] [Google Scholar]
- 4.Soulieres D, Greer W, Magliocco AM, Huntsman D, Young S, Tsao MS, et al. KRAS mutation testing in the treatment of metastatic colorectal cancer with anti-EGFR therapies. Curr Oncol. 2010;17(Suppl 1):S31–S40. doi: 10.3747/co.v17is1.614. [DOI] [PMC free article] [PubMed] [Google Scholar]
- 5.Hozo SP, Djulbegovic B, Hozo I. Estimating the mean and variance from the median, range, and the size of a sample. BMC Med Res Methodol. 2005;5(1):13. doi: 10.1186/1471-2288-5-13. [DOI] [PMC free article] [PubMed] [Google Scholar]
- 6.Technology Evaluation Centre (TEC). KRAS mutations and epidermal growth factor receptor inhibitor therapy in metastatic colorectal cancer. Chicago, Illinois: TEC Blue Cross and Blue Shield Association. 2009. [[cited: 2010 Dec 16]]. [Internet] 20 p. Vol. 23, No. 6. Available from: http://www.bcbs.com/blueresources/tec/vols/23/23_06.pdf . [PubMed]
- 7.Goodman C. Literature searching and evidence interpretation for assessing health care practices. Stockholm, Sweden: The Swedish Council on Technology Assessment in Health Care. 1993 doi: 10.1017/s0266462300008321. 81 p. SBU-Report No 119E. [DOI] [PubMed] [Google Scholar]
- 8.Karapetis CS, Khambata-Ford S, Jonker DJ, O′Callaghan CJ, Tu D, Tebbutt NC, et al. K-ras mutations and benefit from cetuximab in advanced colorectal cancer. N Engl J Med. 2008;359(17):1757–65. doi: 10.1056/NEJMoa0804385. [DOI] [PubMed] [Google Scholar]
- 9.Jonker DJ, O′Callaghan CJ, Karapetis CS, Zalcberg JR, Tu D, Au HJ, et al. Cetuximab for the treatment of colorectal cancer. N Engl J Med. 2007;357(20):2040–8. doi: 10.1056/NEJMoa071834. [DOI] [PubMed] [Google Scholar]
- 10.Lurje G, Nagashima F, Zhang W, Yang D, Chang HM, Gordon MA, et al. Polymorphisms in cyclooxygenase-2 and epidermal growth factor receptor are associated with progression-free survival independent of K-ras in metastatic colorectal cancer patients treated with single-agent cetuximab. Clin Cancer Res. 2008;14(23):7884–95. doi: 10.1158/1078-0432.CCR-07-5165. [DOI] [PubMed] [Google Scholar]
- 11.Cappuzzo F, Varella-Garcia M, Finocchiaro G, Skokan M, Gajapathy S, Carnaghi C, et al. Primary resistance to cetuximab therapy in EGFR FISH-positive colorectal cancer patients. Br J Cancer. 2008;99(1):83–9. doi: 10.1038/sj.bjc.6604439. [DOI] [PMC free article] [PubMed] [Google Scholar]
- 12.Khambata-Ford S, Garrett CR, Meropol NJ, Basik M, Harbison CT, Wu S, et al. Expression of epiregulin and amphiregulin and K-ras mutation status predict disease control in metastatic colorectal cancer patients treated with cetuximab. J Clin Oncol. 2007;25(22):3230–7. doi: 10.1200/JCO.2006.10.5437. [DOI] [PubMed] [Google Scholar]
- 13.Bibeau F, Lopez-Crapez E, Di FF, Thezenas S, Ychou M, Blanchard F, et al. Impact of Fc{gamma}RIIa-Fc{gamma}RIIIa polymorphisms and KRAS mutations on the clinical outcome of patients with metastatic colorectal cancer treated with cetuximab plus irinotecan. J Clin Oncol. 2009;27(7):1122–9. doi: 10.1200/JCO.2008.18.0463. [DOI] [PubMed] [Google Scholar]
- 14.Oden-Gangloff A, Di FF, Bibeau F, Lamy A, Bougeard G, Charbonnier F, et al. TP53 mutations predict disease control in metastatic colorectal cancer treated with cetuximab-based chemotherapy. Br J Cancer. 2009;100(8):1330–5. doi: 10.1038/sj.bjc.6605008. [DOI] [PMC free article] [PubMed] [Google Scholar]
- 15.Garm Spindler KL, Pallisgaard N, Rasmussen AA, Lindebjerg J, Andersen RF, Cruger D, et al. The importance of KRAS mutations and EGF61A>G polymorphism to the effect of cetuximab and irinotecan in metastatic colorectal cancer. Ann Oncol. 2009;20(5):879–84. doi: 10.1093/annonc/mdn712. [DOI] [PubMed] [Google Scholar]
- 16.Goncalves A, Esteyries S, Taylor-Smedra B, Lagarde A, Ayadi M, Monges G, et al. A polymorphism of EGFR extracellular domain is associated with progression free-survival in metastatic colorectal cancer patients receiving cetuximab-based treatment. BMC Cancer. 2008;8:169. doi: 10.1186/1471-2407-8-169. [DOI] [PMC free article] [PubMed] [Google Scholar]
- 17.Prenen H, De SJ, Jacobs B, De RW, Biesmans B, Claes B, et al. PIK3CA mutations are not a major determinant of resistance to the epidermal growth factor receptor inhibitor cetuximab in metastatic colorectal cancer. Clin Cancer Res. 2009;15(9):3184–8. doi: 10.1158/1078-0432.CCR-08-2961. [DOI] [PubMed] [Google Scholar]
- 18.Loupakis F, Pollina L, Stasi I, Ruzzo A, Scartozzi M, Santini D, et al. PTEN expression and KRAS mutations on primary tumors and metastases in the prediction of benefit from cetuximab plus irinotecan for patients with metastatic colorectal cancer. J Clin Oncol. 2009;27(16):2622–9. doi: 10.1200/JCO.2008.20.2796. [DOI] [PubMed] [Google Scholar]
- 19.Lievre A, Bachet JB, Boige V, Cayre A, Le CD, Buc E, et al. KRAS mutations as an independent prognostic factor in patients with advanced colorectal cancer treated with cetuximab. J Clin Oncol. 26. 2008;(3):374–9. doi: 10.1200/JCO.2007.12.5906. [DOI] [PubMed] [Google Scholar]
- 20.Amado RG, Wolf M, Peeters M, Van CE, Siena S, Freeman DJ, et al. Wild-type KRAS is required for panitumumab efficacy in patients with metastatic colorectal cancer. J Clin Oncol. 2008;26(10):1626–34. doi: 10.1200/JCO.2007.14.7116. [DOI] [PubMed] [Google Scholar]
- 21.Van CE, Peeters M, Siena S, Humblet Y, Hendlisz A, Neyns B, et al. Open-label phase III trial of panitumumab plus best supportive care compared with best supportive care alone in patients with chemotherapy-refractory metastatic colorectal cancer. J Clin Oncol. 2007;25(13):1658–64. doi: 10.1200/JCO.2006.08.1620. [DOI] [PubMed] [Google Scholar]
- 22.Cunningham D, Humblet Y, Siena S, Khayat D, Bleiberg H, Santoro A, et al. Cetuximab monotherapy and cetuximab plus irinotecan in irinotecan-refractory metastatic colorectal cancer. N Engl J Med. 2004;351(4):337–45. doi: 10.1056/NEJMoa033025. [DOI] [PubMed] [Google Scholar]
- 23.Freeman DJ, Juan T, Reiner M, Hecht JR, Meropol NJ, Berlin J, et al. Association of K-ras mutational status and clinical outcomes in patients with metastatic colorectal cancer receiving panitumumab alone. Clin Colorectal Cancer. 2008;7(3):184–90. doi: 10.3816/CCC.2008.n.024. [DOI] [PubMed] [Google Scholar]
- 24.Muro K, Yoshino T, Doi T, Shirao K, Takiuchi H, Hamamoto Y, et al. A phase 2 clinical trial of panitumumab monotherapy in Japanese patients with metastatic colorectal cancer. Jpn J Clin Oncol. 2009;39(5):321–6. doi: 10.1093/jjco/hyp016. [DOI] [PubMed] [Google Scholar]
- 25.Atkins D, Best D, Briss PA, Eccles M, Falck-Ytter Y, Flottorp S, et al. Grading quality of evidence and strength of recommendations. BMJ. 2004;328(7454):1490. doi: 10.1136/bmj.328.7454.1490. [DOI] [PMC free article] [PubMed] [Google Scholar]
- 26.Jonker D, Biagi J, Haynes AE. The use of epidermal growth factor receptor inhibitors in advanced colorectal cancer. [[cited: 2010 Dec 16]];Ontario: Cancer Care Ontario. 2008 Sep 7 :33 p. [Internet] CED-CCO Special Advice Report #8. Available from: http://www.cancercare.on.ca/common/pages/UserFile.aspx?serverId=6&path=/File%20Database/CCO%20Files/PEBC/pebcced8f.pdf . [Google Scholar]
- 27.Allegra CJ, Jessup JM, Somerfield MR, Hamilton SR, Hammond EH, Hayes DF, et al. American Society of Clinical Oncology provisional clinical opinion: testing for KRAS gene mutations in patients with metastatic colorectal carcinoma to predict response to anti-epidermal growth factor receptor monoclonal antibody therapy. J Clin Oncol. 2009;27(12):2091–6. doi: 10.1200/JCO.2009.21.9170. [DOI] [PubMed] [Google Scholar]
- 28.Mittmann N, Au HJ, Tu D, O′Callaghan CJ, Isogai PK, Karapetis CS, et al. Prospective cost-effectiveness analysis of cetuximab in metastatic colorectal cancer: evaluation of National Cancer Institute of Canada Clinical Trials Group CO.17 trial. J Natl Cancer Inst. 2009;101(17):1182–92. doi: 10.1093/jnci/djp232. [DOI] [PubMed] [Google Scholar]
- 29.Ontario Case Costing Initiative. Costing Analysis Tool (CAT) [[updated 2010; cited 2010 Aug 8]]. [Internet] Available from: http://www.occp.com/
- 30.Ontario Ministry of Health and Long-Term Care. Ontario Health Insurance Schedule of Benefits and Fees. [[updated 2010; cited 2010 Aug 8]]. [Internet] Available from: http://www.health.gov.on.ca/english/providers/program/ohip/sob/sob_mn.html .
- 31.Health Canada. Drug Product Database - Vectibix. [[updated 2010; cited 2010 Jun 18]]. [Internet] Available from: http://webprod.hc-sc.gc.ca/dpd-bdpp/info.do?lang=eng&code=79412 .
- 32.Health Canada. Drug Product Database - Erbitux. [[updated 2010; cited 2010 Jun 18]]. [Internet] Available from: http://webprod.hc-sc.gc.ca/dpd-bdpp/info.do?lang=eng&code=75672 .
- 33.Canadian Agency for Drugs and Technologies in Health. Guidelines for the economic evaluation of health technologies: Canada [3rd Edition] Ottawa: Canadian Agency for Drugs and Technologies in Health. 2006. Mar, p. 74 p. Available from: http://www.cadth.ca/media/pdf/186_EconomicGuidelines_e.pdf .
- 34.Health Data Branch - Ministry of Health and Long-Term Care. Report 7 - Drug Cost per Oncology/Dialysis Visit. [[updated 2010; cited 2010 Aug 8]]. [Internet] Available from: https://www.healthinfo.moh.gov.on.ca/reports/indexHospital_20092010YE.html .
- 35.Canadian Institute for Health Information. 2009 Canadian Classification of Health Interventions (CCI): CIHI: Ottawa, ON; 2009. [Google Scholar]
- 36.Canadian Institute for Health Information. 2009 International statistical classification of diseases and related health problems. Tenth Revision Canada (ICD-10-CA). CHI: Ottawa, ON; 2009. [Google Scholar]
- 37.NCI Cancer Therapy Evaluation Program. Common terminology criteria for adverse events (CTCAE) [[updated 2010; cited 2010 Jun 18]]. [Internet] Available from: http://ctep.cancer.gov/protocolDevelopment/electronic_applications/ctc.htm .
- 38.Loupakis F, Ruzzo A, Cremolini C, Vincenzi B, Salvatore L, Santini D, et al. KRAS codon 61, 146 and BRAF mutations predict resistance to cetuximab plus irinotecan in KRAS codon 12 and 13 wild-type metastatic colorectal cancer. Br J Cancer. 2009;101(4):715–21. doi: 10.1038/sj.bjc.6605177. [DOI] [PMC free article] [PubMed] [Google Scholar]
- 39.Van Cutsem E, Siena S, Humblet Y, Canon JL, Maurel J, Bajetta E, et al. An open-label, single-arm study assessing safety and efficacy of panitumumab in patients with metastatic colorectal cancer refractory to standard chemotherapy. Ann Oncol. 2008;19(1):92–8. doi: 10.1093/annonc/mdm399. [DOI] [PubMed] [Google Scholar]
- 40.Siena S, Peeters M, Van Cutsem E, Humblet Y, Conte P, Bajetta E, et al. Association of progression-free survival with patient-reported outcomes and survival: results from a randomised phase 3 trial of panitumumab. Br J Cancer. 2007;97(11):1469–74. doi: 10.1038/sj.bjc.6604053. [DOI] [PMC free article] [PubMed] [Google Scholar]