Abstract
Background
Transcatheter aortic valve implantation (TAVI) has become an alternative to surgical aortic valve replacement (sAVR) for patients at high risk for surgery.
Objective
To evaluate the safety, effectiveness, and cost-effectiveness of TAVI for treatment of aortic valve stenosis in symptomatic older adults.
Review Methods
A literature search was performed on September 6, 2011, for studies published from January 1, 2007, to September 6, 2011. A combined decision tree and Markov model was developed to compare costs, life years, and quality-adjusted life-years (QALYs) of all treatment options in their respective patient populations over a 20-year time horizon.
Results
Two studies from the PARTNER trial were identified. The first study compared TAVI to sAVR in patients who were candidates for sAVR. The second study compared TAVI to standard treatment in patients who were not eligible for sAVR. The first study showed that TAVI and sAVR had similar mortality rates at 1 year. The second study showed a significant improvement in patient survival in those undergoing TAVI. However, in both studies, the TAVI group had significantly higher rates of stroke/transient ischemic attack, and major vascular complications. Rates of major bleeding were significantly higher in sAVR group in the first study and significantly higher in TAVI group in the second study. The base-case cost-effectiveness of TAVI was $48,912 per QALY, but the incremental cost-effectiveness ratio ranged from $36,000 to $291,000 per QALY depending on the assumptions made in the longer-term prediction portion of the model (i.e., beyond the follow-up period of the PARTNER trial).
Conclusions
TAVI improves survival in patients who cannot undergo surgery. For those who are candidates for surgery, TAVI has a mortality rate similar to sAVR, but it is associated with significant adverse effects. TAVI may be cost-effective for patients who cannot undergo surgery, but is not cost-effective for patients who can.
Background
This evidence-based analysis (Part B) updates a previous report on transcatheter aortic valve implantation that was completed in 2009 but not published because Health Canada did not license the prosthesis until June 2011. The 2009 report (Part A) can be found here: http://hqontario.ca/taviparta2009
Objective of Analysis
The objective of this analysis is to evaluate the safety, effectiveness, and cost-effectiveness of transcatheter aortic valve implantation (TAVI) for treatment of aortic valve stenosis (AVS) in symptomatic older adults.
Clinical Need and Target Population
Aortic Valve Stenosis
The aortic valve is 1 of 4 cardiac valves (aortic, mitral, tricuspid, and pulmonic) that control the direction of blood flow through the heart chambers and main arteries. It is a 1-way valve that prevents blood from flowing back from the aorta (which supplies blood to all parts of the body) into the left ventricle of the heart after it has been pumped out. AVS is the narrowing of the aortic valve.
AVS can result from the progressive build-up of calcium and the formation of scar tissue on a normal valve or on one damaged by an episode of rheumatic fever. The disease spectrum ranges from minor focal leaflet thickening with normal valve function to severe calcification and stiffness of the leaflets. Rajamannan et al (1) have shown that calcification in human aortic valve leaflets resembles calcification in osteoblastogenesis during skeletal bone formation, and Mohler et al (2) have shown that the aortic valve calcification occurs secondarily to a bone formation process present in the aortic valve.
Left untreated, the obstruction gradually results in pressure overload and left ventricular hypertrophy. (3) Symptoms of AVS include shortness of breath during physical activity, chest pain, dizziness, and syncope. Severe AVS represents the end stage of the disease spectrum. (4)
The aortic valve normally consists of 3 flaps of delicate tissue referred to as cusps or leaflets, which are aligned to separate the left ventricle from the aorta. However, about 1 to 2% of the population is born with a valve that has only 2 cusps instead of 3 (bicuspid aortic valve). (5) While bicuspid valves may function normally, affected individuals are at increased risk of developing AVS due to degenerative changes in the bicuspid valve. (6;7) They may be unaware of their condition and the potential risk for complications.
Prevalence and Incidence
AVS primarily affects older people and, as the most frequent cardiovascular disease after hypertension and coronary artery disease (CAD) in developed countries, it constitutes a major health problem. (8) The Cardiovascular Health Study, (4) which included data from 5,201 patients 65 years of age and older, confirmed that aortic valve disease becomes more prevalent with age and is common in the elderly. About 1 in 4 subjects in this cohort had visually apparent leaflet thickening, calcification, or both. Prevalence figures for aortic valve sclerosis and AVS were as follows:
in the overall study population: 26% and 2%, respectively
in people aged 65 to 74 years: 20% and 1.3%, respectively
in people aged 75 to 84 years: 35% and 2.4%, respectively
in people older than 85 years: 48% and 4%, respectively
Risk Factors
Studies suggest that degenerative AVS is an active disease process associated with underlying risk factors, rather than an inevitable consequence of aging. (9) Factors that lead to endothelial injury and inflammatory cell infiltration—features of the early atherosclerotic process—have emerged as independent predictors of aortic valve disease. Low-density lipoprotein cholesterol, smoking, male sex, diabetes, hypertension, and renal failure rank among the most important risk factors identified through intensive research in this area. (4;10-13)
Current Treatment
It is important to diagnose and treat AVS, as this condition can eventually result in heart failure. Symptomatic patients who are managed medically have a poor prognosis. (14) In these patients, balloon valvuloplasty (BV) may result in temporary relief of symptoms but is associated with a high rate of restenosis. Long-term survival after BV is poor, with 1-, 2-, and 3-year survival rates of 55%, 35%, and 23%, respectively. (14) Early restenosis and recurrent hospitalization are common. (14)
Since no medical therapy is known to conclusively alter the progression of aortic valve disease, (10) surgical aortic valve replacement (sAVR) (involving sternotomy and cardiopulmonary bypass) has been performed for decades to improve heart function, relieve symptoms, and improve patient survival. sAVR is the gold-standard procedure for the treatment of symptomatic patients with severe AVS and has well-defined indications (15) delineated in the American College of Cardiology/American Heart Association 2006 Practice Guidelines for the Management of Patients with Valvular Heart Disease. (16)
Operative Mortality
Data from the Society of Thoracic Surgeons (STS) National Registry show that 16,330 aortic valve procedures were performed in the United States in 2006. (17) The unadjusted operative mortality from aortic valve procedures was 3.2%, and the mean length of hospital stay was 8 days. However, many experienced high-volume centres have reported an operative mortality of less than 1% for sAVR. (18)
Timing of Intervention
Aortic valve replacement is strongly recommended in patients with severe symptomatic AVS, but in asymptomatic patients the decision to treat surgically and the timing of surgery are controversial and challenging. (8)
Patients with severe AVS may remain asymptomatic for years. For example, Lindroos et al (19) found critical native AVS on echocardiography (defined as a calculated aortic valve area of 0.8 cm2 or less and velocity ratio of 0.35 cm2/m2 or less) in 2.2% of randomly selected men and women aged 75 to 86 years (n = 577) participating in the Helsinki Aging Study. Only half of these were symptomatic and potentially eligible for valvular surgery.
Once AVS becomes severe, ischemia and fibrosis occur rapidly, leading to the possibility of heart failure and sudden death, even after successful valve replacement. (20) Accordingly, aortic valve replacement should be performed before extensive fibrosis occurs. Development of symptoms during exercise testing in asymptomatic, physically active patients (particularly in those younger than 70 years) has been shown to predict a very high likelihood that AVS will become symptomatic within 12 months. (8)
Some patients with asymptomatic AVS benefit from early valve replacement, underscoring the importance of reliable risk stratification to identify high-risk patients. Risk stratification can help to identify asymptomatic patients at risk of developing symptoms within a very short time frame. Data from a recent meta-analysis of 7 studies, including 491 patients with asymptomatic AVS, indicate that stress tests can be used safely in asymptomatic patients to help stratify risk and guide the timing of valve replacement. (21)
The current American College of Cardiology/American Heart Association practice guidelines recommend considering surgery in asymptomatic patients with severe AVS and an abnormal exercise test (e.g., development of symptoms or asymptomatic hypotension) if there is a high likelihood of rapid progression (age, calcification, CAD), or if surgery might need to be delayed at the time of symptom onset. (16)
Risk Calculation for Cardiac Surgery
Operative risk-scoring algorithms predict early mortality following cardiac surgery. These tools estimate individual patients’ mortality and morbidity risk based on their preoperative demographic and clinical characteristics. Available risk models for cardiac surgery, developed based on large heterogeneous cohorts of patients who have undergone cardiac surgery, can be divided into 3 categories: general cardiac surgery risk models, general valve surgery risk models, and specific valve surgery risk models. (22) These instruments differ in their variables and calculation methods (although they all include patient age, sex, and renal function), thus yielding different results.
The most popular models in current use are the STS Predicted Risk of Mortality and the European System for Cardiac Operative Risk Evaluation (EuroSCORE). Following the EuroSCORE’s original publication in 1999, 2 variations were developed: the additive EuroSCORE and the logistic EuroSCORE. The additive EuroSCORE adds the value of each variable to generate overall operative risk, but it does not always achieve an appropriate weighting of risk factors, especially in higher-risk patients. The logistic EuroSCORE, developed to address this limitation, uses a more complex algorithm and requires a computer. The recently released EuroSCORE II, (23) available online at euroscore.org, is gradually supplanting these earlier instruments. EuroSCORE uses 17 variables to predict risk, (22) while STS collects more than 50 preoperative variables but uses only 24 of them in its mortality algorithm.
A number of other risk factors have not been included in the above risk models but may have a bearing on perioperative and postoperative mortality. For example, it has been shown that patients receiving chest wall irradiation for a malignant tumour have higher mortality rates after heart surgery. (24) Poor nutritional status, frailty, and malignancy have also been associated with poor outcomes after cardiac surgery. In addition, about 20% (range, 5%—33%) of patients undergoing TAVI are diagnosed with porcelain aorta, (25) but the risk-scoring algorithms do not include this comorbidity as a variable.
Reliability of Risk Algorithms in Predicting Mortality
When a significant percentage of a study population has risk factors similar to those included in the risk model, the accuracy of that risk model in predicting mortality is expected to be high. However, overestimation of a patient’s real risk (26) may artificially exaggerate the significance of the positive results obtained with a specific intervention and lead to a different choice of intervention. (27)
Use of the EuroSCORE algorithm for evaluating risk in patients with severe aortic stenosis has come into question due to the instrument’s overestimation of risk in many patients. (27-30) EuroSCORE is based on a cohort of patients in whom 60% underwent coronary artery bypass graft (CABG) surgery, 30% underwent valve surgery with or without CABG, and 10% underwent other related cardiac surgical procedures. The STS risk algorithm is more detailed and considers the type of surgery; it may predict risk more reliably in high-risk patients undergoing isolated valve surgery. (26)
Errors in Risk Calculation
Canadian investigators have emphasized the need for appropriate calculation of STS scores and have provided instructions to avoid some of the most common errors that can lead to STS score overestimation. For creatinine values, for example, the STS uses mg/dL (not µmol/L); figures must be converted to the appropriate units before insertion into the risk calculator. As well, the decimals must be indicated with a period rather than a comma. (27)
Example: An 85 year-old woman with severe AVS and a history of hypertension, 160 cm tall and weighing 60 kg, has a normal creatinine level (1.0 mg/dL) and a normal ejection fraction, and stable New York Heart Association (NYHA) class III disease that warrants surgery. The correct STS score for this patient is 4.3%; incorrectly inputting the creatinine value as 1,0 mg/dL (rather than 1.0 mg/dL) would raise the STS to an unacceptably high 20.7%, incorrectly making it appear that she is ineligible for surgery.
Technology
TAVI has become an alternative to sAVR for patients in whom surgical treatment is contraindicated or is associated with a high risk of morbidity and mortality.
Prostheses
Currently, there are 2 prostheses used in clinical practice in Ontario: the Edwards SAPIEN valve (Edwards Lifesciences, Irvine, California, United States) and the CoreValve Revalving System (Medtronic Inc., Minneapolis, Minnesota, United States).
The Edwards SAPIEN transcatheter aortic valve is a bioprosthetic valve made of bovine pericardial tissue mounted into a balloon-expandable stainless steel frame. The 23 mm and 26 mm Edwards SAPIEN transcatheter aortic valves are suitable for a native aortic annulus measuring 18 to 25 mm. The third-generation Edwards SAPIEN XT THV cobalt-chromium bovine pericardial valve has a lower crimp profile and a modified leaflet design. The SAPIEN valve is placed using a retrograde (transarterial—traditionally transfemoral [TF]) or antegrade (transapical [TA]) approach for patients who have compromised peripheral arteries.
The Core Valve transcatheter aortic valve is a trileaflet bioprosthetic porcine pericardium prosthesis mounted into a self-expanding nitinol frame. The CoreValve 26 mm and 29 mm prostheses are suitable for an aortic annulus measuring 20 to 27 mm.
Delivery Systems
-
Edwards SAPIEN:
– Retroflex: The Retroflex 3 TF delivery system for the SAPIEN valve is currently used for the delivery of 23 mm and 26 mm valves.
– NovaFlex: The new-generation 18 French (F) and 19 F NovaFlex delivery systems are for 23 mm and 26 mm valves, respectively. The 18 F delivery system requires an ileofemoral access of at least 6 mm in diameter (instead of the previous 7 mm) to deliver a 23 mm valve, and the 19 F requires an ileofemoral access of at least 6.5 mm in diameter (instead of the previous 7.5 mm) to deliver a 26 mm valve. (31)
– Ascendra: The 26 F Ascendra delivery system facilitates implantation of both 23 mm and 26 mm valves via a TA approach. The recently developed Ascendra II 24 F TA delivery system further enhances its utility. (31)
CoreValve: The CoreValve 18 F delivery system is used across all valve sizes. The new-generation Core Valve prosthesis uses the Accutrak delivery system for improved stability in device placement.
Procedure
TAVI is usually performed in a hybrid operative suite designed to accommodate the necessary equipment and personnel required for both TAVI and open heart surgery. For best results, the procedure requires a multidisciplinary team, including a cardiac surgeon, an interventional cardiologist, and a cardiac anesthesiologist experienced in echocardiography. Other team members include a surgical assistant, a perfusionist, a surgical scrub nurse trained in transcatheter procedures, a circulating nurse, and a radiology or catheterization laboratory technician.
The procedure is usually performed under general anesthesia and occasionally under mild sedation and local anesthesia. Intravenous heparin is administered to achieve a desired activated clotting time. Throughout the procedure, echocardiography and fluoroscopy help assess the anatomical requirements (e.g., width of aorta) for TAVI and guide the procedure. The procedure does not require cardiopulmonary bypass.
The retrograde approach involves insertion of the delivery catheter through the common femoral artery. In the antegrade approach, a small left anterior mini-thoracotomy is performed to expose the apex of the heart; the left ventricular apex is then punctured in order to introduce the guidewires and sheaths, perform BV, and insert the TA delivery sheath that carries the valve.
BV and Rapid Ventricular Pacing
Before implantation of the SAPIEN valve, the native aortic valve is dilated with a balloon. A transvenous pacing wire positioned in the right ventricle enables rapid ventricular pacing (RVP) during BV, (32) resulting in temporary reversible cessation of cardiac output and left ventricular ejection for optimal conduct of BV.
RVP is also an essential step during aortic valve deployment to prevent malpositioning and embolization of the prosthesis. It is a key feature of the TAVI procedure and requires the full attention of the anesthesiologist and the entire team. (33) Management of RVP is crucial in both TA and TF procedures. Webb et al used an initial rate of 150 to 220 beats per minute for the TF procedure, with a pacing duration of 12 ± 3 seconds. (32) Higher frequencies (180-250 beats per minute) have been used for the TA approach. The valve is implanted during a second brief episode of RVP, and aortic root angiography confirms the intra-annular position of the valve relative to the coronary ostia.
Regulatory Status
In 2007, Health Canada approved TAVI for compassionate clinical use in patients with symptomatic AVS who were not eligible for sAVR or were at high risk of morbidity and mortality following surgery. In June 2011, the Edwards SAPIEN valve was licensed for clinical use in patients with severe AVS. The CoreValve device has not received a Canadian licence to date.
The CoreValve Revalving System received the Conformité Européenne (CE) mark in March 2007, and the Edwards SAPIEN valve received the CE mark in August 2008. Medtronic has recently received a CE Mark for its 31 mm CoreValve System for patients with a larger aortic annulus.
Evidence-Based Analysis
Research Questions
This analysis aims to address and answer the following sets of questions.
For high-risk patients who are candidates for surgery:
Is the risk of death following TAVI equal to or less than that following sAVR?
Is TAVI associated with an equal or greater improvement in clinical symptoms and quality of life compared with sAVR?
What are the adverse events and complications associated with TAVI?
What is the cost-effectiveness of TAVI compared with sAVR?
For high-risk patients who are not candidates for surgery:
Is the risk of death following TAVI less than that for standard treatment (ST)?
Is TAVI associated with a greater improvement in clinical symptoms and quality of life compared with ST?
What are the adverse events and complications associated with TAVI?
What is the cost-effectiveness of TAVI compared with ST?
Research Methods
Literature Search
A literature search was performed on September 6, 2011, using OVID MEDLINE, OVID MEDLINE In-Process and Other Non-Indexed Citations, OVID EMBASE, EBSCO Cumulative Index to Nursing and Allied Health Literature (CINAHL), the Wiley Cochrane Library, and the International Agency for Health Technology Assessment (INAHTA) for studies published from January 1, 2007, until September 6, 2011. Abstracts were reviewed by a single reviewer and, for those studies meeting the eligibility criteria, full-text articles were obtained.
Inclusion Criteria
English-language full reports
published between January 1, 2007, and September 6, 2011
randomized controlled trials (RCTs) and systematic reviews
≥ 6 months follow-up
studies investigating clinical outcomes following TAVI in comparison with sAVR (for high-risk patients who are candidates for surgery) or with ST (for high-risk patients who are not candidates for surgery)
studies reporting mortality and/or important cardiovascular outcomes
studies including at least 10 patients
Exclusion Criteria
nonrandomized trials
studies reporting on technical aspects of different prostheses, design of TAVI systems, or techniques for valve implantation
studies reporting on approaches other than TF or TA
studies reporting on combined strategies, such as a combination of TAVI and other cardiac procedures
studies reporting on the implantation of a second valve
studies including fewer than 10 patients
Outcomes of Interest
Primary Outcomes
rate of death (procedural, after 30 days, and follow-up)
Secondary Outcomes
rate of emergent conversion to surgery
rate of valve embolization
rate of multiple valve insertion
cardiovascular complications: stroke, myocardial infarction (MI), atrial fibrillation, paravalvular aortic regurgitation, vascular injuries, need for permanent pacemaker
renal function
improvement in symptoms
improvement in NYHA class
improvement in quality of life
length of hospital stay
length of intensive care unit (ICU) stay
rehospitalization
Statistical Analysis
RevMan 5.1 software was used for graphical presentation of data. (34) Only the P values reported by the authors were used for this report.
Quality of Evidence
The quality of each included study was assessed taking into consideration the following 7 study design characteristics:
adequate allocation concealment
randomization (study must include a description of the randomization procedure used and must be a proper method)
power/sample size (adequate sample size based on a priori calculations; underpowered studies were identified, when possible, using post hoc sample size power calculations)
blinding (if double blinding is not possible, a single-blind study with unbiased assessment of outcome was considered adequate for this criterion)
< 20% withdrawals/dropouts
intention-to-treat (ITT) analysis conducted and done properly (withdrawals/dropouts considered in analysis)
other criteria as appropriate for the particular research question and study design
The quality of the body of evidence was assessed as high, moderate, low, or very low according to the GRADE Working Group criteria (35) as presented below.
Quality refers to criteria such as the adequacy of allocation concealment, blinding and follow-up.
Consistency refers to the similarity of estimates of effect across studies. If there are important and unexplained inconsistencies in the results, our confidence in the estimate of effect for that outcome decreases. Differences in the direction of effect, the magnitude of the difference in effect, and the significance of the differences guide the decision about whether important inconsistency exists.
Directness refers to the extent to which the interventions and outcome measures are similar to those of interest.
As stated by the GRADE Working Group, the following definitions of quality were used in grading the quality of the evidence:
| High | Very confident that the true effect lies close to that of the estimate of the effect |
| Moderate | Moderately confident in the effect estimate—the true effect is likely to be close to the estimate of the effect, but there is a possibility that it is substantially different |
| Low | Confidence in the effect estimate is limited—the true effect may be substantially different from the estimate of the effect |
| Very Low | Very little confidence in the effect estimate—the true effect is likely to be substantially different from the estimate of effect |
Results of Evidence-Based Analysis
The database search yielded 874 studies published between January 1, 2007, and September 6, 2011 (with duplicates removed). Articles were excluded based on information in the title and abstract. Since the previous report (Part A) (36) included all studies published from January 1, 2007, to May 20, 2009, this update includes only studies published since January 1, 2009.
Two studies (both RCTs) (37;38) met the inclusion/exclusion criteria.
For each included study, the study design was identified and is summarized below in Table 1, which is a modified version of a hierarchy of study design by Goodman. (39)
Table 1: Body of Evidence Examined According to Study Design.
| Study Design | Number of Eligible Studies |
|---|---|
| RCT Studies | |
| Systematic review of RCTs | |
| Large RCT | 2 |
| Small RCT | |
| Observational Studies | |
| Systematic review of non-RCTs with contemporaneous controls | |
| Non-RCT with non-contemporaneous controls | |
| Systematic review of non-RCTs with historical controls | |
| Non-RCT with historical controls | |
| Database, registry, or cross-sectional study | |
| Case series | |
| Retrospective review, modelling | |
| Studies presented at an international conference | |
| Expert opinion | |
| Total | 2 |
Abbreviation: RCT, randomized controlled trial.
The PARTNER Trial: Overall Description
The Placement of Aortic Transcatheter Valve (PARTNER) trial was a multicentre study designed to investigate the safety and effectiveness of the Edwards SAPIEN aortic valve. In this trial, patients were divided into 2 cohorts: A and B. Cohort A involved patients considered (by the surgeons at each study centre) to be high-risk but still eligible for sAVR. Cohort B involved high-risk patients who were not eligible for sAVR due to specific coexisting health conditions. The results for the 2 cohorts were published separately. (37;38)
Baseline characteristics of the patients in cohorts A and B are shown in Tables 2 and 3. While the 2 cohorts appear to have similar baseline characteristics (Table 2), some patients in cohort B had additional conditions that made them ineligible for sAVR; these conditions and their rates of occurrence are shown in Table 3.
Table 2: Baseline Characteristics, Cohort A and Cohort B.
| Baseline Characteristics | Cohort A | Cohort B | ||
|---|---|---|---|---|
| TAVI | sAVR | TAVI | BV/ST | |
| Mean age ± SD | 83.6 ± 6.8 | 84.5 ± 6.4 | 83.1 ± 8.6 | 83.2 ± 8.3 |
| STS score ± SD | 11.8 ± 3.3 | 11.7 ± 3.5 | 11.2 ± 5.8 | 12.1 ± 6.1 |
| Logistic EuroSCORE ± SD | 29.3 ± 16.5 | 29.2 ± 15.6 | 26.4 ± 17.2 | 30.4 ± 19.1 |
| NYHA class III/IV, % | 94.3 | 94.0 | 92.2 | 93.9 |
| CAD, % | 74.9 | 76.9 | 67.6 | 74.3 |
| Atrial fibrillation, % | 40.8 | 42.7 | 32.9 | 48.8 |
| Previous MI, % | 26.8 | 30.0 | 18.6 | 26.4 |
| Previous CABG, % | 42.6 | 44.2 | 37.4 | 45.6 |
| Previous PCI, % | 34.0 | 32.5 | 30.5 | 24.8 |
| Cerebral vascular disease, % | 29.3 | 27.4 | 27.4 | 27.5 |
| Peripheral vascular disease, % | 43.0 | 41.6 | 30.3 | 25.1 |
| Creatinine > 3 mg/dL, % | 11.1 | 7.0 | 5.6 | 9.6 |
| Permanent pacemaker, % | 20.0 | 21.9 | 22.9 | 19.5 |
| COPD, % | 43.4 | 43.0 | 41.3 | 52.5 |
Abbreviations: BV, balloon valvuloplasty; CABG, coronary artery bypass graft; CAD, coronary artery disease; COPD, chronic obstructive pulmonary disease; EuroSCORE, European System for Cardiac Operative Risk Evaluation; MI, myocardial infarction; NYHA, New York Heart Association; PCI, percutaneous coronary intervention; sAVR, surgical aortic valve replacement; SD, standard deviation; ST, standard treatment; STS, Society of Thoracic Surgeons; TAVI, transcatheter aortic valve implantation.
Table 3: Additional Comorbidities, Cohort A vs. Cohort B.
| Baseline Characteristics | Cohort A | Cohort B | ||
|---|---|---|---|---|
| TAVI | sAVR | TAVI | BV/ST | |
| COPD, oxygen-dependent, % | 9.2 | 7.1 | 21.2 | 25.7 |
| Chest wall irradiation, % | 0.9 | 0.9 | 8.9 | 8.4 |
| Chest wall deformity, % | 0 | 0.3 | 8.4 | 5.0 |
| Porcelain aorta, % | 0.6 | 1.1 | 19.0 | 11.2 |
| Frailty, % | 15.6 | 17.6 | 18.1 | 28.0 |
Abbreviations: BV, balloon valvuloplasty; COPD, chronic obstructive pulmonary disease; sAVR, surgical aortic valve replacement; ST, standard treatment; TAVI, transcatheter aortic valve implantation.
The PARTNER Trial: Cohort A
Patient Characteristics
Cohort A consisted of 699 patients with severe aortic stenosis enrolled at 22 centres in the United States, 2 centres in Canada, and 1 centre in Germany. An STS score of at least 10% served as a threshold for inclusion. Patients were also selected because they had comorbidities associated with a higher risk of death (15% by 30 days postsurgery as estimated by the surgeons at each study centre). Exclusion criteria were as follows:
aortic annulus diameter < 18 mm or > 25 mm
bicuspid noncalcified valve
coronary artery disease requiring revascularization
left ventricular ejection fraction < 20%
recent neurologic event
severe (4+) mitral or aortic regurgitation
severe renal insufficiency
Study Design
The study had a noninferiority design to demonstrate that TAVI is not worse than sAVR with respect to 1 year rate of death. The noninferiority margin for the upper limit of a 1-sided 95% confidence interval (CI) was selected as less than 7.5% at an alpha level of 0.05.
Randomization
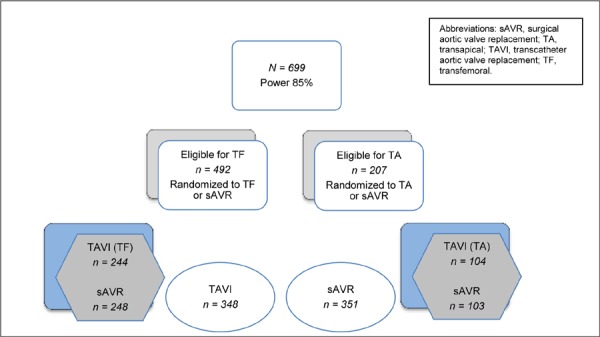
Before randomization, patients underwent peripheral artery examination to assess their eligibility for TF or TA valve replacement. Patients were randomized using computer-generated randomized blocks. From the entire sample, 492 patients were selected to be randomized to TF TAVI or sAVR and 207 patients were selected to be randomized to TA TAVI or sAVR. Figure 1 shows the randomization scheme for cohort A.
Figure 1: Randomization Scheme for Cohort A.
Power
The overall study had a power of at least 85% to show the noninferiority of TAVI compared with sAVR. Assuming the same 7.5% noninferiority margin, the TF TAVI/sAVR subgroup also had 85% power to demonstrate the noninferiority of TF TAVI compared with sAVR. The TA/sAVR subgroup was smaller and did not have sufficient power to demonstrate noninferiority.
Primary Endpoint
The primary endpoint of the study was rate of death from any cause at 1 year in the ITT population. Patients were followed for at least 1 year (median 1.4 years, maximum 3.3 years). Patients in the TF and TA groups had similar baseline characteristics. However, patients in the TA group had significantly higher rates of CABG (P < 0.001), cerebrovascular disease (P < 0.001), and peripheral vascular disease (P = 0.001) than those in the TF group, despite their similar STS scores.
TAVI Procedure
Patients in the TAVI group received heparin during the procedure and dual antiplatelet therapy (Aspirin and clopidogrel) for 6 months after the intervention. TAVI procedures were all performed through either the femoral artery (retrograde implantation) or through the apex of the heart (antegrade implantation). The TF delivery system was either a 22 French to deliver a 23 mm valve or a 24 French to deliver a 26 mm valve.
Results
Forty-two patients did not undergo the assigned procedure (4 in the TAVI group and 38 in the sAVR group); therefore, results were reported for both ITT and as-treated populations. The TAVI procedure was aborted in 7 patients (2%).
Periprocedural Outcomes
Table 4 summarizes the periprocedural events following TAVI.
Table 4: Periprocedural Events Following TAVI.
| Event | n (%) | Reason |
|---|---|---|
| Immediate mortality | 4 (1.1) | NR |
| Conversion to surgery | 11 (3.2) | 5 due to valve embolization |
| Aborted | 7 (2.0) | 2 due to valve embolization |
| Valve embolization | 9 (2.6) | — |
| Multiple valve insertion | 7 (2.0) | 2 due to valve embolization |
Abbreviations: NR, not reported; TAVI, transcatheter aortic valve implantation.
Conversion Rate
In the TAVI group, 11 of 348 patients (3.2%) were converted to surgery, either immediately (n = 9) or later on (n = 2). Immediate conversion to surgery was due to either valve embolization (n = 5) or anatomical factors (n = 4). In the sAVR group, 1 patient underwent TAVI due to an extremely calcified aorta discovered during surgery.
Valve Embolization
Overall, 9 patients had valve embolizations. Five underwent immediate surgery, and 2 received additional valves (valve-in-valve). In 2 patients, the procedure was aborted.
Multiple Valve Insertion
Seven patients in the TAVI group received multiple (at least 2) transcatheter valves, and 3 of these patients died. The reasons for implanting additional valves were valve embolization (n = 2) and residual aortic regurgitation (n = 5).
Rates of Death and Adverse Events
Death
Procedural
Three patients who underwent TAVI and 1 patient in the TAVI group who was immediately converted to surgery died during the procedure. No patient initially assigned to the sAVR group died during the procedure.
30 Days
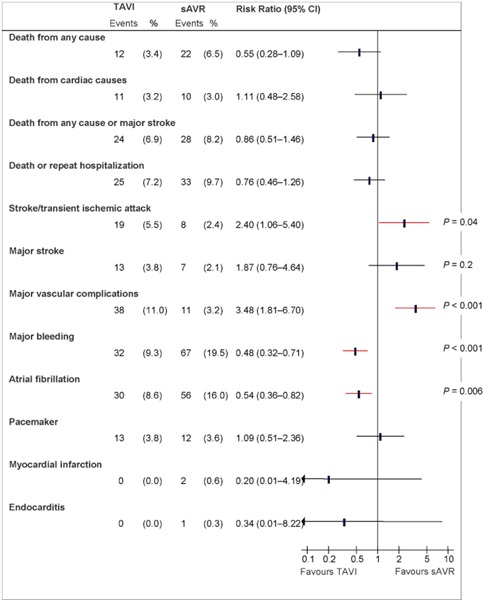
In the ITT analysis, the rate of death from any cause at 30 days was 3.4% in the TAVI group and 6.5% in the surgical group (P = 0.07). In the as-treated analysis, the rate of death was 5.2% in the TAVI group and 8.0% in the surgical group (P = 0.15).
The observed rate of death at 30 days in the sAVR group was much lower than expected based on STS scores, logistic EuroSCORE risk scores, and surgeons’ estimates (Table 5).
Table 5: Expected and Actual Mortality for Patients Undergoing sAVR.
| 30-Day Mortality | sAVR, % |
|---|---|
| Expected (STS score) | 11.7 |
| Expected (logistic EuroSCORE) | 29.2 |
| Expected (surgeons) | 15.0 |
| Actual (ITT) | 6.5 |
| Actual (as treated) | 8.0 |
Abbreviations: EuroSCORE, European System for Cardiac Operative Risk Evaluation; ITT, intention-to-treat; sAVR, surgical valve replacement; STS, Society of Thoracic Surgeons.
One Year
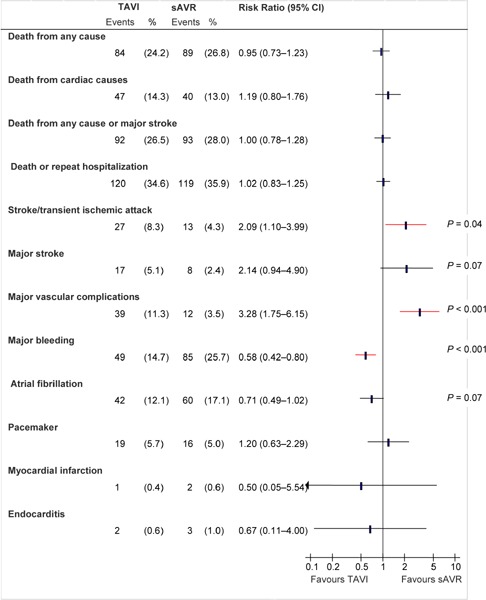
In the ITT population, the rate of death from any cause at 1 year was 24.2% in the TAVI group and 26.8% in the surgical group (P = 0.44). The difference of –2.6% (95% CI, –9.3% to 4.1%) fell within the prespecified noninferiority margin of 7.5%.
Adverse Events
Stroke/Transient Ischemic Attack
At 30 days and 1 year, the rate of having either a stroke or a transient ischemic attack (TIA) was significantly higher in the TAVI group than in the sAVR group (P = 0.04 for both comparisons). The rate of major stroke at 1 year was twice as high in the TAVI group as in the sAVR group, but the difference was not statistically significant.
Major Vascular Complications1
At 30 days and 1 year, the rates of vascular complications, including major ones, were significantly higher in the TAVI group than in the sAVR group (P < 0.001 for all comparisons).
Major Bleeding2
At 30 days and 1 year, the rate of major bleeding was significantly higher in the sAVR group than the TAVI group (P < 0.001 for both comparisons).
New-Onset Atrial Fibrillation
At 30 days, significantly more people developed atrial fibrillation in the sAVR group than in the TAVI group (P = 0.006), but the difference was not statistically significant at 1 year.
Other Adverse Events
The rates of new MI, new pacemaker insertion, endocarditis, high creatinine level (> 3 mg/dL), and renal replacement therapy (combined temporary and permanent) did not differ significantly between the 2 groups either at 30 days or 1 year.
Summary
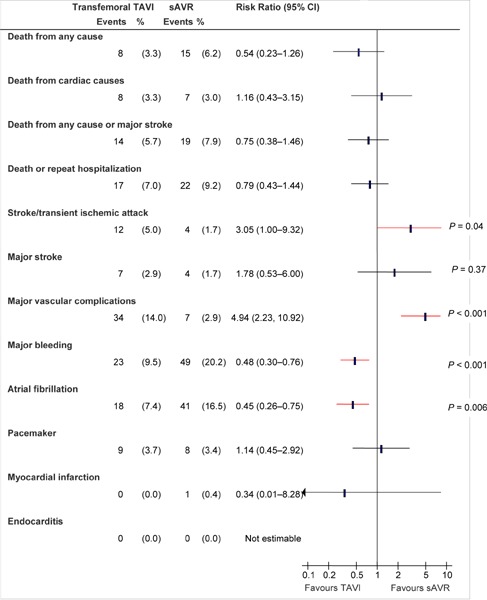
Figures 2 and 3 show the rates of death and adverse events at 30 days and 1 year based on ITT analyses, while Figures 4 to 7 show the rates of death and adverse events in the TF and TA subgroups at 30 days and at 1 year.
Figure 2: Death and Adverse Events at 30 Days (ITT), TAVI vs. sAVRa.
Abbreviations: CI, confidence interval; ITT, intention-to-treat; sAVR, surgical aortic valve replacement; TAVI, transcatheter aortic valve implantation.
Data and calculations as per published report.
Source: Smith et al, 2011 (37)
Figure 3: Death and Adverse Events at 1 Year (ITT), TAVI vs. sAVR*.
Abbreviations: CI, confidence interval; ITT, intention-to-treat; sAVR, surgical aortic valve replacement; TAVI, transcatheter aortic valve implantation.
Data and calculations as per published report.
Source: Smith et al, 2011 (37)
Figure 4: Death and Adverse Events at 30 Days (ITT), TF TAVI vs. sAVRa.
Abbreviations: CI, confidence interval; ITT, intention-to-treat; sAVR, surgical aortic valve replacement; TAVI, transcatheter aortic valve implantation; TF, transfemoral.
Data and calculations as per published report.
Source: Smith et al, 2011 (37)
Figure 7: Death and Adverse Events at 1 Year (ITT), TA TAVI vs. sAVRa.
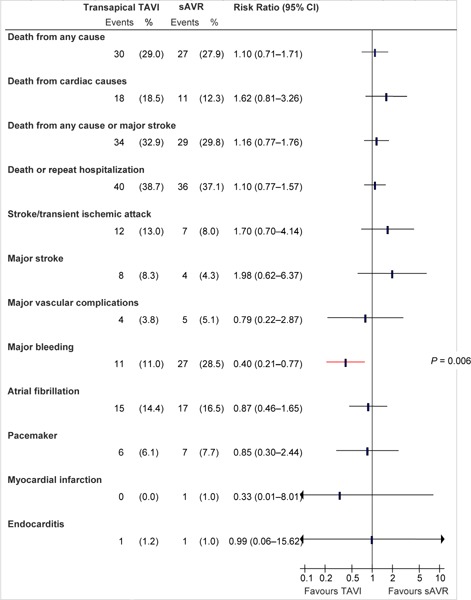
Abbreviations: CI, confidence interval; ITT, intention-to-treat; sAVR, surgical aortic valve replacement; TA, transapical; TAVI, transcatheter aortic valve implantation.
Data and calculations as per published report.
Source: Smith et al, 2011 (37)
Figure 5: Death and Adverse Events at 1 Year (ITT), TF TAVI vs. sAVRa.
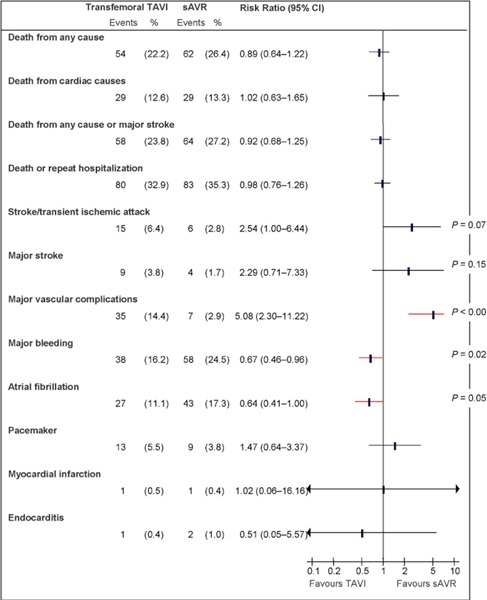
Abbreviations: CI, confidence interval; ITT, intention-to-treat; sAVR, surgical aortic valve replacement; TAVI, transcatheter aortic valve implantation; TF, transfemoral.
Data and calculations as per published report.
Source: Smith et al, 2011 (37)
Figure 6: Death and Adverse Events at 30 Days (ITT), TA TAVI vs. sAVRa.
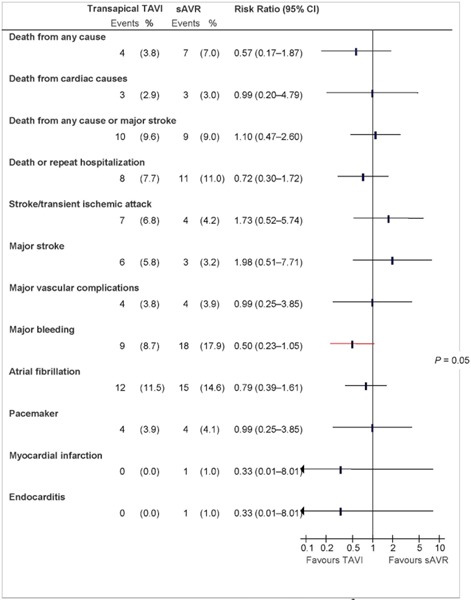
Abbreviations: CI, confidence interval; ITT, intention-to-treat; sAVR, surgical aortic valve replacement; TA, transapical; TAVI, transcatheter aortic valve implantation.
aData and calculations as per published report.
Source: Smith et al, 2011 (37)
Hemodynamic and Structural Changes
At 1 year, significantly more patients in the TAVI group had paravalvular and transvalvular aortic regurgitation than patients in the sAVR group (P < 0.001 for both comparisons).
Echocardiographic evaluations showed that the aortic valve area, left ventricular ejection fraction, and mean gradient significantly improved after both TAVI and sAVR. Echocardiographic outcomes were reported as treated.
NYHA Class and Functional Capacity
At 30 days, significantly more patients in the TAVI group were in NYHA class II or lower than patients in the sAVR group (P < 0.001). Among patients who could perform the 6 Minute Walk Test, those in the TAVI group could walk farther than those in the sAVR group. At 1 year, however, the 2 groups did not show significant differences in NYHA class (P = 0.74) or in the 6 Minute Walk Test (median distance 152 m in TAVI and 175 m in sAVR, P = 0.76).
Length of ICU and Hospital Stay
The length of ICU stay was significantly shorter in the TAVI group than the sAVR group (3 days vs. 5 days, P < 0.001). The length of stay for the index hospitalization was also shorter in the TAVI group than in the sAVR group (8 days vs. 12 days, P < 0.001). The rate of repeat hospitalization did not differ between the 2 groups (TAVI 18.2%, sAVR 15.5%, P = 0.38).
As-Treated Analyses
As-treated analyses are shown in Appendix 3.
Summary
The results for cohort A are summarized in Table 6.
Table 6: Summary of Cohort A Results.
| Outcome | TAVI, % | sAVR, % | P value |
|---|---|---|---|
| Conversion rate | 3.2 | 0.3 | — |
| TAVI aborted | 2.0 | — | — |
| Valve embolization | 2.6 | — | — |
| Multiple valve insertion | 2.0 | — | — |
| 30-day mortality | 3.4 | 6.5 | 0.07 |
| 1-year mortality | 24.2 | 26.8 | 0.44 |
| 30-day stroke/transient ischemic attack | 5.5 | 2.4 | 0.04 |
| 1-year stroke/transient ischemic attack | 8.3 | 4.3 | 0.04 |
| 30-day major stroke | 3.8 | 2.1 | 0.2 |
| 1-year major stroke | 5.1 | 2.4 | 0.07 |
| 30-day major vascular complications | 11.0 | 3.2 | < 0.001 |
| 1-year major vascular complications | 11.3 | 3.5 | < 0.001 |
| 30-day major bleeding | 9.3 | 19.5 | < 0.001 |
| 1-year major bleeding | 14.7 | 25.7 | < 0.001 |
| 30-day atrial fibrillation | 8.6 | 16.0 | 0.006 |
| 1-year atrial fibrillation | 12.1 | 17.1 | 0.07 |
| 1-year paravalvular aortic regurgitation | |||
| Moderate/severe | 6.8 | 1.9 | |
| Mild/trace | 60.49 | 20.1 | < 0.001 |
| None | 32.9 | 78 | |
| 1-year transvalvular aortic regurgitation | |||
| Moderate/severe | 0.9 | 0 | |
| Mild/trace | 62.7 | 44.7 | < 0.001 |
| None | 36.4 | 55.3 | |
Abbreviations: sAVR, surgical aortic valve replacement; TAVI, transcatheter aortic valve implantation.
The PARTNER Trial: Cohort B
Patient Characteristics
Cohort B included 358 high-risk patients with severe aortic stenosis at 22 centres (17 in the United States). Baseline characteristics in cohort B closely resembled those in cohort A with respect to common comorbidities. However, cohort B included many patients who had low STS scores but coexisting conditions that contributed to the surgeon’s determination of unsuitability for surgery. These conditions and their respective frequencies were as follows:
porcelain aorta (15.1%)
chest deformity or deleterious effect of chest wall irradiation (13.1%)
oxygen-dependent respiratory insufficiency (23.5%)
frailty (23.1%).
Study Design
The study was a randomized controlled trial using the Edwards SAPIEN valve to test the hypothesis that TAVI is superior to ST with respect to the primary endpoint.
Randomization
Patients were randomly assigned to either TAVI (n = 179) or ST (n = 179). In the ST arm, 150 patients (84%) underwent BV, and the remaining 16% received ST only. The majority of BVs (76%) were performed within the first 30 days after randomization, and the remainder (24%) were performed more than 30 days after randomization. All patients were followed for at least 1 year (median 1.4 years, `maximum 3.3 years).
Power
The study had a power of 85% to show the superiority of TAVI over standard treatment for the primary endpoint.
Primary Endpoint
The primary endpoint was rate of death from any cause at 1 year.
TAVI Procedure
Patients in the TAVI group received heparin during the procedure and dual antiplatelet therapy (Aspirin and clopidogrel) for 6 months after the intervention. TAVI procedures were all performed through the femoral artery. The TF delivery system was either a 22 French to deliver a 23 mm valve or a 24 French to deliver a 26 mm valve.
Results
All analyses were performed based on ITT. In this cohort, baseline characteristics for the most common comorbidities were similar to those in cohort A (see Table 2). Specific health conditions that were more common in cohort B than cohort A are shown in Table 3.
Baseline characteristics of the 2 arms in cohort B were similar, except for the variables shown in Table 7.
Table 7: Baseline Differences Between the Two Arms of Cohort B.
| TAVI | BV/ST | P value | |
|---|---|---|---|
| STS, ± SD | 11.2 ± 5.8 | 12.1 ± 6.1 | 0.04 |
| Logistic EuroSCORE, ± SD | 26.4 ± 17.2 | 30.4 ± 19.1 | 0.04 |
| COPD, % | 41.3 | 52.5 | 0.04 |
| Atrial fibrillation, % | 32.9 | 48.8 | 0.04 |
Abbreviations: BV, balloon valvuloplasty; COPD, chronic obstructive pulmonary disease; EuroSCORE, European System for Cardiac Operative Risk Evaluation; SD, standard deviation; ST, standard treatment; STS, Society of Thoracic Surgeons; TAVI, transcatheter aortic valve implantation.
Periprocedural Outcomes
Table 8 summarizes outcomes during the first 24 hours after TAVI.
Table 8: Outcomes in the First 24 Hours After TAVI.
| Event | n (%) |
|---|---|
| Did not receive TAVI | 6 (3.4)a |
| Died | 2 (1.1) |
| Major stroke | 3 (1.7) |
| Valve embolization | 1 (0.6) |
| Multiple valves ≥ 2 | 2 (1.1) |
| Urgent cardiac surgery | 0 |
Abbreviations: TAVI, transcatheter aortic valve replacement.
2 died before the procedure; 2 for access failure; 2 for anatomical reasons.
Conversion to Surgery
Despite the fact that patients in this cohort were not suitable for surgery, 17 patients in the BV/ST group and 2 patients in the TAVI group underwent sAVR (Table 9).
Table 9: Rate of Surgical or Repeat Intervention.
| TAVI, n (%) | BV/ST, n (%) | P value | |
|---|---|---|---|
| Underwent sAVR | 2 (1.1) | 17 (9.5) | P < 0.001 |
| Repeat BV | — | 30 (16.8) | — |
| Repeat TAVI | 3 (1.7) | — | — |
Abbreviations: BV, balloon valvuloplasty; sAVR, surgical aortic valve replacement; ST, standard treatment; TAVI, transcatheter aortic valve replacement.
Symptom Improvement
The proportion of survivors with mild or no symptoms at 1 year was 74.8% in the TAVI group and 42.0% in the BV/ST group.
Mortality
The rate of death from all causes did not differ significantly between the 2 groups at 30 days, but significantly more patients in the BV/ST group died within 1 year (TAVI 30.7% vs. BV/ST 49.7%, P < 0.001). Rates for all-cause mortality, cardiovascular mortality, composite of all-cause mortality/major stroke, and composite all-cause mortality/repeat hospitalization are shown in Figures 8 and 9.
Figure 8: Mortality Rates at 30 Days.
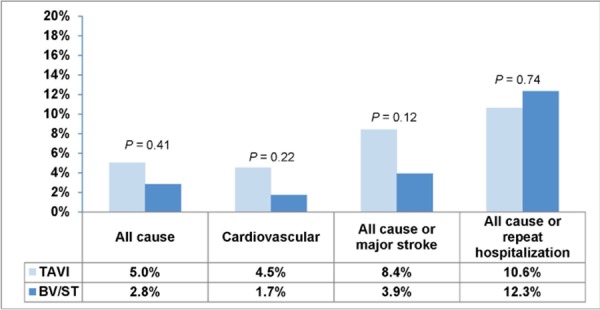
Abbreviations: BV, balloon valvuloplasty; ST, standard treatment; TAVI, transcatheter aortic valve implantation.
Deaths from unknown causes were assumed to be deaths from cardiovascular causes.
Figure 9: Mortality Rates at 1 Year.
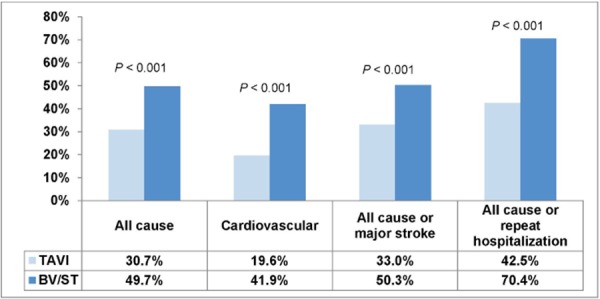
Abbreviations: BV, balloon valvuloplasty; ST, standard treatment; TAVI, transcatheter aortic valve implantation.
Deaths from unknown causes were assumed to be deaths from cardiovascular causes.
Adverse Events
Stroke/TIA
At 30 days and 1 year, the rate of having either a stroke or a TIA was significantly higher in the TAVI group than in the BV/ST group (P = 0.03 and P = 0.04, respectively).
The rate of major stroke at 30 days was 5.0% in the TAVI group and 1.1% in the BV/ST group (P = 0.06). At 1 year the rate of major stroke was twice as high in the TAVI group as in the BV/ST group, but the difference did not reach statistical significance (Figures 10 and 11).
Figure 10: Rate of Stroke/TIA at 30 Days.
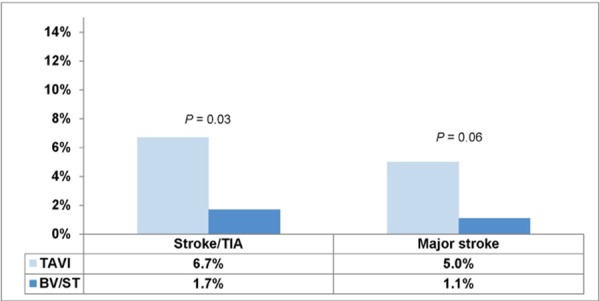
Abbreviations: BV, balloon valvuloplasty; ST, standard treatment; TAVI, transcatheter aortic valve implantation; TIA, transient ischemic attack.
Figure 11: Rate of Stroke/TIA at 1 Year.
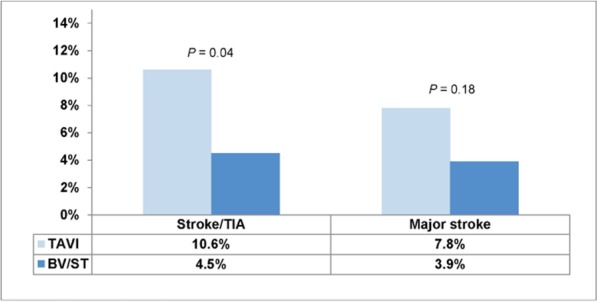
Abbreviations: BV, balloon valvuloplasty; ST, standard treatment; TAVI, transcatheter aortic valve implantation; TIA, transient ischemic attack.
Major Vascular Complications3
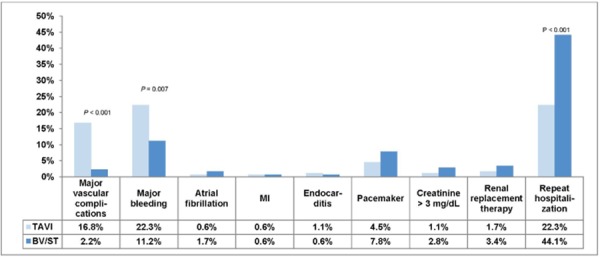
At 30 days and at 1 year, the rate of all vascular complications and the rate of major vascular complications were significantly higher in the TAVI group than in the BV/ST group. At 30 days, the rate of major vascular complications was 16.2% in the TAVI group and 1.1% in the BV/ST group (P < 0.001). Corresponding figures at 1 year were 16.8% in the TAVI group and 2.2% in the BV/ST group (P < 0.001).
Major Bleeding4
At 30 days and at 1 year, the rate of major bleeding was significantly higher in the TAVI group than in the BV/ST group. The rate of major bleeding at 30 days was 16.8% in the TAVI group and 3.9% in the BV/ST group (P < 0.001). Corresponding figures at 1 year were 22.3% in the TAVI group and 11.2% in the BV/ST group (P = 0.007).
Other Adverse Events
The rates of new MI, new atrial fibrillation, new pacemaker insertion, and endocarditis did not differ significantly between the 2 groups. Figures 12 and 13 show adverse events at 30 days and at 1 year.
Figure 12: Rates of Complications at 30 Days.
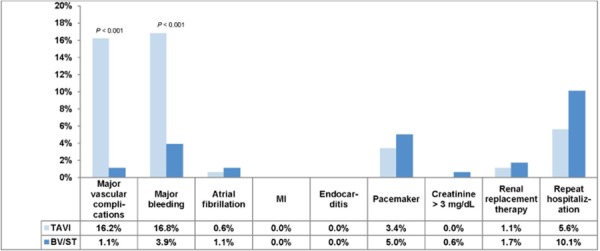
Abbreviations: BV, balloon valvuloplasty; ST, standard treatment; MI, myocardial infarction; TAVI, transcatheter aortic valve implantation.
Figure 13: Rates of Complications at 1 Year.
Abbreviations: BV, balloon valvuloplasty; ST, standard treatment; MI, myocardial infarction; TAVI, transcatheter aortic valve implantation.
With respect to acute kidney injury, the proportion of patients with high creatinine levels (> 3 mg/dL) and renal replacement therapy (both temporary and permanent) did not differ significantly between the TAVI and BV/ST groups at 30 days or 1 year.
Aortic Regurgitation
There was no paravalvular aortic regurgitation in the BV/ST group. In the TAVI group, 11.8% had moderate-to-severe paravalvular aortic regurgitation at 30 days and 10.5% at 1 year. The rates of mild or trace paravalvular aortic regurgitation in the TAVI group were 68% at 30 days and 59% at 1 year.
Summary
The results for cohort B are summarized in Table 10.
Table 10: Summary of Cohort B Results.
| Outcome | TAVI, % | BV/ST, % | P value |
|---|---|---|---|
| Valve embolization | 0.6 | — | — |
| Multiple valve insertion (≥ 2) | 1.1 | — | — |
| Underwent surgery | 1.1 | 9.5 | < 0.001 |
| 1-year survivors who had no/mild symptoms | 74.8 | 42.0 | — |
| 30-day mortality | 5.0 | 2.8 | 0.41 |
| 1-year mortality | 30.7 | 49.7 | < 0.001 |
| 1-year stroke/TIA | 10.6 | 4.5 | 0.04 |
| 1-year major stroke | 7.8 | 3.9 | 0.18 |
| 1-year major vascular complications | 16.8 | 2.2 | < 0.001 |
| 1-year major bleeding | 22.3 | 11.2 | 0.007 |
| 1-year paravalvular aortic regurgitation | |||
| Moderate/severe | 11.0 | 0 | NR |
| Mild/trace | 59.0 | 0 | |
| 1-year transvalvular aortic regurgitation | |||
| Moderate/severe | 4.0 | 15 | NR |
| Mild/trace | 62.0 | 75 |
Abbreviations: BV, balloon valvuloplasty; NR, not reported; ST, standard treatment; TAVI, transcatheter aortic valve replacement; TIA, transient ischemic attack.
Economic Analysis
Disclaimer: Health Quality Ontario uses a standardized costing method for its economic analyses of interventions. The main cost categories and the associated methods from the province’s perspective are as follows:
Hospital: Ontario Case Costing Initiative (OCCI) cost data are used for in-hospital stay, emergency visit and day procedure costs for the designated International Classification of Diseases (ICD) diagnosis codes and Canadian Classification of Health Interventions (CCI) procedure codes. Adjustments may be required to reflect accuracy in estimated costs of the diagnoses and procedures under consideration. Due to the difficulties of estimating indirect costs in hospitals associated with a particular diagnosis or procedure, the secretariat normally defaults to considering direct treatment costs only.
Non-hospital: These include physician services costs obtained from the Ontario Schedule of Benefits (OSB), laboratory fees from the Ontario Schedule of Laboratory Fees (OSLF), drug costs from the Ontario Drug Benefit Formulary (ODB), and device costs from the perspective of local health care institutions whenever possible or its manufacturer.
Discounting: For cost-effectiveness analyses, a discount rate of 5% is applied as recommended by economic guidelines.
Downstream costs: All numbers reported are based on assumptions on population trends (i.e. incidence, prevalence and mortality rates), time horizon, resource utilization, patient compliance, healthcare patterns, market trends (i.e. rates of intervention uptake or trends in current programs in place in the Province), and estimates on funding and prices. These may or may not be realized by the system or individual institutions and are often based on evidence from the medical literature, standard listing references and educated hypotheses from expert panels. In cases where a deviation from this standard is used, an explanation is offered as to the reasons, the assumptions, and the revised approach. The economic analysis represents an estimate only, based on the assumptions and costing methods that have been explicitly stated above. These estimates will change if different assumptions and costing methods are applied to the analysis.
Purpose
The Programs for Assessment of Technology in Health Research Institute, our research partner, recently developed an economic model for Ontario and also reviewed the existing health-economic literature and conference proceedings for TAVI. The unknown cost-effectiveness of TAVI called for a primary economic evaluation.
Objective
The objective of the primary economic analysis was to evaluate the cost-effectiveness of TF TAVI compared with standard treatment (ST) in inoperable patients with severe symptomatic AVS. A secondary analysis sought to evaluate the cost-effectiveness of TF or TA TAVI compared with sAVR in operable patients with severe symptomatic AVS.
Economic Analysis Method
Interventions Evaluated
TF TAVI was compared with ST in inoperable patients with severe symptomatic AVS. TF or TA TAVI was also compared with sAVR in operable patients with severe symptomatic AVS.
Target Population
The target population of this economic analysis was patients in operable and inoperable patients with severe symptomatic AVS.
Perspective
A third-party Canadian payer’s perspective was used to develop an economic model to estimate the expected costs and outcomes in life-years (LYs) and quality-adjusted life-years (QALYs) associated with TAVI (TF), ST, TAVI (TF or TA), and sAVR for patients with severe symptomatic AVS over a 20-year time horizon.
Variability and Uncertainty
Comprehensive sensitivity analyses were used to explore the impact of uncertainty on the cost-effectiveness estimates.
Generalizability
The findings of this economic analysis cannot be generalized to all patients with AVS. They may, however be used to guide decision making about the specific patient populations addressed in the trials investigated at Health Quality Ontario.
Model Structure
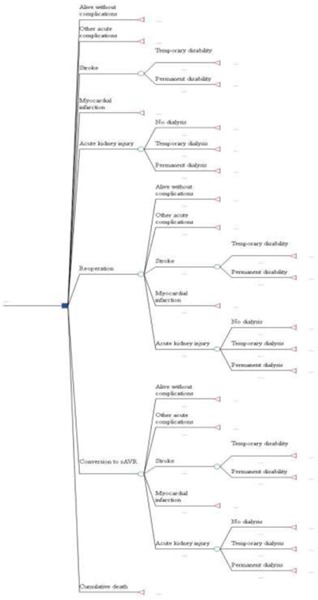
The model comprises a decision tree for a short-term, 30-day postoperative phase and a Markov model for a long-term phase (day 31 to 5 years). The structures of the short-term and long-term models are shown in Figures 14 and 15, respectively.
Figure 14: 30-Day Postoperative Decision Tree.
Abbreviations: sAVR, surgical aortic valve replacement; TA, transapical; TAVI, transcatheter aortic valve implantation; TF, transfemoral.
During the 30-day postoperative phase, patients were at risk of operative death and postoperative complications, including stroke, myocardial infarction, acute kidney injury, other acute complications (endocarditis, major vascular complications, pacemaker implantation, paravalvular leaks, major bleeding and atrial fibrillation), and reoperation. Patients in the TF TAVI and TF/TA TAVI arms were also at risk of conversion to sAVR.
Figure 15: Long-Term Markov Model.
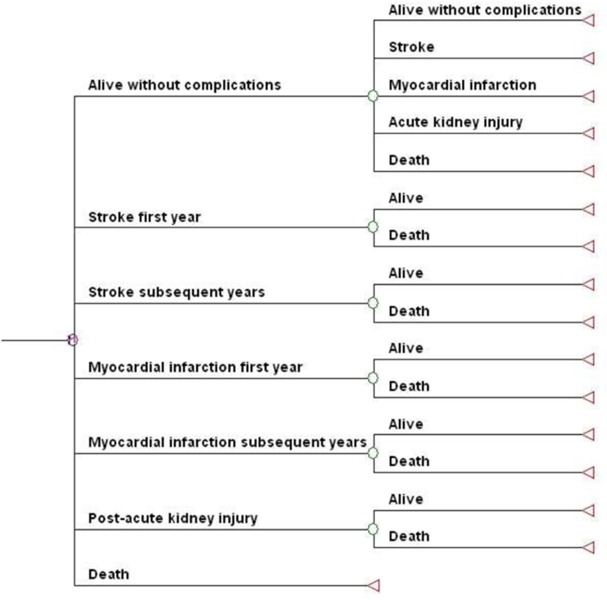
Patients surviving a postoperative complication in the short-term model entered the long-term model in their respective postevent health states. The long-term model for all treatments included stroke, myocardial infarction, and acute kidney injury as complications. Patients surviving other acute complications or experiencing no complications in the short-term model entered the long-term model “alive without complications.” It was assumed that patients in the long-term model continued in the single postevent health state until they died.
The economic model was constructed in Microsoft Excel 2007 (Microsoft, Redmond, Washington, United States) and replicated in TreeAge Pro Suite 2009 (TreeAge Software, Williamstown, Massachusetts, United States). The results derived from both software programs were compared and confirmed to be identical for both the primary and secondary analyses.
Model Input Parameters
Clinical Model Input Parameters
Data from cohorts A and B of the PARTNER trial were used to populate the main parameters of the model. Additionally, a targeted literature search identified relevant studies related to TAVI, ST, and sAVR.
One-year event rates for stroke, MI, and acute kidney injury in all 4 treatment arms were derived from cohorts A and B of the PARTNER trial. These rates were assumed to remain constant over the 20-year time horizon.
Mortality tables derived from a sample of the 2007 Canadian population informed baseline mortality in the model. To match the average age of the PARTNER cohorts, the model used starting ages of 83 and 84 years for the primary and secondary analyses, respectively. Cumulative 30-day postoperative mortality was derived from PARTNER cohorts B and A for the primary and secondary analyses, respectively. One-year mortality for all 4 treatment arms was based on the respective cumulative mortality rates reported in the PARTNER cohorts at 1 year; to avoid double counting, the number of patients dying at 30 days was subtracted from both the numerator and denominator of the cumulative rates. Mortality rates for the long-term phase of the primary analysis were derived from a number of sources. Due to a lack of relevant long-term mortality data in the published literature for the operable patient population, mortality rates were limited to the baseline values derived from the mortality tables for years 2 to 20 of the model.
Cost Model Input Parameters
Relevant costs included the procedural costs of index hospitalization, costs of complications, prescription costs, and costs associated with long-term health states, such as rehospitalization and long-term care facility stays. Costs were derived mainly from Canadian costing studies reported in the literature, as well the Ontario Case Costing Initiative (40) administrative database. Ontario Case Costing Initiative data were used to calculate costs for in-hospital stays, emergency visits, and day procedures for the designated International Classification of Diseases diagnosis codes and Canadian Classification of Health Interventions procedure codes. (41) Costs were discounted at 5% annually and presented in 2010 Canadian dollars.
Procedural costs for TAVI included initial evaluation and testing, hospital and supplies, (42) and $37,606 for the valve. (43) Procedural costs for ST included testing, hospital and supplies, and the balloon catheter. (44) Procedural costs for sAVR (except the percutaneous transluminal approach) were obtained from the identified Case Mix Group 165 cardiac valve repair in patients aged 70 years or older. (41)
Patients surviving either TF or TA TAVI commonly receive clopidogrel (75 mg/day) for 6 months, for a total cost of $472. (45) The recommendation for bioprosthetic valve recipients is warfarin therapy at the international normalized ratio of 2.0 to 3.0; (46) an assumed mean clinical maintenance dose of 5.58 mg/day (47) brings the total annual per-patient cost of drug treatment to $162. (45) Patients with chronic heart failure receive the following drugs (proportions in parentheses): Aspirin (55.4%), beta blockers (50.2%), angiotensin-converting enzyme inhibitors (45.8%), and statins (42.1%). (45) Based on respective cost estimates for Aspirin, bisoprolol 10 mg/day, captopril 127 mg/day, and atorvastatin 10 mg/day, this translates to a total annual per-patient cost of $642 for the ST treatment arm. (45)
Utility Model Input Parameters
QALYs were calculated by multiplying the probabilities of postoperative complications by quality-of-life estimates (utilities). NYHA functional class utility values estimated by Gohler et al (48) were used to adjust baseline quality of life. Differences in the proportion of patients in each NYHA functional class were based on data from the 2 PARTNER cohorts. Due to the lack of long-term data for TAVI, 1 year NYHA functional class proportions were carried forward for all 4 treatment arms for years 2 to 20 of the model.
Cost Utility Analysis Results
In the primary analysis, comparing TAVI and ST in inoperable patients resulted in an incremental cost-effectiveness ratio (ICER) of $33,141 per life-year (LY) and $48,912 per quality-adjusted life-year (QALY). The secondary analysis (comparing TAVI [TF or TA] with sAVR in operable patients) yielded an ICER of $870,143 per LY, with TAVI being dominated by sAVR, when expressing benefits as QALYs. Table 11 reflects the base case results of the economic model.
Table 11: Base Case Results.
| Strategy | Costs ($ Cdn) | LYs | QALYs | Cost/LY ($ Cdn) |
Cost/QALY ($ Cdn) |
|---|---|---|---|---|---|
| Inoperable treatment arm | |||||
| TAVI (TF) | 79,755 | 2.713 | 1.802 | — | — |
| ST | 48,552 | 1.772 | 1.164 | — | — |
| Incremental (TAVI vs. ST) | 31,203 | 0.942 | 0.638 | 33,141 | 48,912 |
| Operable treatment arm | |||||
| TAVI (TF/TA) | 85,755 | 4.092 | 2.913 | — | — |
| sAVR | 74,602 | 4.079 | 3.014 | — | — |
| Incremental (TAVI vs. sAVR) | 11,153 | 0.0128 | –0.102 | 870,143 | Dominated |
Abbreviations: LY, life-years; QALY, quality-adjusted life-years; sAVR, surgical aortic valve replacement; ST, standard treatment; TA, transapical; TF, transfemoral; TAVI, transcatheter aortic valve implantation.
This primary analysis, along with emerging economic literature, suggests that (depending on assumptions made regarding long-term mortality, costs, and quality-of life impact) TAVI appears to be cost-effective in inoperable patients (i.e., ICER < $50,000 per QALY). The sensitivity analysis established that the difference in intervention costs between TAVI and ST, 1-year mortality rates of TAVI and ST, and improvements in QALYs were sensitive parameters in the model.
Assumptions used in the long-term predictions significantly influenced the results of the sensitivity analysis. These assumptions include:
cost of TAVI and follow-up care
cost of ST (i.e., no TAVI) each year
long-term mortality of TAVI and ST patients after 1 year
quality-of life improvement (if any) for TAVI versus ST patients
As considerable uncertainty surrounds these 4 critical parameters for Ontario patients, the cost-effectiveness of TAVI remains uncertain for these patients. The base case cost-effectiveness was $48,912 per QALY, but the ICERs ranged from $36,000 to $291,000 per QALY, depending on the assumptions made in the long-term portion of the model (i.e., beyond the follow-up period of the PARTNER trial). Table 12 illustrates the uncertainty around these 4 parameters and their respective ICERs.
Table 12: Sensitivity Analysis—ICERs When Intervention Cost, Mortality, and QALY Are Varied.
| Difference in Cost Between Interventions (Increase in TAVI and Reduction in ST) |
Base Case ($Cdn) |
$10,000 (Cdn) | $20,000 (Cdn) | $30,000 (Cdn) |
|---|---|---|---|---|
| Increment in QALY | Base case mortality after 1 year | |||
| 0 | 61,483 | 81,188 | 100,892 | 120,596 |
| 0.02 | 57,355 | 75,736 | 94,117 | 112,498 |
| 0.04 | 53,746 | 70,970 | 88,195 | 105,419 |
| 0.06 | 50,564 | 66,769 | 82,974 | 99,179 |
| 0.08 | 47,738 | 63,037 | 78,336 | 93,635 |
| 0.1 | 45,211 | 59,700 | 74,190 | 88,679 |
| 0.12 | 42,938 | 56,699 | 70,460 | 84,221 |
| 0.14 | 40,883 | 53,985 | 67,088 | 80,190 |
| 0.16 | 39,016 | 51,519 | 64,023 | 76,527 |
| 0.18 | 37,311 | 49,269 | 61,226 | 73,184 |
| 0.2 | 35,750 | 47,207 | 58,664 | 70,121 |
| Mortality after 1 year: 0.50 for both ST and TAVI | ||||
| 0 | 136,335 | 187,891 | 239,447 | 291,003 |
| 0.02 | 117,919 | 162,510 | 207,102 | 251,694 |
| 0.04 | 103,886 | 143,171 | 182,456 | 221,741 |
| 0.06 | 92,838 | 127,945 | 163,052 | 198,159 |
| 0.08 | 83,913 | 115,646 | 147,378 | 179,111 |
| 0.1 | 76,555 | 105,504 | 134,454 | 163,404 |
| 0.12 | 70,382 | 96,998 | 123,614 | 150,229 |
| 0.14 | 65,131 | 89,761 | 114,391 | 139,020 |
| 0.16 | 60,609 | 83,529 | 106,449 | 129,368 |
| 0.18 | 56,674 | 78,106 | 99,538 | 120,969 |
| 0.2 | 53,219 | 73,344 | 93,469 | 113,595 |
| Mortality after 1 year: 0.50 for ST and 0.30 for TAVI | ||||
| 0 | 85,630 | 115,730 | 145,830 | 175,929 |
| 0.02 | 77,977 | 105,386 | 132,795 | 160,205 |
| 0.04 | 71,579 | 96,739 | 121,900 | 147,060 |
| 0.06 | 66,151 | 89,404 | 112,657 | 135,909 |
| 0.08 | 61,489 | 83,103 | 104,716 | 126,330 |
| 0.1 | 57,440 | 77,631 | 97,822 | 118,012 |
| 0.12 | 53,892 | 72,836 | 91,779 | 110,722 |
| 0.14 | 50,757 | 68,598 | 86,439 | 104,280 |
| 0.16 | 47,966 | 64,826 | 81,687 | 98,547 |
| 0.18 | 45,466 | 61,448 | 77,430 | 93,411 |
| 0.2 | 43,214 | 58,404 | 73,594 | 88,784 |
Abbreviations: QALY, quality-adjusted life-year; ST, standard treatment; TAVI, transcatheter aortic valve implantation.
Discussion
Although TAVI appears to be cost-effective in the inoperable patient cohort, additional and longer-term data are needed to determine whether the procedure will be cost-effective over the long term. In the secondary analysis, data suggest that, compared with sAVR, TAVI (TF or TA) is not cost-effective for operable severe symptomatic AVS patients.
Conclusions
In patients who are unsuitable for sAVR, TAVI improves survival. In patients who are candidates for surgery, TAVI has a mortality rate similar to that of sAVR, but is associated with significant adverse effects. The economic evaluation suggests that TAVI may be cost-effective for patients who cannot undergo surgery (although more data are needed for confirmation), but is not cost-effective for patients who can.
Appendices
Appendix 1: Search Strategy
Search date: September 6, 2011
Databases searched: OVID MEDLINE, MEDLINE In-Process and Other Non-Indexed Citations, OVID EMBASE, Wiley Cochrane, Centre for Reviews and Dissemination/International Agency for Health Technology Assessment
Database: Ovid MEDLINE(R) <1948 to August Week 4 2011>, Ovid MEDLINE(R) In-Process & Other Non-Indexed Citations <September 02, 2011>, Embase <1980 to 2011 Week 35>
Search Strategy:
-----------------------------------------------------------------------------
1 exp Heart Valve Prosthesis Implantation/ or exp Heart Valve Prosthesis/ use mesz (32999)
exp Aorta Valve Replacement/ or exp aorta valve prosthesis/ use emez (11010)
((aorta or aortic) adj2 (replace* or implant* or prosthe* or bioprosthe* or transplant*)).ti,ab. (28918)
avr.ti,ab. (5414)
or/1-4 (60195)
exp Aortic Valve Stenosis/ use mesz (25760)
exp Aorta Valve Stenosis/ use emez (9291)
((supravalvular or subvalvular or aort*) adj2 stenos?s).ti,ab. (23217)
or/6-8 (45943)
exp Surgical Procedures, Minimally Invasive/ use mesz (311440)
exp Minimally Invasive Surgery/ use emez (17937)
(transcatheter* or trans-catheter* or transfemoral or trans-femoral or transapical or trans-apical or percutaneous).ti,ab. (198210)
(minimal* adj3 (surgery or surgeries or surgical or procedure* or invasive)).ti,ab. (67980)
or/10-13 (531130)
5 and 9 and 14 (2195)
(core-valve or corevalve or Cribier-Edwards or Edwards-Sapien or TAVI).ti,ab. (1400)
15 or 16 (2660)
limit 17 to english language (2370)
limit 18 to yr=“2004 -Current” (2163)
limit 19 to human (1496)
19 (2163)
limit 21 to humans (1496)
20 or 22 (1496)
remove duplicates from 23 (950)
Appendix 2: GRADE Tables
Table A1: GRADE Evidence Profile for TAVI: Cohort A.
| No. of Studies (Design) | Risk of Bias | Inconsistency | Indirectness | Imprecision | Publication Bias | Upgrade Considerations | Quality |
|---|---|---|---|---|---|---|---|
| Outcome: Death rate at 1 year | |||||||
| 1 (RCT) | No serious limitations | NA | No serious limitations | No serious limitations | NA | NA | ⊕⊕⊕⊕ High |
| Outcome: Symptom improvement | |||||||
| 1 (RCT) | No serious limitations | NA | No serious limitations | No serious limitations | NA | NA | ⊕⊕⊕⊕ High |
| Outcome: Safety measures | |||||||
| 1 (RCT) | No serious limitations | NA | No serious limitations | No serious limitations | NA | NA | ⊕⊕⊕⊕ High |
Abbreviations: No., number; NA, not applicable; RCT, randomized controlled trial.
Table A2: GRADE Evidence Profile for TAVI: Cohort B.
| No. of Studies (Design) | Risk of Bias | Inconsistency | Indirectness | Imprecision | Publication Bias | Upgrade Considerations | Quality |
|---|---|---|---|---|---|---|---|
| Outcome: Death rate at 1 year | |||||||
| 1 (RCT) | No serious limitations | NA | No serious limitations | No serious limitations | NA | NA | ⊕⊕⊕⊕ High |
| Outcome: Symptom improvement | |||||||
| 1 (RCT) | No serious limitations | NA | No serious limitations | No serious limitations | NA | NA | ⊕⊕⊕⊕ High |
| Outcome: Safety measures | |||||||
| 1 (RCT) | No serious limitations | NA | No serious limitations | No serious limitations | NA | NA | ⊕⊕⊕⊕ High |
Abbreviations: No., number; NA, not applicable; RCT, randomized controlled trial.
Appendix 3: Results of As-Treated Analyses
Figure A1: Death and Adverse Events at 30 Days, TAVI vs. sAVRa.
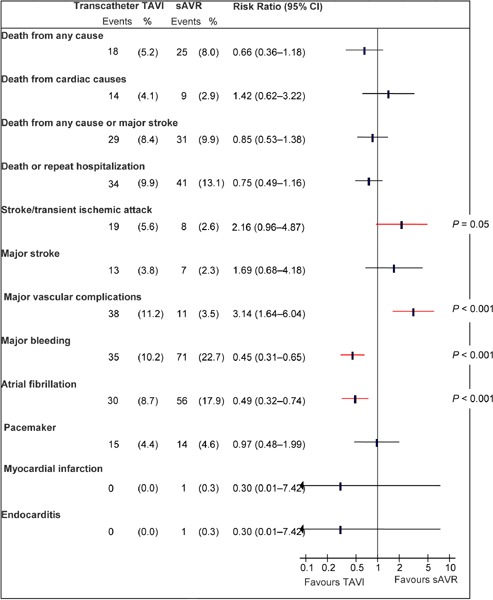
Abbreviations: CI, confidence interval; sAVR, surgical aortic valve replacement; TAVI, transcatheter aortic valve implantation.
Data and calculations as per published report.
Source: Smith et al, 2011 (37)
Figure A2: Death and Adverse Events at 1 Year, TAVI vs. sAVRa.
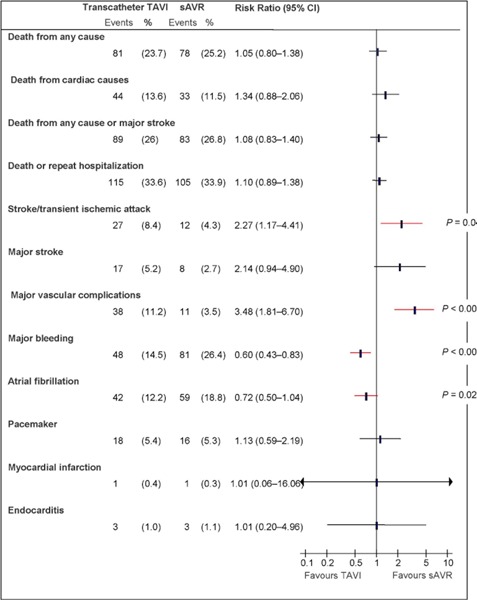
Abbreviations: CI, confidence interval; sAVR, surgical aortic valve replacement; TAVI, transcatheter aortic valve implantation.
Data and calculations as per published report.
Source: Smith et al, 2011 (37)
Figure A3: Death and Adverse Events at 30 Days, TF TAVI vs. sAVRa.
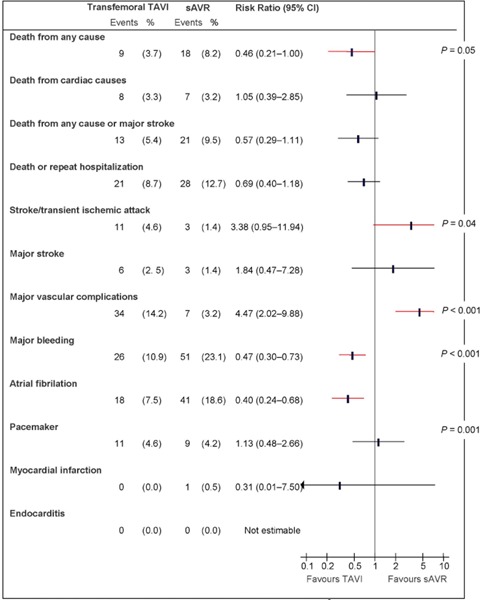
Abbreviations: CI, confidence interval; sAVR, surgical aortic valve replacement; TAVI, transcatheter aortic valve implantation; TF, transfemoral.
Data and calculations as per published report.
Source: Smith et al, 2011 (37)
Figure A4: Death and Adverse Events at 1 Year, TF TAVI vs. sAVRa.
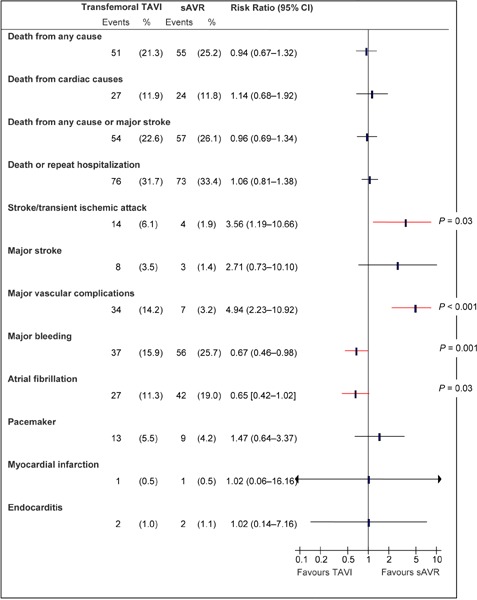
Abbreviations: CI, confidence interval; sAVR, surgical aortic valve replacement; TAVI, transcatheter aortic valve implantation; TF, transfemoral.
Data and calculations as per published report.
Source: Smith et al, 2011 (37)
Figure A5: Death and Adverse Events at 30 Days, TA TAVI vs. sAVRa.
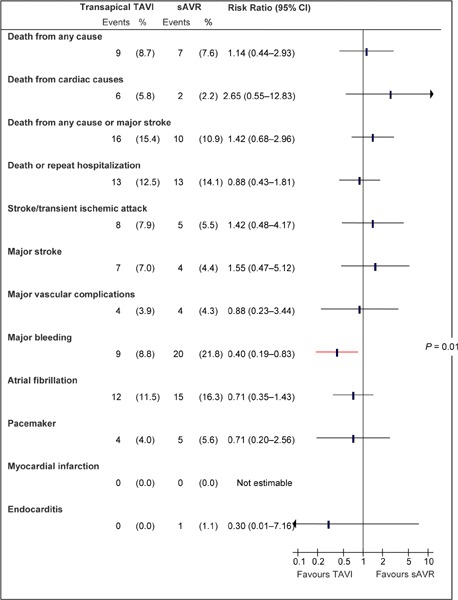
Abbreviations: CI, confidence interval; sAVR, surgical aortic valve replacement; TA, transapical; TAVI, transcatheter aortic valve implantation.
Data and calculations as per published report.
Source: Smith et al, 2011 (37)
Figure A6: Death and Adverse Events at 1 Year, TA TAVI vs. sAVRa.
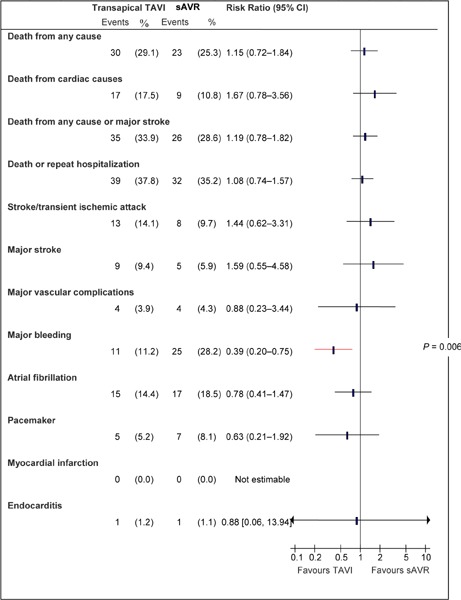
Abbreviations: CI, confidence interval; sAVR, surgical aortic valve replacement; TA, transapical; TAVI, transcatheter aortic valve implantation.
Data and calculations as per published report.
Source: Smith et al, 2011 (37)
Suggested Citation
This report should be cited as follows: Sehatzadeh S, Doble B, Xie F, Blackhouse G, Campbell K, Kaulback K, Chandra K, Goeree R. Transcatheter aortic valve implantation (TAVI) for treatment of aortic valve stenosis: an evidence-based analysis (part B). Ont Health Technol Assess Ser [Internet]. 2012 May;12(14):1-62. Available from: www.hqontario.ca/en/eds/tech/pdfs/2012/rev_TAVI_May.pdf
Indexing
The Ontario Health Technology Assessment Series is currently indexed in Excerpta Medica/EMBASE and the Center for Reviews and Dissemination database.
Permission Requests
All inquiries regarding permission to reproduce any content in the Ontario Health Technology Assessment Series should be directed to: MASinfo@hqontario.ca.
How to Obtain Issues in the Ontario Health Technology Assessment Series
All reports in the Ontario Health Technology Assessment Series are freely available in PDF format at the following URL: http://www.hqontario.ca/en/mas/mas_ohtas_mn.html.
Conflict of Interest Statement
All analyses in the Ontario Health Technology Assessment Series are impartial and subject to a systematic evidence-based assessment process. There are no competing interests or conflicts of interest to declare.
Peer Review
All analyses in the Ontario Health Technology Assessment Series are subject to external expert peer review. Additionally, the public consultation process is also available to individuals wishing to comment on an analysis prior to finalization. For more information, please visit: http://www.hqontario.ca/en/mas/ohtac_public_engage_overview.html.
Health Quality Ontario
130 Bloor Street West, 10th Floor
Toronto, Ontario
M5S 1N5
Tel: 416-323-6868
Toll Free: 1-866-623-6868
Fax: 416-323-9261
Email: MASinfo@hqontario.ca
ISSN 1915-7398 (online)
ISBN 978-1-4435-8437-1 (PDF)
© Queen’s Printer for Ontario, 2012
About the Medical Advisory Secretariat
Effective April 5, 2011, the Medical Advisory Secretariat (MAS) became a part of Health Quality Ontario (HQO), an independent body funded by the Ministry of Health and Long-Term Care. The mandate of MAS is to provide evidence-based recommendations on the coordinated uptake of health services and health technologies in Ontario to the Ministry of Health and Long-Term Care and to the health care system. This mandate helps to ensure that residents of Ontario have access to the best available and most appropriate health services and technologies to improve patient outcomes.
To fulfill its mandate, MAS conducts systematic reviews of evidence and consults with experts in the health care services community. The resulting evidence-based analyses are reviewed by the Ontario Health Technology Advisory Committee—to which MAS also provides a secretariat function—and published in the Ontario Health Technology Assessment Series.
About the Ontario Health Technology Assessment Series
To conduct its comprehensive analyses, MAS systematically reviews the available scientific literature, making every effort to consider all relevant national and international research; collaborates with partners across relevant government branches; consults with clinical and other external experts and developers of new health technologies; and solicits any necessary supplemental information.
In addition, the Secretariat collects and analyzes information about how a new technology fits within current practice and existing treatment alternatives. Details about the technology’s diffusion into current health care practices add an important dimension to the review of the provision and delivery of the health technology in Ontario. Information concerning the health benefits; economic and human resources; and ethical, regulatory, social and legal issues relating to the technology assist decision-makers in making timely and relevant decisions to optimize patient outcomes.
The public consultation process is available to individuals wishing to comment on an analysis prior to publication. For more information, please visit: http://www.hqontario.ca/en/mas/ohtac_public_engage_overview.html.
Disclaimer
This evidence-based analysis was prepared by MAS for the Ontario Health Technology Advisory Committee and developed from analysis, interpretation, and comparison of scientific research and/or technology assessments conducted by other organizations. It also incorporates, when available, Ontario data and information provided by experts and applicants to MAS to inform the analysis. While every effort has been made to reflect all scientific research available, this document may not fully do so. Additionally, other relevant scientific findings may have been reported since completion of the review. This evidence-based analysis is current to the date of the literature review specified in the methods section. This analysis may be superseded by an updated publication on the same topic. Please check the MAS website for a list of all evidence-based analyses: http://www.hqontario.ca/en/mas/mas_ohtas_mn.html.
List of Tables
| Table 1: Body of Evidence Examined According to Study Design |
| Table 2: Baseline Characteristics, Cohort A and Cohort B |
| Table 3: Additional Comorbidities, Cohort A vs. Cohort B |
| Table 4: Periprocedural Events Following TAVI |
| Table 5: Expected and Actual Mortality for Patients Undergoing sAVR |
| Table 6: Summary of Cohort A Results |
| Table 7: Baseline Differences Between the Two Arms of Cohort B |
| Table 8: Outcomes in the First 24 Hours After TAVI |
| Table 9: Rate of Surgical or Repeat Intervention |
| Table 10: Summary of Cohort B Results |
| Table 11: Base Case Results |
| Table 12: Sensitivity Analysis—ICERs When Intervention Cost, Mortality, and QALY Are Varied |
| Table A1: GRADE Evidence Profile for TAVI: Cohort A |
| Table A2: GRADE Evidence Profile for TAVI: Cohort B |
List of Figures
| Figure 1: Randomization Scheme for Cohort A |
| Figure 2: Death and Adverse Events at 30 Days (ITT), TAVI vs. sAVRa |
| Figure 3: Death and Adverse Events at 1 Year (ITT), TAVI vs. sAVRa |
| Figure 4: Death and Adverse Events at 30 Days (ITT), TF TAVI vs. sAVRa |
| Figure 5: Death and Adverse Events at 1 Year (ITT), TF TAVI vs. sAVRa |
| Figure 6: Death and Adverse Events at 30 Days (ITT), TA TAVI vs. sAVRa |
| Figure 7: Death and Adverse Events at 1 Year (ITT), TA TAVI vs. sAVRa |
| Figure 8: Mortality Rates at 30 Days |
| Figure 9: Mortality Rates at 1 Year |
| Figure 10: Rate of Stroke/TIA at 30 Days |
| Figure 11: Rate of Stroke/TIA at 1 Year |
| Figure 12: Rates of Complications at 30 Days |
| Figure 13: Rates of Complications at 1 Year |
| Figure 14: 30-Day Postoperative Decision Tree |
| Figure 15: Long-Term Markov Model |
| Figure A1: Death and Adverse Events at 30 Days, TAVI vs. sAVRa |
| Figure A2: Death and Adverse Events at 1 Year, TAVI vs. sAVRa |
| Figure A3: Death and Adverse Events at 30 Days, TF TAVI vs. sAVRa |
| Figure A4: Death and Adverse Events at 1 Year, TF TAVI vs. sAVRa |
| Figure A5: Death and Adverse Events at 30 Days, TA TAVI vs. sAVRa |
| Figure A6: Death and Adverse Events at 1 Year, TA TAVI vs. sAVRa |
List of Abbreviations
- AVS
Aortic valve stenosis
- BV
Balloon valvuloplasty
- CABG
Coronary artery bypass graft
- CAD
Coronary artery disease
- CE
Conformité Européenne
- COPD
Chronic obstructive pulmonary disease
- EuroSCORE
European System for Cardiac Operative Risk Evaluation
- ICER
Incremental cost-effectiveness ratio
- ICU
Intensive care unit
- ITT
Intention-to-treat
- LY
Life-year
- MI
Myocardial infarction
- NR
Not reported
- NYHA
New York Heart Association
- PCI
Percutaneous coronary intervention
- QALY
Quality-adjusted life-year
- RCT
Randomized controlled trial
- RVP
Rapid ventricular pacing
- sAVR
Surgical aortic valve replacement
- SD
Standard deviation
- ST
Standard treatment
- STS
Society of Thoracic Surgeons
- TA
Transapical
- TAVI
Transcatheter aortic valve implantation
- TF
Transfemoral
- TIA
Transient ischemic attack
Footnotes
- any thoracic aortic dissection
- access-site or access-related vascular injury (dissection, stenosis, perforation, rupture, atriovenous fistula, pseudo-aneurysm, hematoma, irreversible nerve injury, or compartment syndrome) leading to either death, need for significant blood transfusion (> 3 units), unplanned surgical or percutaneous intervention, or irreversible end-organ damage
- distal embolization (noncerebral) from a vascular source requiring surgery or resulting in amputation or irreversible end-organ damage
- left ventricular perforation
- death
- hospitalization
- prolonged hospitalization of at least 24 hours for treatment of bleeding
- required pericardiosynthesis
- required open/endovascular procedure for repair or hemostasis
- permanent disability (blindness, paralysis, hearing loss)
- transfusion of > 3 units of blood within a 24-hour period
- any thoracic aortic dissection
- access-site or access-related vascular injury (dissection, stenosis, perforation, rupture, atriovenous fistula, pseudoaneurysm, hematoma, irreversible nerve injury, or compartment syndrome) leading to either death, need for significant blood transfusion (> 3 units), unplanned surgical or percutaneous intervention, irreversible end organ damage
- distal embolization (noncerebral) from a vascular source requiring surgery or resulting in amputation or irreversible end-organ damage
- left ventricular perforation
- death
- hospitalization
- prolonged hospitalization of at least 24 hours for treatment of bleeding
- required pericardiosynthesis
- required open/endovascular procedure for repair of hemostasis
- permanent disability (blindness, paralysis, hearing loss)
- transfusion of > 3 units of blood within a 24-hour period
References
- 1.Rajamannan NM, Subramaniam M, Rickard D, Stock SR, Donovan J, Springett M, et al. Human aortic valve calcification is associated with an osteoblast phenotype. Circulation. 2003 May 6;107(17):2181–4. doi: 10.1161/01.CIR.0000070591.21548.69. [DOI] [PMC free article] [PubMed] [Google Scholar]
- 2.Mohler ER, Gannon F, Reynolds C, Zimmerman R, Keane MG, Kaplan FS. Bone formation and inflammation in cardiac valves. Circulation. 2001 Mar 20;103(11):1522–8. doi: 10.1161/01.cir.103.11.1522. [DOI] [PubMed] [Google Scholar]
- 3.Iung B, Vahanian A. Epidemiology of valvular heart disease in the adult. Nat Rev Cardiol. 2011 Mar;8(3):162–72. doi: 10.1038/nrcardio.2010.202. [DOI] [PubMed] [Google Scholar]
- 4.Stewart BF, Siscovick D, Lind BK, Gardin JM, Gottdiener JS, Smith VE, et al. Clinical factors associated with calcific aortic valve disease. Cardiovascular Health Study. J Am Coll Cardiol. 1997 Mar 1;29(3):630–4. doi: 10.1016/s0735-1097(96)00563-3. [DOI] [PubMed] [Google Scholar]
- 5.Yuan SM, Jing H. The bicuspid aortic valve and related disorders. Sao Paulo Med J. 2010;128(5):296–301. doi: 10.1590/S1516-31802010000500010. [DOI] [PMC free article] [PubMed] [Google Scholar]
- 6.Tzemos N, Therrien J, Yip J, Thanassoulis G, Tremblay S, Jamorski MT, et al. Outcomes in adults with bicuspid aortic valves. JAMA. 2008 Sep 17;300(11):1317–25. doi: 10.1001/jama.300.11.1317. [DOI] [PubMed] [Google Scholar]
- 7.Michelena HI, Desjardins VA, Avierinos JF, Russo A, Nkomo VT, Sundt TM, et al. Natural history of asymptomatic patients with normally functioning or minimally dysfunctional bicuspid aortic valve in the community. Circulation. 2008 May 27;117(21):2776–84. doi: 10.1161/CIRCULATIONAHA.107.740878. [DOI] [PMC free article] [PubMed] [Google Scholar]
- 8.Kaleschke G, Baumgartner H. Asymptomatic aortic stenosis: when to operate? Curr Cardiol Rep. 2011 Jun;13(3):220–5. doi: 10.1007/s11886-011-0178-1. [DOI] [PubMed] [Google Scholar]
- 9.Leggett M, Otto CM. Aortic valve disease. Curr Opin Cardiol. 1996 Mar;11(2):120–5. doi: 10.1097/00001573-199603000-00004. [DOI] [PubMed] [Google Scholar]
- 10.Zigelman CZ, Edelstein PM. Aortic valve stenosis. Anesthesiol Clin. 2009 Sep;27(3):519–32. doi: 10.1016/j.anclin.2009.07.012. [DOI] [PubMed] [Google Scholar]
- 11.O’Brien KD, Reichenbach DD, Marcovina SM, Kuusisto J, Alpers CE, Otto CM. Apolipoproteins B, (a), and E accumulate in the morphologically early lesion of ‘degenerative’ valvular aortic stenosis. Arterioscler Thromb Vasc Biol. 1996 Apr;16(4):523–32. doi: 10.1161/01.atv.16.4.523. [DOI] [PubMed] [Google Scholar]
- 12.Rabus MB, Kayalar N, Sareyyupoglu B, Erkin A, Kirali K, Yakut C. Hypercholesterolemia association with aortic stenosis of various etiologies. J Card Surg. 2009 Mar;24(2):146–50. doi: 10.1111/j.1540-8191.2009.00814.x. [DOI] [PubMed] [Google Scholar]
- 13.Anvari MS, Boroumand MA, Karimi A, Alidoosti M, Yazdanifard P, Shirzad M, et al. Aortic and mitral valve atherosclerosis: predictive factors and associations with coronary atherosclerosis using Gensini score. Arch Med Res. 2009 Feb;40(2):124–7. doi: 10.1016/j.arcmed.2008.12.003. [DOI] [PubMed] [Google Scholar]
- 14.Otto CM, Mickel MC, Kennedy JW, Alderman EL, Bashore TM, Block PC, et al. Three-year outcome after balloon aortic valvuloplasty. Insights into prognosis of valvular aortic stenosis. Circulation. 1994 Feb;89(2):642–50. doi: 10.1161/01.cir.89.2.642. [DOI] [PubMed] [Google Scholar]
- 15.Walther T, Simon P, Dewey T, Wimmer-Greinecker G, Falk V, Kasimir MT, et al. Transapical minimally invasive aortic valve implantation: multicenter experience. Circulation. 2007;116(11 suppl):1240–5. doi: 10.1161/CIRCULATIONAHA.106.677237. [DOI] [PubMed] [Google Scholar]
- 16.Bonow RO, Carabello BA, Chatterjee K, de Leon ACJ, Faxon DP, Freed MD, et al. ACC/AHA 2006 guidelines for the management of patients with valvular heart disease: a report of the American College of Cardiology/American Heart Association Task Force on Practice Guidelines (writing Committee to Revise the 1998 guidelines for the management of patients with valvular heart disease) developed in collaboration with the Society of Cardiovascular Anesthesiologists endorsed by the Society for Cardiovascular Angiography and Interventions and the Society of Thoracic Surgeons. J Am Coll Cardiol. 2006 Aug 1;48(3):e1–148. doi: 10.1016/j.jacc.2006.05.021. [DOI] [PubMed] [Google Scholar]
- 17.Brown JM, O’Brien SM, Wu C, Sikora JA, Griffith BP, Gammie JS. Isolated aortic valve replacement in North America comprising 108,687 patients in 10 years: changes in risks, valve types, and outcomes in the Society of Thoracic Surgeons National Database. J Thorac Cardiovasc Surg. 2009 Jan;137(1):82–90. doi: 10.1016/j.jtcvs.2008.08.015. [DOI] [PubMed] [Google Scholar]
- 18.Leon MB, Kodali S, Williams M, Oz M, Smith C, Stewart A, et al. Transcatheter aortic valve replacement in patients with critical aortic stenosis: rationale, device descriptions, early clinical experiences, and perspectives. Semin Thorac Cardiovasc Surg. 2006;18(2):165–74. doi: 10.1053/j.semtcvs.2006.08.002. [DOI] [PubMed] [Google Scholar]
- 19.Lindroos M, Kupari M, Heikkila J, Tilvis R. Prevalence of aortic valve abnormalities in the elderly: an echocardiographic study of a random population sample. J Am Coll Cardiol. 1993 Apr;21(5):1220–5. doi: 10.1016/0735-1097(93)90249-z. [DOI] [PubMed] [Google Scholar]
- 20.Cheitlin MD. Asymptomatic adult patients with aortic stenosis: should they ever have aortic valve replacement? Am Heart Hosp J. 2005;3(4):243–6. doi: 10.1111/j.1541-9215.2005.04258.x. [DOI] [PubMed] [Google Scholar]
- 21.Rafique AM, Biner S, Ray I, Forrester JS, Tolstrup K, Siegel RJ. Meta-analysis of prognostic value of stress testing in patients with asymptomatic severe aortic stenosis. Am J Cardiol. 2009 Oct 1;104(7):972–7. doi: 10.1016/j.amjcard.2009.05.044. [DOI] [PubMed] [Google Scholar]
- 22.van GM, Piazza N, Bogers AJ, Takkenberg JJ, Kappetein AP. How to assess risks of valve surgery: quality, implementation and future of risk models. Heart. 2009 Dec;95(23):1958–63. doi: 10.1136/hrt.2007.136259. [DOI] [PubMed] [Google Scholar]
- 23.Euroscore Study Group. Euroscore interactive calculator [Internet] [[updated 2011; cited 2011 Dec 1]]. Available from: http://www.euroscore.org/calc.html .
- 24.Chang AS, Smedira NG, Chang CL, Benavides MM, Myhre U, Feng J, et al. Cardiac surgery after mediastinal radiation: extent of exposure influences outcome. J Thorac Cardiovasc Surg. 2007 Feb;133(2):404–13. doi: 10.1016/j.jtcvs.2006.09.041. [DOI] [PubMed] [Google Scholar]
- 25.Rodes-Cabau J, Webb JG, Cheung A, Ye J, Dumont E, Feindel CM, et al. Transcatheter aortic valve implantation for the treatment of severe symptomatic aortic stenosis in patients at very high or prohibitive surgical risk. acute and late outcomes of the multicenter Canadian experience. J Am Coll Cardiol. 2010 Mar 16;55(11):1080–90. doi: 10.1016/j.jacc.2009.12.014. [DOI] [PubMed] [Google Scholar]
- 26.Dewey TM, Brown D, Ryan WH, Herbert MA, Prince SL, Mack MJ. Reliability of risk algorithms in predicting early and late operative outcomes in high-risk patients undergoing aortic valve replacement. J Thorac Cardiovasc Surg. 2008 Jan;135(1):180–7. doi: 10.1016/j.jtcvs.2007.09.011. [DOI] [PubMed] [Google Scholar]
- 27.Bagur R, Rodes-Cabau J. Appropriate assessment of operative risk in patients with severe symptomatic aortic stenosis: importance for patient selection in the era of transcatheter aortic valve implantation. Ann Thorac Surg. 2011 Sep;92(3):1157–8. doi: 10.1016/j.athoracsur.2011.03.080. [DOI] [PubMed] [Google Scholar]
- 28.Koene BM, van Straten AH, Soliman Hamad MA, Berreklouw E, Ter Woorst JF, Tan ME, et al. Predictive value of the additive and Logistic EuroSCOREs in patients undergoing aortic valve replacement. J Cardiothorac Vasc Anesth. 2011 Dec;25(6):1071–5. doi: 10.1053/j.jvca.2011.05.010. [DOI] [PubMed] [Google Scholar]
- 29.Parolari A, Pesce LL, Trezzi M, Cavallotti L, Kassem S, Loardi C, et al. EuroSCORE performance in valve surgery: a meta-analysis. Ann Thorac Surg. 2010 Mar;89(3):787–93. doi: 10.1016/j.athoracsur.2009.11.032. 793.e1-2. [DOI] [PubMed] [Google Scholar]
- 30.Osswald BR, Gegouskov V, Badowski-Zyla D, Tochtermann U, Thomas G, Hagl S, et al. Overestimation of aortic valve replacement risk by EuroSCORE: implications for percutaneous valve replacement. Eur Heart J. 2009 Jan;30(1):74–80. doi: 10.1093/eurheartj/ehn523. [DOI] [PubMed] [Google Scholar]
- 31.Cheung A, Soon J-L. Transcatheter aortic valve replacement: where will we be in 5 years? Curr Opin Cardiol. 2011 Mar;26(2):106–12. doi: 10.1097/HCO.0b013e32834398ba. [DOI] [PubMed] [Google Scholar]
- 32.Webb JG, Pasupati S, Achtem L, Thompson CR. Rapid pacing to facilitate transcatheter prosthetic heart valve implantation. Catheter Cardiovasc Interv. 2006 Aug;68(2):199–204. doi: 10.1002/ccd.20829. [DOI] [PubMed] [Google Scholar]
- 33.Fassl J, Augoustides JGT. Transcatheter aortic valve implantation—part 2: Anesthesia management. J Cardiothorac Vasc Anesth. 2010 Aug;24(4):691–9. doi: 10.1053/j.jvca.2010.02.015. [DOI] [PubMed] [Google Scholar]
- 34.Review Manager (RevMan) Computer Program, Version 5.1 Copenhagen (DK) The Nordic Cochrane Centre, Cochrane Collaboration. 2011.
- 35.Atkins D, Best D, Briss PA, Eccles M, Falck-Ytter Y, Flottorp S, et al. Grading quality of evidence and strength of recommendations. BMJ. 2004 Jun 19;328(7454) doi: 10.1136/bmj.328.7454.1490. [DOI] [PMC free article] [PubMed] [Google Scholar]
- 36.Sehatzadeh S, Kaulback K. Transcatheter aortic valve implantation (TAVI) for treatment of aortic valve stenosis—part A [Internet] Toronto: Queen’s Printer for Ontario. 2009. [[cited: 2012 Apr 23]]. 39 pp. Available from: http://hqontario.ca/taviparta2009 .
- 37.Smith CR, Leon MB, Mack MJ, Miller DC, Moses JW, Svensson LG, et al. Transcatheter versus surgical aortic-valve replacement in high-risk patients. N Engl J Med. 2011 Jun 9;364(23):2187–98. doi: 10.1056/NEJMoa1103510. [DOI] [PubMed] [Google Scholar]
- 38.Leon MB, Smith CR, Mack M, Miller DC, Moses JW, Svensson LG, et al. Transcatheter aortic-valve implantation for aortic stenosis in patients who cannot undergo surgery. N Engl J Med. 2010 Oct 21;363(17):1597–607. doi: 10.1056/NEJMoa1008232. [DOI] [PubMed] [Google Scholar]
- 39.Goodman C. Literature searching and evidence interpretation for assessing health care practices. Stockholm, Sweden: Swedish Council on Technology Assessment in Health Care. 1996. 81 pp. SBU Report No. 119E. [DOI] [PubMed]
- 40.Ontario Case Costing Initiative [Internet] Toronto: Ontario Case Costing Initiative. [[updated 2011 Jun; cited 2011 May]]. Available from: http://www.occp.com/
- 41.Canadian classification of health interventions — ICD-10-CA/CCI [DVD] Ottawa (ON): Canadian Institute for Health Information. 2006. 1 DVD: colour.
- 42.McGregor M, Esfandiari S. Transcatheter aortic valve implantation (TAVI) at the MUHC: a health technology assessment. Montreal: McGill University Health Centre. 2009. Dec 7, [[cited: 2012 Feb 1]]. 33 pp. Available from: http://www.mcgill.ca/files/tau/TAVI_REPORT.pdf .
- 43.Cavallo A, Cerbo M, Jefferson T, Lo Scalzo A, Migliore A, Ratti M. Transapical transcatheter aortic valve implantation (TA TAVI) Rome: Agenzia nazionale per i servizi sanitari regionali (Agenas) 2009. Apr, [[cited: 2012 Apr 27]]. 12 pp. Available from: http://www.salute.gov.it/imgs/C_17_pagineAree_1394_listaFile_itemName_3_file.pdf .
- 44.Brady ST, Davis CA, Kussmaul WG, Laskey WK, Hirshfeld JW Jr, Herrmann HC. Percutaneous aortic balloon valvuloplasty in octogenarians: morbidity and mortality. Ann Intern Med. 1989;110(10):761–6. doi: 10.7326/0003-4819-110-10-761. [DOI] [PubMed] [Google Scholar]
- 45.Ontario drug benefit formulary [Internet] Toronto: Ministry of Health and Long-Term Care (Ontario) [[updated 2011 Apr 15; cited 2011 May]]. Available from: http://www.health.gov.on.ca/english/providers/program/drugs/odbf_eformulary.html .
- 46.Jamieson WR, Cartier PC, Allard M, Boutin C, Burwash IG, Butany J, et al. Surgical management of valvular heart disease. Can J Cardiol. 2004;20(Suppl E):7E–120E. [PubMed] [Google Scholar]
- 47.Wells PS, Majeed H, Kassem S, Langlois N, Gin B, Clermont J, et al. A regression model to predict warfarin dose from clinical variables and polymorphisms in CYP2C9, CYP4F2, and VKORC1: derivation in a sample with predominantly a history of venous thromboembolism. Thromb Res. 2010;125(6):e259–e264. doi: 10.1016/j.thromres.2009.11.020. [DOI] [PubMed] [Google Scholar]
- 48.Gohler A, Geisler BP, Manne JM, et al. Utility estimates for decision analytic modelling in chronic heart failure — health states based on New York Heart Association classes and number of rehospitalizations. Value Health. 2009 Jan-Feb;12(1):185–7. doi: 10.1111/j.1524-4733.2008.00425.x. [DOI] [PubMed] [Google Scholar]


