Abstract
The effect of carrier gas properties on particle transport in the human lung is investigated numerically in an imaging based airway model. The airway model consists of multi-detector row computed tomography (MDCT)-based upper and intra-thoracic central airways. The large-eddy simulation (LES) technique is adopted for simulation of transitional and turbulent flows. The image-registration-derived boundary condition is employed to match regional ventilation of the whole lung. Four different carrier gases of helium (He), a helium-oxygen mixture (He-O2), air, and a xenon-oxygen mixture (Xe-O2) are considered. A steady inspiratory flow rate of 342 ml/s is imposed at the mouthpiece inlet to mimic aerosol delivery on inspiration, resulting in the Reynolds number at the trachea of Ret ≈ 190, 460, 1300, and 2800 for the respective gases of He, He-O2, air and Xe-O2. Thus, the flow for the He case is laminar, transitional for He-O2, and turbulent for air and Xe-O2. The instantaneous and time-averaged flow fields and the laminar/transitional/turbulent characteristics resulting from the four gases are discussed. With increasing Ret, the high-speed jet formed at the glottal constriction is more dispersed around the peripheral region of the jet and its length becomes shorter. In the laminar flow the distribution of 2.5-µm particles in the central airways depends on the particle release location at the mouthpiece inlet, whereas in the turbulent flow the particles are well mixed before reaching the first bifurcation and their distribution is strongly correlated with regional ventilation.
Keywords: regional particle distribution, helium, helium-oxygen mixture, air, xenon-oxygen mixture, laminar flow, transitional flow, turbulent flow
Introduction
Aerosols have strong relevance to human health because inhalation of environmental or toxic aerosols can cause diseases, whereas inhalation of therapeutic aerosols can treat diseases. For example, Gauderman et al.11 recruited 1759 children in 12 southern California communities and measured their lung functions annually for a period of eight years. They found that regional air quality has chronic, adverse effects on lung development in children as they reach adulthood. In addition to regional air quality, Gauderman et al.12 found that micro-environments in association with freeway also affect lung functions of 3677 children, depending on how close they lived from a freeway of high particulate concentrations. Conversely, for treatment of diseases aerosols can be used to deliver drugs to the lung airways as well as to the bloodstream by depositing aerosols in the alveolar regions10. To maximize therapeutic drug effect, minimize unwanted side effects, and reduce treatment cost, it is important to effectively deliver inhaled drugs to different regions of interest in the lung2,30, e.g. proximal/peripheral region (serial targeting2), left/right lung, and upper/middle/lower lobe (parallel targeting2). Therefore, understanding the mechanisms of regional deposition is crucial.
Computational fluid dynamics (CFD) models have risen in popularity as a tool for studying particle deposition in the lungs because they can be used to track individual particle motion and quantify particle deposition in a region of interest7,18,19,20,23,27. Since the flow field governs particle transport, an accurate prediction of particle deposition depends on an accurate realization of flow field, which in turn depends on CFD airway model geometries, fluid solvers, and boundary conditions. Thus, use of a realistic airway geometry21,23,35 is desirable. Even if the Reynolds number (Re, based on the bulk velocity) of the air flow in the lungs is lower than the critical Re of ~2300 in a straight smooth pipe flow, the flow can become turbulent due to the glottal constriction that induces a turbulent laryngeal jet21. Thus, unsteady eddy-resolving CFD models, e.g., LES, are necessary to accurately predict the flow field. Currently, since the whole lung geometry is not available for CFD simulations, proper boundary conditions are needed to produce physiologically-consistent regional ventilation at the whole lung level37.
The airway geometry, flow rate, particle properties, and gas properties are the other important factors that determine particle transport in the human lung. A number of experimental and numerical studies have been conducted to study the effect of particle size on particle transport, a review of which can be found in Lippmann et al.22 In contrast, the effect of gas physical properties on particle transport in the human lung is not sufficiently understood. Most previous studies have focused on a helium-oxygen mixture (heliox), as reviewed by Corcoran and Gamard5. Experimental studies showed that heliox lowers the airway resistance as compared with air, thus improves the ventilation for a given pressure drop, and that the alveolar particle deposition increases with decreasing airway resistance5. The oral depositions for different airway geometries, flow rates, and particle sizes were measured in the experiment by Grgic et al.14, and the results showed the correlation between the oral deposition, Stokes number (Stk), and Re. Although experimental studies have provided an overall picture of particle deposition, regional (lung) particle distribution has not been comprehensively studied.
The particle distribution for laminar flows in a model of the bronchial tree extending from the trachea to the segmental bronchi was simulated to find the relationship between ventilation and particle distribution7. The particle transport for laminar to turbulent flows in the oral cavity and trachea was investigated numerically using a Reynolds-Averaged Navier-Stokes (RANS) model19, which showed the critical Re is higher than 1200 (critical flow rate of more than 15 l/min) in the trachea. The particle deposition for heliox in an oral extra-thoracic airway model was simulated using a RANS model27, and the correlation of the oral deposition with not only Stk but also Re was confirmed. Nonetheless, the literature is currently lacking accurate CFD numerical studies on particle transport in the extra- and intra-thoracic airways over a wide spectrum of Re (ranging from 190 to 2800) that arises due to variation in gas properties.
In this paper, the effect of gas properties on regional particle distribution is investigated numerically. The airway model consists of MDCT-based upper and intra-thoracic central airways. The LES technique and an image-registration-derived boundary condition are adopted to capture turbulent and transitional flow characteristics at a local level, and to match subject-specific regional ventilation at the whole lung level, respectively. The particle transport is then simulated using the Lagrangian tracking algorithm with unsteady turbulent flow fields.
Methods
Study cases
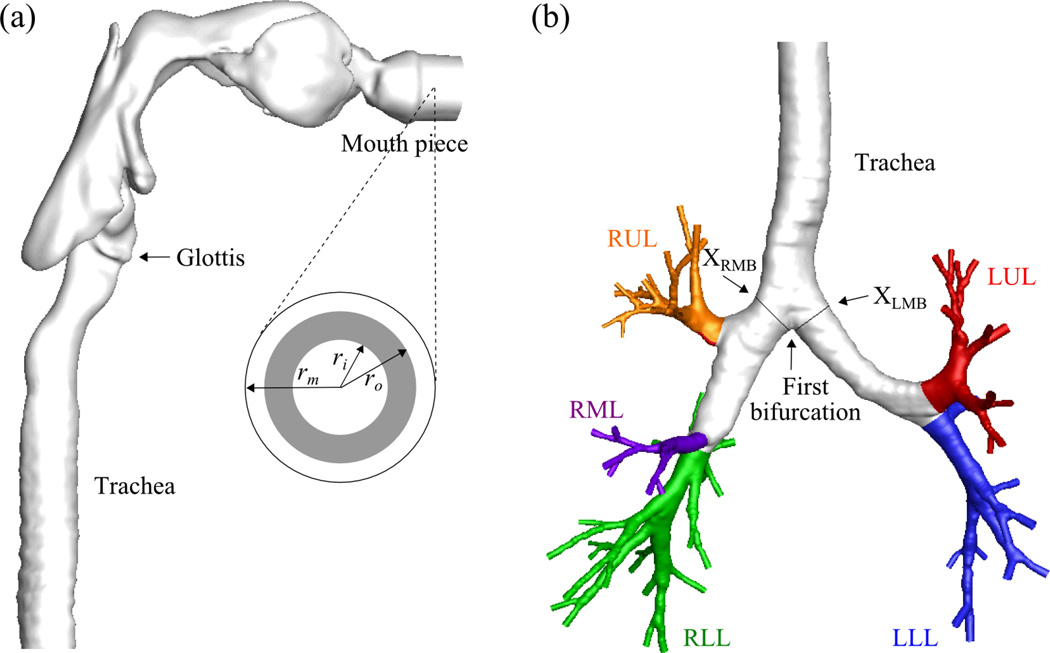
Fig. 1 exhibits the realistic geometric model of the human airway reconstructed from MDCT images4,20,37. The average airway diameters Daw of the trachea, the left main bronchus (LMB), and the right main bronchus (RMB) are 18.8, 11.9, and 16.1 mm, respectively. Fine, medium, and coarse meshes of 15-, 8-, and 4-million tetrahedral elements were generated for a grid sensitivity analysis. The image registration-derived boundary condition37 was imposed at the end faces of the terminal airways to produce subject-specific regional ventilation. This method uses two MDCT volumetric lung image datasets from a single human subject, scanned at two different lung volumes, to derive physiologically realistic flow rates at the end of each terminal bronchiole in the human airway model (Fig.1). The CT intensities of the lung images can be used to calculate regional air volume distributions at the two lung volumes. By image registration, the mapping between the two images can be obtained to derive the regional air volume change (ventilation) of the subject. The entire conducting airway tree of the subject can also be constructed using the volume filling technique31. By overlapping the regional ventilation with the whole airway tree, the change of air content associated with individual terminal bronchioles can be calculated. Then by connectivity of the tree structure, the flow rates for the MDCT-resolved terminal airway segments can be determined. Details of the methodology are given in Yin et al. 37.
FIGURE 1.
The airway model geometry and the definition of the terms used in this paper: (a) upper airways viewed from right and the region of particle release viewed from front, (b) lower airways viewed from front.
* rm=radius of the mouthpiece, ri,o=inner and outer radii to define the region of particle release, DST=downstream end of trachea, LMB=left main bronchus, RMB, right main bronchus, LUL=left upper lobe, LLL=left lower lobe, RUL=right upper lobe, RML = right middle lobe, RLL=right lower lobe.
To investigate the effect of Re on regional particle distribution, four different carrier gases were considered: helium (He), a helium-oxygen mixture (He-O2), air, and a xenon-oxygen mixture (Xe-O2). A steady inspiratory flow rate of 342 ml/s was imposed at the mouthpiece inlet for a time period of 2.16 sec. The tracheal Re (Ret, defined below) for He, He-O2, air, and Xe-O2 in this subject at this flow rate are 190, 460, 1300, and 2800, respectively. The airway model and the flow condition for the air case are the same with those by Lambert et al.20 and Yin et al.37 The properties of these gases are summarized in Table 1. It is noteworthy that a heavier gas under the same inlet flow condition yields a higher Re. The left-right lung (LR) ventilation ratio for this subject is 0.98, which is derived from CT images via the image-registration-derived flow boundary condition37. In order to investigate the effect of LR ventilation ratios on particle transport, the LR ventilation ratio in the He case is artificially reduced to 0.67 (2/3). This special case is referred to as ‘He23’. A total of five cases were investigated: He, He23, He-O2, air, and Xe-O2.
Table 1.
Fluid properties of (a) He, (b) He-O2 mixture, (c) air, and (d) Xe-O2 mixture.
| Fluid | ρf (kg/m3) | μ (kg/s·m) | ν (m2/s) | Ret | λ × 106 (m) |
|---|---|---|---|---|---|
| He | 0.166 | 1.97 × 10⁻⁵ | 11.9 × 10⁻⁵ | 190 | 0.15 |
| He-O2 | 0.400 | 1.98 × 10⁻⁵ | 4.95 × 10⁻⁵ | 460 | 0.13 |
| Air | 1.200 | 2.04 × 10⁻⁵ | 1.70 × 10⁻⁵ | 1300 | 0.067 |
| Xe-O2 | 2.597 | 2.09 × 10⁻⁵ | 0.810 × 10⁻⁵ | 2800 | 0.064 |
He-O2 = 80%He-20%O2, Xe-O2 = 40%Xe-60%O2, ρf = fluid density, ν = kinematic viscosity, Ret = trachea Reynolds number based on the trachea hydraulic diameter of 18.3 mm, λ = mean free path.
Ret is presented with two significant digits.
The aerodynamic diameter (daer, defined below) is the only particle property that affects the trajectory of a spherical particle with diameter d, when particle Re (denoted by Rep) << 1 and d >> λ, where λ is the mean free path of molecules in the gas10.
| (1) |
where sg is the specific gravity defined as the ratio of the particle density (ρp) over the water density. To study aerosol distribution, we chose d=2.5 µm and ρp=1000 kg/m3, yielding daer=2.5 µm for the following two reasons. First, the particles with daer between 1 and 5 µm were reported to achieve the most effective deposition in the human lung15,26,29. Furthermore, the main deposition mechanism for particles of daer > 1 µm in the tracheobronchial region as shown in Fig. 1 is impaction. Second, the densities of pharmaceutical aerosols are close to that of water. Nonetheless, for model validation, we compared with the existing data of the oral deposition and the LR distributions for a wide range of particle sizes daer = 1.0, 2.5, 5.0, 10, 20, 40, 80, and 160 µm.
10,000 spherical particles were released at the mouthpiece, having a circular cross-section with radius rm. The probability integral transform was used to generate the cylindrical coordinates (r, θ) of the particles released uniformly in the annular region between two radii ri and ro (Fig. 1):
| (2) |
| (3) |
where ξ and ζ are random numbers distributed uniformly between 0 and 1. If the particles are released uniformly over the entire cross-section of the mouthpiece (ri,ro) = (0,rm), Eq. (2) reduces to . To study the effect of particle release location on particle distribution, we divided rm into 10 uniform segments and released particles between two radii ri = (i−1)0.1rm and ro = (i)0.1rm, with i=1–10 at the mouthpiece. The average particle release location in any of these annular regions is denoted by rc, namely rc = 0.5(ri+ro)=(i − 0.5)0.1rm. The uncertainty due to the random number generator is assessed in the He case. Based on 8 different seeds in the random number generator, the uncertainty due to the seed on the LR particle distribution ratio is less than 1.5 %. A particle is considered to be deposited on the airway wall when the distance between the particle center and the nearest wall is smaller than the particle radius.
For model validation, the oral deposition was quantified using the deposition efficiency DE. The oral deposition efficiency DEo is defined as the ratio of the number of particles deposited in the oral cavity to the total number of particles released in the mouthpiece. The local Reynolds number Rel based on the local velocity scale Ul and the length scale Dl is defined as
| (4) |
where subscript l is replaced with o for oral cavity and t for trachea, ρf is the fluid density, µ is the fluid dynamic viscosity, and ν is the fluid kinematic viscosity. Grgic et al.14 used the geometrically equivalent diameter Dmean as Dl and the bulk velocity Umean (based on Dmean) as Ul, where , and V and L are the respective volume and path length of the airway segment.
The time history of the number of particles that passed the cross-sections XLMB and XRMB (Fig. 1) was monitored at a time interval of 0.006 sec. The particle flux is defined as the number of particles passing through the cross-section per unit time. The integration of the particle flux over time, i.e., the area underneath the particle flux curve, gives the cumulative particle number.
The tracheobronchial airway resistance Rtb was used to compare the bulk airway resistance for the four different gases. The Rtb is defined as the ratio of the tracheobronchial pressure drop Δptb to the flow rate at the mouthpiece Qm. The Δptb is defined as the difference between the pressure at the mouthpiece pm and the average of the pressures at all the terminal airways ptrm,i in the CT-based airway model.
| (5) |
where Ntrm is the number of the terminal airways.
Computational method
The gas flow was simulated using an in-house LES code. The governing equations for the flow of incompressible fluids consist of the filtered continuity and momentum equations.
| (6) |
| (7) |
using the summation convention for repeated indices, where ui is the velocity components in xi-direction, p is the pressure, νT is the subgrid-scale (SGS) eddy viscosity. The governing equations are integrated using the second-order characteristic Galerkin fractional four-step method. A pressure-Poisson equation is solved to satisfy the continuity equation, Eq. (6). The SGS model by Vreman34 is adopted to compute νT, which is reduced to zero for laminar flow. The time step is determined by the Courant–Friedrichs–Lewy (CFL) condition. This model has been previously validated4,20,21. Further model validation can be found in the validation sub-section.
Lagrangian particle tracking algorithm
Particle trajectories were computed with the Lagrangian tracking algorithm using the simulated flow field. The main mechanism of particle deposition in the tracheobronchial region is impaction, so Brownian motion of the particles is not considered. The governing equation for the particle trajectory is
| (8) |
where νpi is the particle velocity, fDi is the drag force per unit mass, and gi is the gravitational acceleration. Since ρp is typically 1000 times greater than ρf, the coefficient for the second term is close to unity. The drag force per unit mass fDi can be computed as
| (9) |
where νfi is the fluid velocity interpolated from the fluid velocity field ui at the particle location and Ul and Dl are the respective local velocity and length scales as defined in Eq. (4). The Stokes number Stk can be expressed generally as
| (10) |
where νrel is the magnitude of the particle velocity relative to the fluid velocity, CD is the drag coefficient, Cc is the Cunningham slip correction factor16, and α is the particle-particle interaction factor10, which was set to 1 in this study due to the negligible particle volume per unit gas volume of 1.30×10⁻⁷ for 2.5 µm-particles. Particles with small Stk (<< 1) follow streamlines, while particles with large Stk (~ 1) do not follow rapid changes in curved streamlines. CD is generally a function of particle Reynolds number Rep25, which is defined as
| (11) |
When Rep<< 1,
| (12) |
| (13) |
For the four gases considered, a higher Stk implies a larger d.
Grid and flow time interval sensitivity
The particle depositions are sensitive to the velocity field near the wall, thus to the grid size. Therefore, the sensitivities of the regional ventilation and the oral deposition to the grid size were investigated with three different computational meshes. The average element sizes of the medium and the fine meshes are 82% and 66% of the element size in the coarse mesh. The oral deposition efficiencies DEo of 2.5 µm-particles in air for the coarse, medium, and fine meshes are 6.5%, 4.2%, and 3.4%, respectively. The absolute differences in the oral deposition between the coarse and medium meshes and between the fine and the medium meshes are 2.3% and 0.8%, both of which are less than the uncertainty (3.4%) between our data and the empirical results of Grgic et al.14. In addition, the absolute differences in the DEo of 2.5 µm-particles between Xe-O2 and air and between air and He for the fine mesh are 1.4% and 2.0%, respectively. Therefore, the fine and medium meshes are sufficient to predict the oral depositions for different gases. The fine-mesh result is used in the following analysis.
For turbulent flow, the velocity field is unsteady, and the instantaneous velocity field, not the time-averaged velocity field, determines particle motion. Particle trajectories are computed by post-processing a time sequence of instantaneous flow fields. The effect of the time interval between two subsequent flow fields on the LR particle distribution was investigated for optimal data storage and computational time. We used the average integral time scale of turbulence 12 (~0.003 sec) in the region between the pharynx to the main bronchi as a reference time scale. The result showed that for 2.5 µm-particles computed in air using time intervals of 0.003 and 0.006 sec, the difference between the LR particle distribution ratios is 0.01, which is smaller than the standard deviation of the LR particle distribution ratio. Therefore, the flow time interval of 0.006 sec was used in the following analysis.
Because of the transient nature of turbulent flow, the particles need to be released multiple times to obtain time-averaged quantities, so the effect of the number of particle releases on average LR particle distribution was also studied. The time interval between consecutive particle releases was set to 0.048 sec, which is much longer than the integral time scale of turbulence. The study showed that when the particles are released more than 8 times, the relative variation of the average LR particle distribution ratio is less than ± 1%. As described below in detail, only for the case of He-O2, the flow became transitional with low-frequency oscillation, so the particles are released for 7 oscillatory periods with 8 particle releases per period. The mean and the standard deviation of the quantities obtained from multiple releases of particles are reported below.
Validation
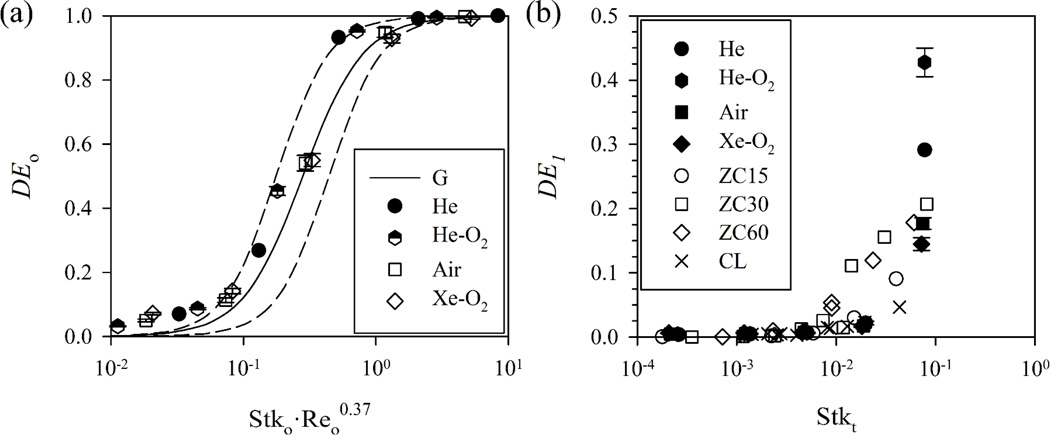
The particle deposition efficiencies in the oral cavity and at the main bronchi are compared with previously published experimental results for validation. Additional validation is shown in Lambert et al.20 The oral deposition efficiency DEo from the current simulation is compared with the DEo from the similarity equation proposed by Grgic et al.14 based on their experimental results:
| (14) |
where Stko and Reo in Fig. 2 are calculated based on Grgic et al.14 and the subscript o means “oral”. In contrast to Lambert et al.20, which assumed constant Reo and different sizes of particles, the Reo here differs due to differing gas properties and particle sizes.
FIGURE 2.
The oral deposition efficiency compared with the similarity equation obtained experimentally by Grgic et al. (G)14 with the dashed lines that envelop the experimental data. (b) The first generation deposition efficiency compared with the experimental results by Chan and Lippmann (CL)3 and Zhou and Cheng (ZC)38.
* The parameters (b,c) in Eq. (14) are (45, 2.2) and (6.0, 2.2) for the upper and the lower dashed lines, respectively. ‘ZC15’ denotes the case of 15 ml/s in Zhou and Cheng38.
The current results agree reasonably well with Eq. (14). Sandeau et al.27 used a different set of model parameters (a, b, c) = (0.30, 150, 2) in Eq. (14), but the current results agree better with Grgic et al.14. The current simulation slightly overestimates DEo for a lower value of Stk·Reo0.37. The difference may be attributed to the uncertainties in inter-subject variability, simulation, or experiment. We further compare the predicted deposition efficiencies at the first airway generation DE1 with the experimental measurements by Chan and Lippmann3, and Zhou and Cheng38. Fig. 2(b) shows that they are in good agreement.
Results
Flow field
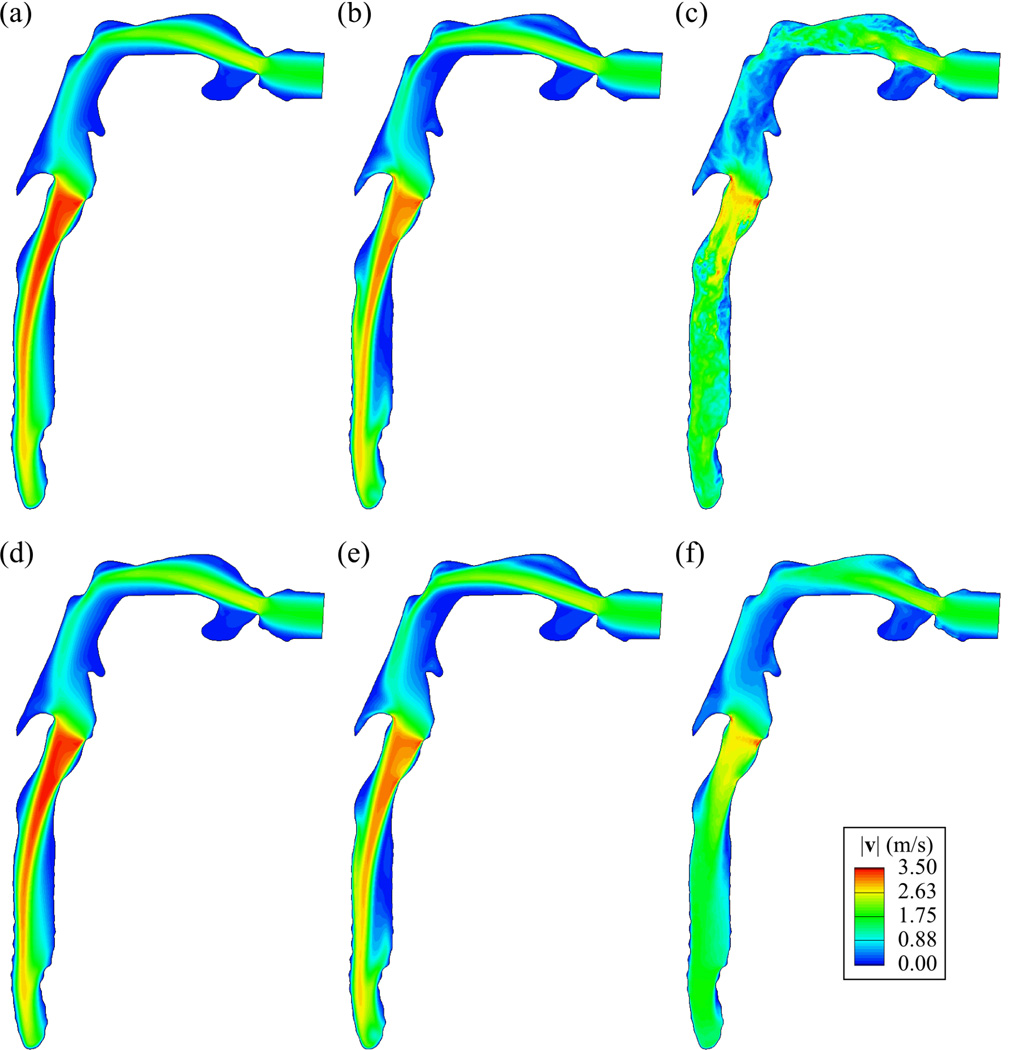
The predominant flow structures in the oral cavity and the trachea are the free-shear jets created by the constrictions at the mouth and at the glottis. Figs. 3 (a)–(c) show that the spatial scale of the jet structure becomes smaller as the flow is more turbulent with increasing tracheal Ret (or gas density). Figs. 3 (d)–(f) show that, around the peripheral region of the jet, the flow is more dispersed and the length of the jet becomes shorter as Ret increases. The length of the laryngeal jet is defined as the length of the region where the velocity magnitude is larger than the bulk velocity at the glottis. The laryngeal jet lengths are 7.91Dt, 7.87Dt, 2.74Dt, and 1.74Dt for Ret ~ 190, 460, 1300, and 2800, respectively, where Dt is the average tracheal diameter. The comparison between Figs. 3 (a)–(c) and (d)–(f) clearly shows the transient feature of turbulent flow for the case of Xe-O2. The values of the tracheobronchial airway resistance Rtb based on the time-averaged flow fields of He, He-O2, air, and Xe-O2 are 0.170, 0.233, 0.421, and 0.732 cmH2O/(l/s), respectively, and the Rtb increases almost linearly with increasing Ret.
FIGURE 3.
The instantaneous (at 2.16 sec), (a)–(c), and time-averaged, (d)–(f), velocity magnitude (VM)|v|(m/s) distributions in a vertical plane cutting through the center of trachea looking from right: Ret = (a) (d) 190 (He), (b) (e) 460 (He-O2), (c) (f) 2800 (Xe-O2).
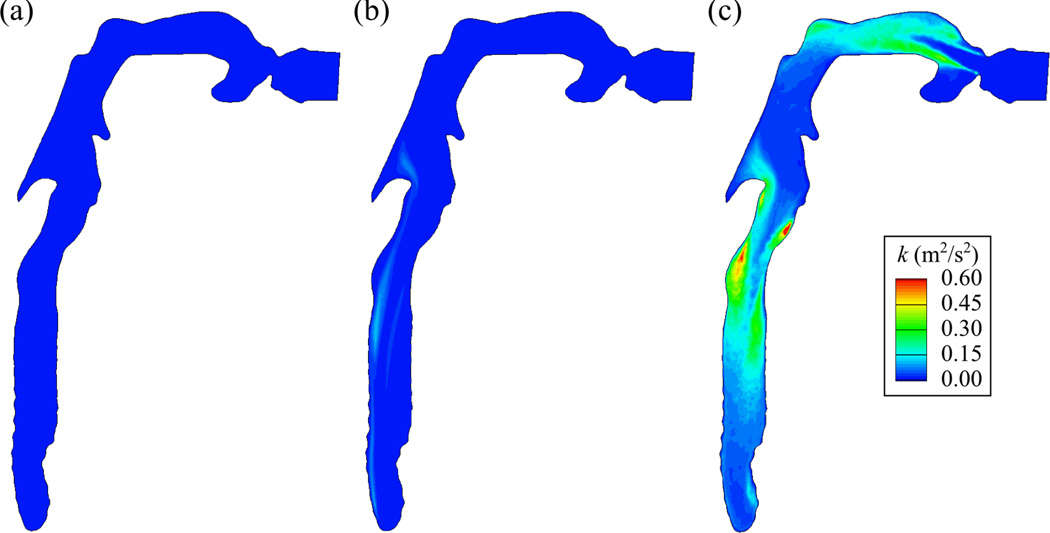
Fig. 4 shows that for the He case the turbulent kinetic energy (TKE) is negligible compared to that of Xe-O2, and that the TKE normalized by the bulk velocity is less than 10−8 in the trachea. Therefore, the flow in the He case is laminar, which can also be confirmed by comparison of Figs. 3 (a) and (d). For the cases of air (not shown) and Xe-O2, the TKE is greatly amplified due to increased turbulent motions. The high TKE is mainly found in two regions: (i) the shear layer between the free stream and the open-cavity-like geometry near the top of the trachea, and (ii) the shear layer surrounding the jets in the oral cavity and the trachea.
FIGURE 4.
The turbulent kinetic energy (TKE) k (m2/s2) distributions in a vertical plane cutting through the center of trachea looking from right: Ret = (a) 190 (He), (b) 460 (He-O2), (c) 2800 (Xe-O2).
Only for the case of He-O2, the jets in the oral cavity and the trachea exhibit low-frequency oscillation due to the transitional nature of the flow. As a result of a spectral analysis, the period of this low-frequency oscillation was 0.36 sec both in the oral cavity and the trachea. The instantaneous velocity field quantitatively resembles the time-averaged velocity field (Figs. 3(b)–(e)), while the TKE is not negligible compared to Xe-O2 (Figs. 4(b)–(c)):TKEmax,He-O2 ≈ TKEmax,Xe-O2 /6. From the simulation results with He/O2 = 90/10 and Ret=390, the flow remains laminar. Therefore, the flow becomes transitional as Ret increases from 390 to 460. The critical Ret for transition between laminar and turbulent flows is approximately taken as 430.
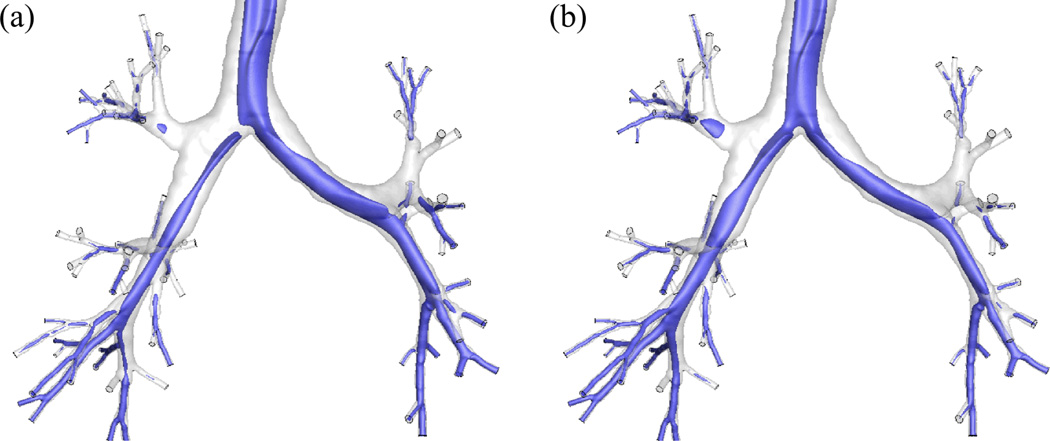
The ratio of the cross-sectional areas XLMB/XRMB is 0.72, so the bulk gas speed is higher in XLMB with the given LR ventilation ratio of 0.98, resulting in a much larger high-speed region near the inner wall of the LMB than in the RMB (Fig. 5 (a)). In the He23 case, the LR ventilation ratio is 0.67, resulting in comparable bulk gas speeds in both LMB and RMB. As a result, the high-speed region in the RMB is nearly as large as that in the LMB (Fig. 5 (b)). Since the only difference between the cases of He and He23 is the LR ventilation ratio, the flow fields in both cases are nearly identical before reaching the first bifurcation.
FIGURE 5.
The iso-surfaces of the velocity magnitude at 1.75 m/s in the lower airways with the LR ventilation ratio of (a) 0.98 (He) and (b) 0.67 (He23).
Regional particle distribution
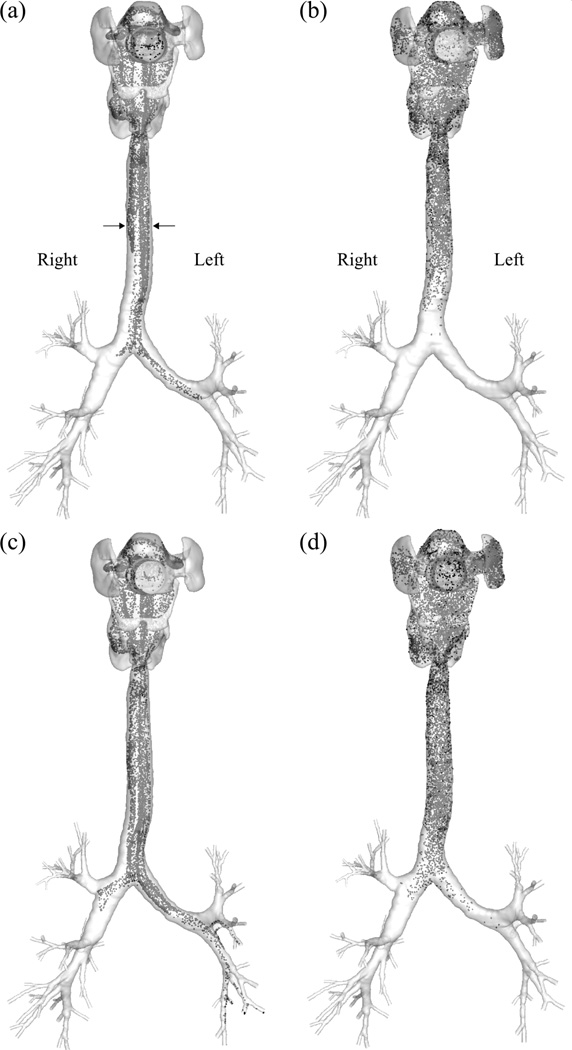
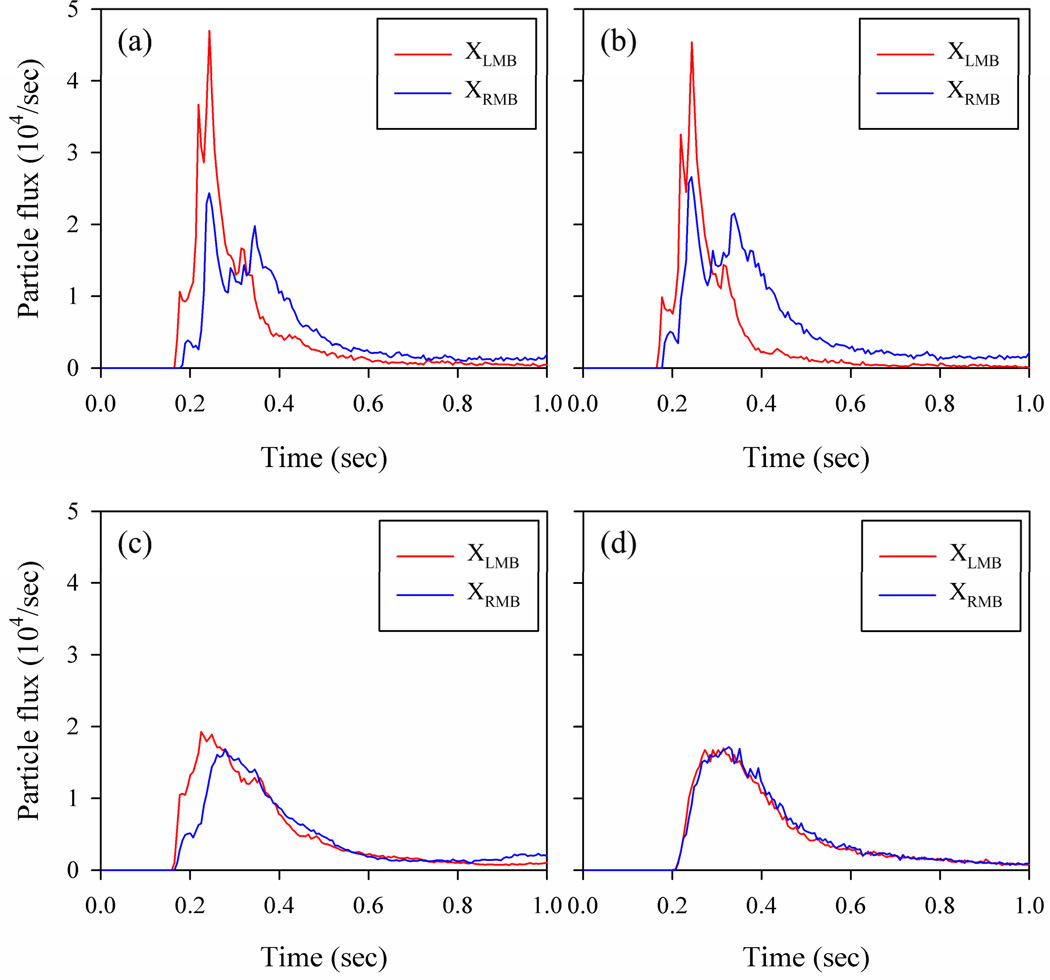
Fig. 6 shows that the particles are less dispersed in the He-gas laminar flow. In contrast, in the Xe-O2-gas turbulent flow, the particles are already well mixed in the oral cavity and distributed uniformly when entering the trachea. In addition, the particles in the turbulent flow are transported more slowly along the axial direction of the airway than in the laminar flow. Fig. 7 shows that more particles are advected first to the LMB and then to the RMB in the laminar flow (He), whereas nearly equal numbers of particles enter the LMB and RMB at the same time in the turbulent flow (Xe-O2). In the steady laminar flow, there are two local peaks in the time history of particle flux to the RMB due to the complex flow field in the oral cavity, which is specific to this subject. It is noteworthy that the summation of the areas underneath the two curves in the laminar flow is the same as for the turbulent flow, because of using the same number of particles for both cases.
FIGURE 6.
The instantaneous distributions of 2.5µm-particles in (a) He and (b) Xe-O2 at 0.195 sec and (c) He and (d) Xe-O2 at 0.228 sec after the release of the particles at the mouth, viewed from the front.
* The particles are released uniformly over the cross-section of the mouthpiece (ri = 0, ro= R).
FIGURE 7.
The time history of particle flux of 2.5µm-particlesat XLMB and XRMB in (a) He, (b) He23, (c) He-O2, and (d) Xe-O2. The particles are released uniformly over the cross-section of the mouthpiece (ri = 0, ro = R).
The peaks for both XLMBand XRMB at around 0.25 sec in Fig. 7 (a) correspond to the cloud particles located on both sides of the upper trachea indicated by the two arrows in Fig. 6 (a). The particles are already split into the two groups before entering the trachea due to the deflection of the flow against the wall in the oral cavity. For the case of He23 shown in Fig. 7(b), the particles are delivered to the LMB and RMB in a similar manner as for He, but the difference between the particle fluxes to the respective LMB and RMB is smaller than that of the He case due to the lower LR ventilation ratio for the case of He23 (Fig. 7 (b)). In the particle flux profile for He-O2 (Fig. 7 (c)) there is no sharp peak as observed in He and He23, but the profile for XLMB is different from XRMB, suggesting that particles in He-O2 are not as well mixed as those in Xe-O2. The particle flux profiles for air (not shown) and Xe-O2 (Fig. 7(d)) are similar to each other.
When the particles are released uniformly over the cross-section of the mouthpiece, the LR particle distribution ratios for the cases of He, He23, He-O2, air, and Xe-O2 are 0.99, 0.67, 1.01 ± 0.046, 1.00 ± 0.047, and 0.98 ± 0.046, respectively. The latter three cases include the standard deviations based on the results of multiple particle releases to account for the transition (He-O2) and turbulence (air and Xe-O2) effects. For the LR ventilation ratio of 0.98, the difference between the mean particle ratios in the laminar (He), transitional (He-O2), and turbulent (air and Xe-O2) flows is not statistically significant, and the particles entering the LMB and RMB are about the same. The uncertainty due to the transition and turbulence effects is less than 5% in He-O2, air, and Xe-O2. For the case of He23 with the LR ventilation ratio of 0.67, the particle distribution ratio nearly equals the corresponding ventilation ratio as in the He case.
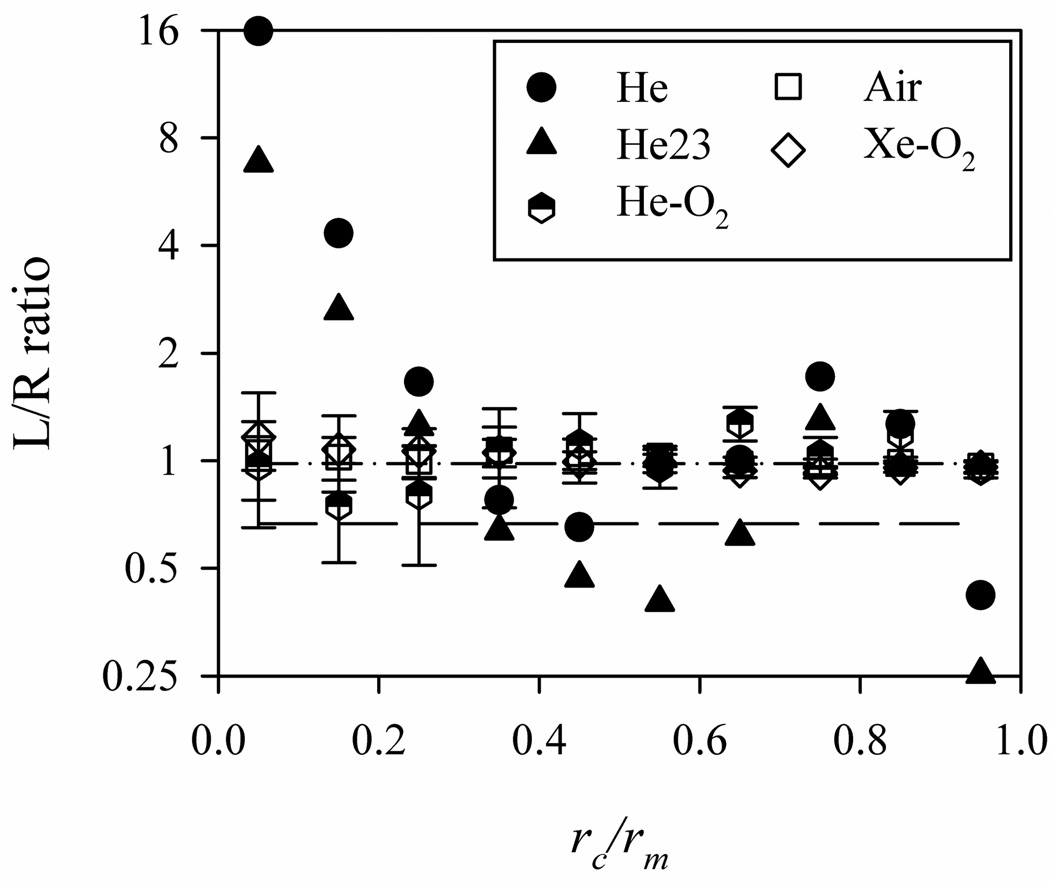
When the particles are released only in the annular region between two radii ri and ro, the LR particle distribution ratio deviates from the corresponding ventilation ratio in the laminar (He) and transitional flows (He-O2), whereas the LR particle ratio is nearly equal to the ventilation ratio in the turbulent flows (Xe-O2 and air) as shown in Fig. 8. In the laminar flow, the distribution of the particle ratio is not monotonic, varying significantly between around 16 and 0.4. In the transitional flow, the deviation of the particle distribution ratio from the ventilation ratio is much smaller than that in the laminar flow, and the uncertainty is larger than that in the turbulent flow due to the low-frequency oscillation of the jets. In the turbulent flow, the uncertainty is greater when the particles are released near the center of the mouthpiece, perhaps due to their physical correlation with the turbulent jets in the core region of the airways. The shape of the distribution of the particle ratio for He23 is similar to that for He, but the average ratio for He23 is smaller than that for He due to the smaller ventilation ratio.
FIGURE 8.
The LR particle distribution ratios as a function of the location of the particles at the mouthpiece rc non-dimensionalized with the radius of the mouthpiece rm.
* The dash-dot and dash lines represents LR ventilation ratios of 0.98 (He, He-O2, air, Xe-O2) and 0.67 (He23), respectively.
If particles are released randomly over the radius20 as expressed below
| (15) |
Then more particles are clustered near the center of the mouthpiece. This distribution differs from the uniform distribution given by Eq. (2). With the particle distribution given by Eq. (15), for the case of turbulent flow the LR particle distribution ratio still nearly equals the ventilation ratio, suggesting that the initial particle distribution does not affect the LR particle distribution. On the other hand, for the laminar flow the LR particle distribution ratio is 1.3, indicating that 30% more particles are advected to the LMB. This is consistent with the results described above. That is, for the case of laminar flow with a parabolic particle distribution at the mouthpiece, particles clustered near the center of the mouthpiece are more likely to be advected to the LMB as shown in Fig. 8.
Discussion
The objective of this study is to study the effect of carrier gas properties on aerosol transport and distribution for effective drug delivery in the human lung. Previous experimental and numerical studies have focused on the oral deposition, so the interest of this study is in the distribution of small (2.5µm) particles in the intra-thoracic airways.
Effect of gas properties
Different gas properties result in different Ret. If Ret is lower than ~430, the flow is laminar, and small particles generally follow the steady streamlines of the flow (i.e. flow structures), which depend on airway geometry and regional ventilation. Thus, the release location of a particle at the mouthpiece determines its transport along the streamline that begins at the release location. Particles advected along different streamlines may experience different degrees of acceleration and deceleration. For example, in the He-gas laminar cases the particles first enter the LMB, and then enter the RMB as illustrated in Fig. 7 (a). Furthermore, if small particles are uniformly distributed at the mouthpiece, the flow ventilation ratio basically determines the LR particle distribution ratio.
For the He-O2 case of transitional flow, the jets in the oral cavity and the trachea exhibit low-frequency oscillation and can mix particles. For the cases of turbulent flow (air and Xe-O2), inhaled small particles are well mixed in the oral cavity and the trachea before entering the main bronchi LMB and RMB (Figs. 7(c)–(d)). Thus, regardless of the particle release location at the mouthpiece, the flow ventilation determines the LR particle distribution (Fig. 8). The major difference between the laminar and turbulent flow cases is that turbulent structures mix particles in the oral cavity and trachea, and subsequently particle distribution does not depend on the release location at the mouthpiece. In contrast, for the case of laminar flow, the mixing of particles is absent, and flow ventilation would roughly match particle distribution only if the particles are uniformly distributed at the mouthpiece.
The critical Ret of ~430 found in this study is lower than the critical Re of ~2,300 for transition to turbulent flow in a straight pipe. It is because the turbulent flow in the trachea is caused by the airway constriction at the glottis, being a free-shear flow rather than a wall-bounded flow. Dekker8 found experimentally that the critical flow rate for transition to turbulent flow in the trachea is 96 ± 26 ml/s with ν = 1.51 × 10⁻⁵ m2/s. Although Dekker8 did not report the trachea diameter nor the critical Ret, with the assumption17 of Dt = 16 mm the critical Ret is estimated to be 506 ± 137, which is close to the current critical Ret. The uncertainty in the critical flow rate is due in part to its dependence on individual airway features (e.g., glottal constriction) and upstream flow disturbances.
Comparison with other CFD studies
Table 2 summarizes some related CFD studies. Except Jayaraju et al.18, all of the listed studies used RANS models only. The other common feature in these studies is that particles were released uniformly at the inlets of their respective airway models. RANS models predict time-averaged mean flow fields and turbulent statistics, e.g., TKE, without resolving any transitional/turbulent flow structures. Therefore, there are two common approaches used for prediction of particle trajectories on a RANS-predicted flow field. One approach uses the mean flow field only, being referred to as “mean flow tracking” (MFT). The other approach, known as “turbulent flow tracking” (TFT), employs an eddy interaction model (EIM)13,18 to introduce random turbulent fluctuations based on RANS-predicted TKE to the mean flow field.
Table 2.
Comparison between the previous studies about particle transport in the human lung using RANS models.
| Airway model |
RANS model |
Particle tracking |
Ventilation B.C. |
Ret | Ret,c | |
|---|---|---|---|---|---|---|
| Ma and Lutchen23 | Oral cavity -bronchioles | k-ε | MFT TFT (G) | Horsfield et al.17 | 1200–4800*2 | < 1200 |
| Kleinstreuer and Zhang19 | Oral cavity -trachea | LRN k-ω | TFT | NA | 1200–4800*2 | 1200–2400 |
| Darquenne et al.7 | Trachea-bronchioles | k-ε | MFT | Horsfield et al.17 | 500–2500*3 | 8000*3 |
| Jayaraju et al.18 | Oral cavity-trachea | LRN k-ω*4 | MFT TFT (G) | NA | 2100 | NA |
| Sandeau et al.27 | Oral cavity-trachea | LRN k-ω | TFT (G) | NA | 280–3100*5 | 400 |
MFT does not allow turbulent mixing of particles. Lagrangian tracking of particles in a RANS-predicted mean flow is numerically equivalent to tracking in a steady laminar flow, where particle trajectories depend on the particle release location. As a result, MFT cannot reproduce the release-location-independence feature of the particles in turbulent flows (Fig. 8). Releasing particles uniformly at the model inlet may help dispersing particles in the absence of turbulent mixing.
TFT utilizes the predicted intensity and distribution of TKE, which depend on the RANS’s limited ability to predict turbulent characteristics, e.g. free-shear flow versus wall-bounded flow and isotropy versus non-isotropy. Accurate prediction of turbulent features is crucial to reproduce preferential particle concentration in turbulent dispersed multiphase flow1. Jayaraju et al.18 showed the accuracy of two unsteady eddy-resolving methods, detached-eddy simulation (DES) and LES, over RANS using both MFT and TFT. Kleinstreuer and Zhang19 simulated the particle transport in laminar to turbulent flows with TFT. Their results showed that the flow is laminar for Ret = 1200 (airflow rate of 15 l/min) with the assumption36 of Dt= 18 mm, and the flow becomes turbulent when Ret is 2400 (30 l/min). The estimated critical Ret (between 1200 and 2400) is more than twice the ones found from the experiments by Dekker8, the numerical simulations by Sandeau et al.27 and the current study. In Kleinstreuer and Zhang19, the maximum TKE in the trachea normalized by the trachea bulk velocity for Ret of 1200 is under-estimated by about three orders of magnitude as compared with Sandeau et al.27 and the current study.
Darquenne et al.7 reported that “ventilation defines the delivery of aerosol to lung segments” when small (0.5-, 1-, and 2-µm) particles are released uniformly at the trachea with air flow rate of 500 ml/s (Ret = 2,500). Their airway model is the only model that begins from the trachea without including the oral cavity and the larynx. Their earlier paper33 reported no significant differences between the results predicted by laminar and RANS models and the critical Ret of 8,000, suggesting the importance of including the upper airway in the model. Although their finding about the particle distribution agrees with the current study, this work further indicates the dependence (independence) of particle distribution on the particle release location in laminar (turbulent) flow.
Ma and Lutchen23 found that the oral deposition predicted by MFT agrees better with Grgic et al.14 than that by TFT. On the contrary, Jayaraju et al.18 showed that TFT predicts more accurate oral deposition compared to MFT. The difference between them may be attributable to the differences in their airway and RANS models. Ma and Lutchen23 used MFT to predict the LR particle deposition ratio of greater than unity, which was also found by Lambert et al.20 using LES with a different airway model and ventilation boundary conditions.
Potential for targeted drug delivery
The relationship between the particle distribution ratio and the particle release location at the mouthpiece in laminar flows could potentially be used for better localized targeting in drug delivery. In practice, the Re can be reduced to stabilize the flow not only by increasing the kinematic viscosity as in the current study, but also by decreasing the flow rate14. With a lower flow rate, the inhalation should last longer to keep the same tidal volume. Ross and Schultz26 suggested that the dry powder inhaler (DPI) requires relatively high flow rate to create ‘respirable’ particles, whereas the metered dose inhaler (MDI) does not. Although some patients, especially children, cannot use MDI correctly6, the MDI is more suitable for the inhalation with low flow rate. Because DPI devices have rapidly been being improved9,28, new technology may enable DPI to generate fine particles with lower flow rate.
According to Martonen24, the tidal volume and frequency of the representative breathing pattern for resting conditions are 500 ml and 14 /min, which correspond to the period of 4.29 sec, resulting in an average flow rate of 233 ml/s. If heliox (80% He-20% O2, ν = 4.95×10⁻⁵ m2/s) is selected as a carrier gas, the Ret is 375 with the assumption of Dt = 16 mm. As stated above, the main objective of this paper is to show the effect of gas properties on aerosol distribution, and He gas is used mainly to show the lower end of the kinematic viscosity range. However, according to the above estimate, the Ret based on the average flow rate of heliox for the resting breathing condition is lower than the critical Ret. Therefore, it is still possible to produce a laminar flow condition, although it can be challenging to generate micro-particles with this flow rate.
Even if the Ret is lower than the critical Ret so that the flow is laminar, the relationship between particle distribution and release location may still depend on Ret due to the complex geometry of the upper airways. Nonetheless, once the relationship for the individual with a given Ret (lower than the critical Ret) is known, the mouthpiece could be modified to optimize drug delivery. For the subject considered here, most of the small particles located near the center of the mouthpiece enter the left lung, so more particles can be delivered to the left (right) lung by releasing the particles near (away from) the center.
The advantage of the flow with Ret higher than the critical Ret is that the particles are delivered to the lung following the ventilation, so detailed information concerning the airway geometry is not needed. The ventilation can be estimated by using the image registration-derived boundary conditions. However, the Ret should not be too high because (i) the tracheobronchial airway resistance increases almost linearly with increasing Ret and (ii) the difference in aerosol delivery by differing carrier gases is small if the flow becomes turbulent.
Acknowledgements
This work was supported in part by NIH grants R01-HL094315, R01-HL064368, R01-EB005823, and S10-RR022421. The authors are grateful to Youbing Yin, Jiwoong Choi, and Haribalan Kumar for generating meshes and CT images of the airway model, assisting with the flow simulation, and assisting with the particle simulation respectively. We also thank the San Diego Supercomputer Center (SDSC), the Texas Advanced Computing Center (TACC), and XSEDE sponsored by the National Science Foundation for the computer time.
References
- 1.Balachandar S, Eaton JK. Turbulent dispersed multiphase flow. Annu. Rev. Fluid Mech. 2010;42:111–133. [Google Scholar]
- 2.Bennett WD. Targeting respiratory drug delivery with aerosol boluses. Journal of aerosol medicine. 1991;4:69–78. [Google Scholar]
- 3.Chan TL, Lippmann M. Experimental measurements and empirical modelling of the regional deposition of inhaled particles in humans. Am. Ind. Hyg. Assoc. J. 1980;41:399–409. doi: 10.1080/15298668091424942. [DOI] [PubMed] [Google Scholar]
- 4.Choi J, Xia G, Tawhai MH, Hoffman EA, Lin CL. Numerical study of high-frequency oscillatory air flow and convective mixing in a CT-based human airway model. Ann. Biomed. Eng. 2010:1–22. doi: 10.1007/s10439-010-0110-7. [DOI] [PMC free article] [PubMed] [Google Scholar]
- 5.Corcoran TE, Gamard S. Development of aerosol drug delivery with helium oxygen gas mixtures. Journal of Aerosol Medicine. 2004;17:299–309. doi: 10.1089/jam.2004.17.299. [DOI] [PubMed] [Google Scholar]
- 6.Crompton GK. Problems patients have using pressurized aerosol inhalers. Eur. J. Respir. Dis. Suppl. 1982;119:101–104. [PubMed] [Google Scholar]
- 7.Darquenne C, van Ertbruggen C, Prisk GK. Convective flow dominates aerosol delivery to the lung segments. J. Appl. Physiol. 2011;111:48. doi: 10.1152/japplphysiol.00796.2010. [DOI] [PMC free article] [PubMed] [Google Scholar]
- 8.Dekker E. Transition between laminar and turbulent flow in human trachea. J. Appl. Physiol. 1961;16:1060. doi: 10.1152/jappl.1961.16.6.1060. [DOI] [PubMed] [Google Scholar]
- 9.Donovan MJ, Gibbons A, Herpin MJ, Marek S, McGill SL, Smyth HDC. Novel dry powder inhaler particle-dispersion systems. Therapeutic Delivery. 2011;2:1295–1311. doi: 10.4155/tde.11.103. [DOI] [PubMed] [Google Scholar]
- 10.Finlay WH. The mechanics of inhaled pharmaceutical aerosols: An introduction. : Academic Pr. 2001 [Google Scholar]
- 11.Gauderman WJ, Avol E, Gilliland F, Vora H, Thomas D, Berhane K, McConnell R, Kuenzli N, Lurmann F, Rappaport E. The effect of air pollution on lung development from 10 to 18 years of age. N. Engl. J. Med. 2004;351:1057–1067. doi: 10.1056/NEJMoa040610. [DOI] [PubMed] [Google Scholar]
- 12.Gauderman WJ, Murcray C, Gilliland F, Conti DV. Testing association between disease and multiple SNPs in a candidate gene. Genet. Epidemiol. 2007;31:383–395. doi: 10.1002/gepi.20219. [DOI] [PubMed] [Google Scholar]
- 13.Gosman AD, Ioannides E. Aspects of computer simulation of liquid-fuelled combustors. J. Energy. 1983;7:482–490. [Google Scholar]
- 14.Grgic B, Finlay WH, Burnell PKP, Heenan AF. In vitro intersubject and intrasubject deposition measurements in realistic mouth-throat geometries. J. Aerosol Sci. 2004;35:1025–1040. [Google Scholar]
- 15.Heyder J, Gebhart J, Rudolf G, Schiller CF, Stahlhofen W. Deposition of particles in the human respiratory tract in the size range 0.005-15 [mu] m. J. Aerosol Sci. 1986;17:811–825. [Google Scholar]
- 16.Hinds WC. Aerosol technology: properties, behavior, measurement of airborne particles. 1982 [Google Scholar]
- 17.Horsfield K, Dart G, Olson DE, Filley GF, Cumming G. Models of the human bronchial tree. J. Appl. Physiol. 1971;31:207. doi: 10.1152/jappl.1971.31.2.207. [DOI] [PubMed] [Google Scholar]
- 18.Jayaraju ST, Brouns M, Lacor C, Belkassem B, Verbanck S. Large eddy and detached eddy simulations of fluid flow and particle deposition in a human mouth-throat. J. Aerosol Sci. 2008;39:862–875. [Google Scholar]
- 19.Kleinstreuer C, Zhang Z. Laminar-to-turbulent fluid-particle flows in a human airway model. Int. J. Multiphase Flow. 2003;29:271–289. [Google Scholar]
- 20.Lambert AR, O’shaughnessy PT, Tawhai MH, Hoffman EA, Lin CL. Regional deposition of particles in an image-based airway model: large-eddy simulation and left-right lung ventilation asymmetry. Aerosol Science and Technology. 2011;45:11–25. doi: 10.1080/02786826.2010.517578. [DOI] [PMC free article] [PubMed] [Google Scholar]
- 21.Lin CL, Tawhai MH, McLennan G, Hoffman EA. Characteristics of the turbulent laryngeal jet and its effect on airflow in the human intra-thoracic airways. Respiratory physiology & neurobiology. 2007;157:295–309. doi: 10.1016/j.resp.2007.02.006. [DOI] [PMC free article] [PubMed] [Google Scholar]
- 22.Lippmann M, Yeates DB, Albert RE. Deposition, retention, clearance of inhaled particles. Br. J. Ind. Med. 1980;37:337. doi: 10.1136/oem.37.4.337. [DOI] [PMC free article] [PubMed] [Google Scholar]
- 23.Ma B, Lutchen KR. CFD simulation of aerosol deposition in an anatomically based human large–medium airway model. Ann. Biomed. Eng. 2009;37:271–285. doi: 10.1007/s10439-008-9620-y. [DOI] [PubMed] [Google Scholar]
- 24.Martonen T. Mathematical model for the selective deposition of inhaled pharmaceuticals. J. Pharm. Sci. 1993;82:1191–1199. doi: 10.1002/jps.2600821202. [DOI] [PubMed] [Google Scholar]
- 25.Morsi SA, Alexander AJ. An investigation of particle trajectories in two-phase flow systems. J. Fluid Mech. 1972;55:193–208. [Google Scholar]
- 26.Ross DL, Schultz RK. Effect of inhalation flow rate on the dosing characteristics of dry powder inhaler (DPI) and metered dose inhaler (MDI) products. Journal of aerosol medicine. 1996;9:215–226. doi: 10.1089/jam.1996.9.215. [DOI] [PubMed] [Google Scholar]
- 27.Sandeau J, Katz I, Fodil R, Louis B, Apiou-Sbirlea G, Caillibotte G, Isabey D. CFD simulation of particle deposition in a reconstructed human oral extrathoracic airway for air and helium-oxygen mixtures. J. Aerosol Sci. 2010;41:281–294. [Google Scholar]
- 28.Son YJ, McConville JT. Advancements in dry powder delivery to the lung. Drug Dev. Ind. Pharm. 2008;34:948–959. doi: 10.1080/03639040802235902. [DOI] [PubMed] [Google Scholar]
- 29.Stahlhofen W, Rudolf G, James AC. Intercomparison of experimental regional aerosol deposition data. Journal of Aerosol Medicine. 1989;2:285–308. [Google Scholar]
- 30.Subramaniam RP, Asgharian B, Freijer JI, Miller FJ, Anjilvel S. Analysis of lobar differences in particle deposition in the human lung. Inhal. Toxicol. 2003;15:1–21. doi: 10.1080/08958370304451. [DOI] [PubMed] [Google Scholar]
- 31.Tawhai MH, Hunter P, Tschirren J, Reinhardt J, McLennan G, Hoffman EA. CT-based geometry analysis and finite element models of the human and ovine bronchial tree. J. Appl. Physiol. 2004;97:2310. doi: 10.1152/japplphysiol.00520.2004. [DOI] [PubMed] [Google Scholar]
- 32.Varghese SS, Frankel SH, Fischer PF. Modeling transition to turbulence in eccentric stenotic flows. J. Biomech. Eng. 2008;130 doi: 10.1115/1.2800832. 014503. [DOI] [PubMed] [Google Scholar]
- 33.van Ertbruggen C, Hirsch C, Paiva M. Anatomically based three-dimensional model of airways to simulate flow and particle transport using computational fluid dynamics. J. Appl. Physiol. 2005;98:970. doi: 10.1152/japplphysiol.00795.2004. [DOI] [PubMed] [Google Scholar]
- 34.Vreman AW. An eddy-viscosity subgrid-scale model for turbulent shear flow: Algebraic theory and applications. Phys. Fluids. 2004;16:3670. [Google Scholar]
- 35.Wall WA, Rabczuk T. Fluid–structure interaction in lower airways of CT–based lung geometries. Int. J. Numer. Methods Fluids. 2008;57:653–675. [Google Scholar]
- 36.Weibel ER. Morphometry of the human lung. Anesthesiology. 1965;26:367. [Google Scholar]
- 37.Yin Y, Choi J, Hoffman EA, Tawhai MH, Lin CL. Simulation of pulmonary air flow with a subject-specific boundary condition. J. Biomech. 2010;43:2159–2163. doi: 10.1016/j.jbiomech.2010.03.048. [DOI] [PMC free article] [PubMed] [Google Scholar]
- 38.Zhou Y, Cheng YS. Particle deposition in a cast of human tracheobronchial airways. Aerosol Science and Technology. 2005;39:492–500. [Google Scholar]


