Abstract
Previous researchers have successfully demonstrated the application of temperature feedback control for thermal treatment of disease using MR thermometry. Using the temperature-dependent proton resonance frequency (PRF) shift, ultrasound heating for hyperthermia to a target organ (such as the prostate) can be tightly controlled. However, using fixed gain controllers, the response of the target to ultrasound heating varies with type, size, location, shape, stage of growth, and proximity to other vulnerable organs. To adjust for clinical variables, feedback self-tuning regulator (STR) and model reference adaptive control (MRAC) methods have been designed and implemented using real-time, online MR thermometry by adjusting the output power to an ultrasound array to quickly reach the hyperthermia target temperatures. The use of fast adaptive controllers in this application is advantageous because adaptive controllers do not require a priori knowledge of the initial tissue properties and blood perfusion and can quickly reach the steady-state target temperature in the presence of dynamic tissue properties (e.g., thermal conductivity, blood perfusion). This research was conducted to rapidly achieve and manage therapeutic temperatures from an ultrasound array using novel MRI-guided adaptive closed-loop controllers both in ex vivo and in vivo experiments. The ex vivo phantom experiments with bovine muscle (n = 5) show that within 6 ± 0.2 minutes, the tissue temperature increased by 8 ± 1.37°C. Using rabbits’ (n = 5) thigh muscle, the in vivo experiments demonstrated the target temperature reached 44.5°C ± 1.2°C in 8.0 ± 0.5 minutes. The preliminary in vivo experiment with canine prostate hyperthermia achieved 43 ± 2°C in 6.5 ± 0.5 minutes. These results demonstrate that the adaptive controllers with MR thermometry are able to effectively track the target temperature with dynamic tissue properties.
Keywords: MR thermometry, adaptive temperature control, closed loop, ultrasound hyperthermia
INTRODUCTION
Recent developments in clinical treatments using thermal effects have expanded the treatment options for certain oncology patients (1). Cancer associated with the prostate gland draws special attention because it is the second leading cause of cancer-related death in men reported by American Cancer Society. By applying heat to the local tissues, hyperthermic cytotoxicity and two different types of interaction, thermal radio-sensitization and thermal chemosensitization, are induced to provide effective local treatment of isolated disease. Local hyperthermia elevating the target tissue temperature to 43–45°C can kill cancer cells either alone or in conjunction with radiotherapy or chemotherapy with minimal damage to the surrounding and intervening normal tissues (2–8).
Magnetic resonance (MR) thermometry has been used in vivo for noninvasive robust monitoring and control of hyperthermia therapies (9–15). MR thermometry using the temperature-dependent proton resonance frequency (PRF) shift has been shown to provide accurate spatial localization, adequate temperature sensitivity, and tissue contrast for precise two-dimensional (2D) temperature measurement as well as tissue identification (16, 17).
Previous research has successfully demonstrated the application of temperature feedback control for hyperthermia treatment of disease using MR thermometry (9, 10, 18–22). However, regulation of the target tissue temperature within a narrow therapeutic range to minimize the damage to normal tissues presents many challenges. Tumors vary in type, size, location, and stage of growth, and have dynamic properties such as blood perfusion. To avoid large overshoots, the controllers with fixed gains required prolonged rise times (9, 18). In applying a physical model of heat conduction, some control methods neglect the effects of blood perfusion and assume the absorption and diffusion of heat to be independent of space and time, which limited the stability and tolerance for spatial deviations (10, 19, 22). With the assumption that tissue parameters are time invariant, other controllers had less ability to track the system variations during the long period of hyperthermia (21). These results motivate the use of an adaptive controller whose gains are automatically adjusted to provide desired steady-state and transient characteristics even among various patients.
The goal of this research was to design and evaluate three adaptive temperature control methods using MR thermometry for thermal feedback in ultrasound hyperthermia. The controllers were required to achieve and maintain a target temperature for a sustained period with minimal overshoots, rapid rising time, and small oscillations. Simulations were used to determine the proper initial parameters for the adaptive controllers. In vivo and ex vivo experiments using MR thermometry demonstrated the performance and effectiveness of the noninvasive robust and adaptive feedback temperature control system.
MATERIALS AND METHODS
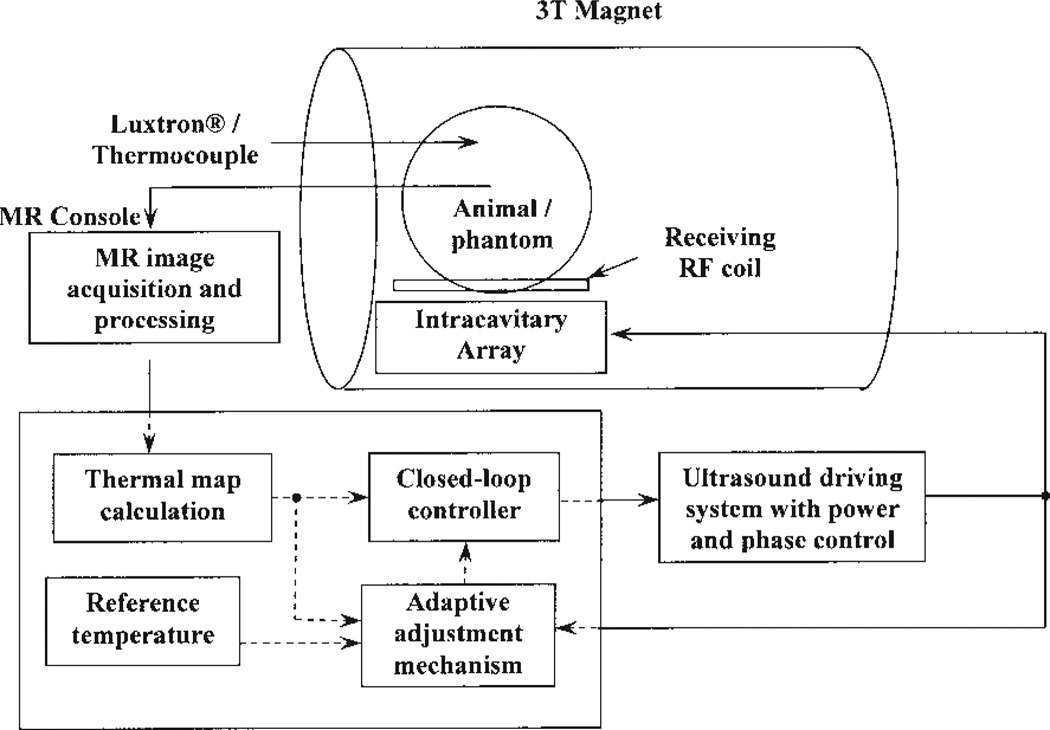
The block diagram shown in Fig. 1 displays the entire system used to conduct the ultrasound hyperthermia control experiments using MR thermometry. In the figure, an intracavitary ultrasound array with 16 elements was designed for transrectal prostate cancer hyperthermia. The electrical driving signal (phase and amplitude) to the array was amplified by a 64-channel programmable ultrasound driving system with a maximum output power of 60 W per channel. The ultrasound array and animal (or phantom) were placed inside a birdcage coil to receive/transmit the radio frequency (RF) signal for MRI measurement. Temperature maps constructed from MRI data using PRF shift were acquired and compared with a desired reference temperature. The adaptive feedback controllers programmed in the PC used this information in adjusting the amount of power applied to produce the desired temperature response. Detailed descriptions of each individual system follow.
Figure 1.
Block diagram of the ultrasound hyperthermia system using MRI thermometry as thermal feedback. The intracavitary ultrasound array is placed inside the MR scanner for hyperthermia treatment together with the animal/phantom. Online thermal feedback is acquired by processing the MR images and transferring to the closed-loop adaptive controller, which determines the proper amount of power outputting from the amplifier to generate optimal temperature rise trajectory in the target tissue.
Adaptive Control Algorithms
System Identification
As a starting point, a dynamic model of the hyperthermia process using batch least-squares system identification was first obtained (23). To identify the hyperthermia system, the electrical power to the ultrasound transducer and the measured tissue temperatures were taken as the input and output of the system, respectively. With reasonable assumption that the system satisfied an auto regressive moving average (ARMA) model, the system was expressed in the following difference equation:
| [1] |
where y(k) is the tissue temperature at time k, u(k) is the electrical power applied to the transducer, n and m are unknown integers representing the number of poles and zeros, respectively, α1, α2,…αn, and β1, β2,… βm are unknown real-valued coefficients of the system. Equation [1] has the compact form
| [2] |
where A and B are polynomials in the forward shift operator q, e.g., qnu(k) = u(k + n).
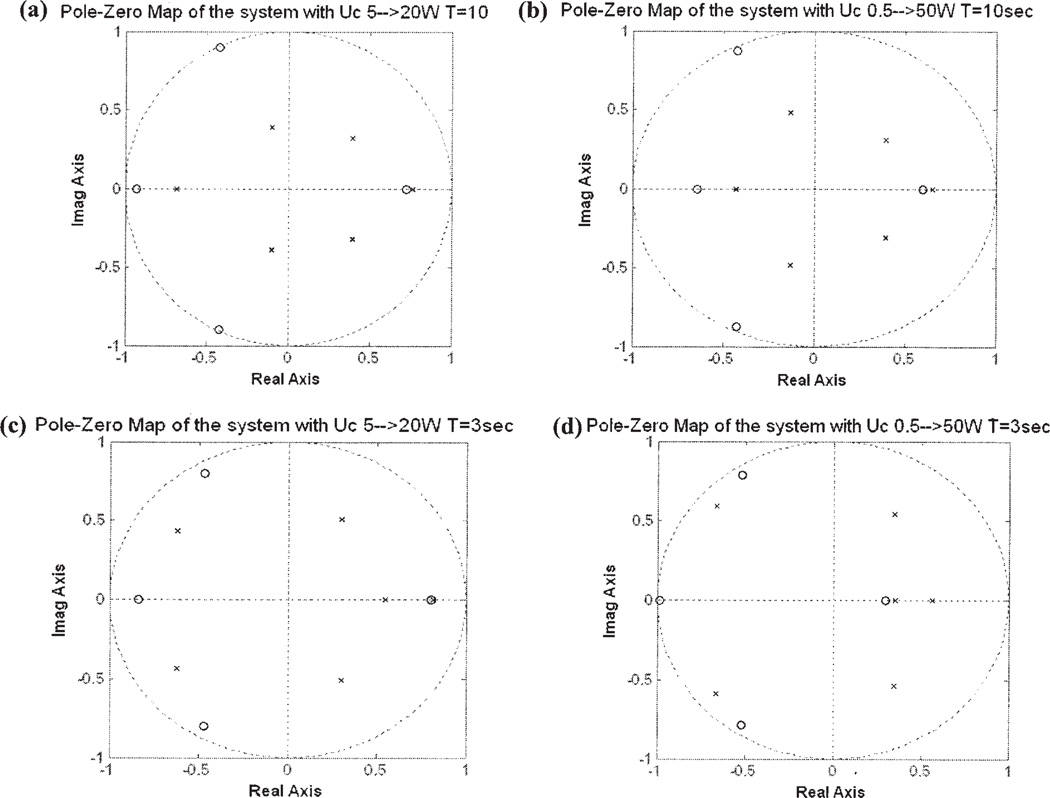
The unknown parameters in Eq. [2] are estimated from experimental data using batch least-squares identification. Pole-zero maps are used to show the effect of experimental excitations on the estimated model. The poles of a system are the roots to equation A(q) = 0, whereas the zeros are the roots to equation B(q) = 0. The location of the poles and zeros determine the transient response characteristics of the hyperthermia process. In Fig. 2, the horizontal and vertical axes show the real and imaginary parts of the poles and zeros, respectively. Small crosses indicate poles; small circles indicate zeros. The dotted circles of radius 1 represent the stability boundary; poles located outside the circle indicate a dynamically unstable system. Poles located near the inside boundary of the circle or on the negative real axis indicate an oscillatory transient response. Complex valued poles and zeros must be accompanied with their complex conjugates because the system polynomials A and B have real-valued coefficients.
Figure 2.
Pole-zero maps plot the locations of poles and zeros of the same hyperthermia system with different square wave input excitations: the input square-wave with (a) a period of 10 s and a power level of 5 to 20 W; (b) a period of 10 s and a power level of 0.5 to 50 W; (c) a period of 3 s and a power level of 5 to 20 W; (d) a period of 3 s and a power level of 0.5 to 50 W.
Four identification experiments were conducted on the phantom system with four different excitations: the square-wave excitations with periods of 3 and 10 s and power levels of 0.5 and 5 W respectively. For a linear time-invariant system, the coefficients of the system polynomials A and B are constant, and so the pole and zero locations should not vary with power level or the shape of the excitation waveform.
Figure 2(a– d) demonstrates the locations of poles and zeros of the system with four different square-wave excitations: (a) period of 10 s and power level from 5 to 20W, (b) period of 10 s and power level from 0.5 to 50W, (c) period of 3 s power 5 to 20W, and (d) period of 3 s power 0.5 to 50W. The locations of the poles and zeros are significantly changed at different power levels and shapes of the excitation waveforms.
The variation of the locations of the poles and zeros due to different excitations shows that the hyperthermia system is not a time-invariant system. As a result, a fixed gain controller is unlikely to provide adequate transient response characteristics and steady-state tracking accuracy. For this reason, we designed a series of adaptive control systems to regulate the temperature of the time-varying system like the ultrasound hyperthermia system.
Adaptive Control Designs
In comparison with fixed-gain controllers, adaptive control systems automatically tune the control gains to compensate for temporal variations in the system model (23). Adaptive control systems consist of two feedback loops: a fast, inner loop that implements feedback control between the process output and input, and a slow, outer loop that tunes the control parameters. Because the system model for the hyperthermia process is affected by the excitation input, it is expected that the adaptive controller will provide better performance than a fixed-gain controller.
There are two broad categories of adaptive controllers, self-tuning regulators (STR) and model reference adaptive control (MRAC) systems. In STR adaptive controllers, an online system identification scheme is used to continually update a process model, which is then used to select control gains that meet desired performance specifications. In MRAC systems, the difference between the closed-loop output of the process and a reference model exhibiting desired performance characteristics is used to adjust the gain parameters. An MRAC system does not explicitly estimate the process model, and, because it forces the process output to follow that of a reference model, is less sensitive to errors in estimating the process dynamics.
A fixed-gain proportional-plus-integral-plus-derivative (PID) controller was also studied in this research as a reference to evaluate the performance of the adaptive controllers. The results obtained using a PID controller with fixed gains were compared with the adaptive methods in simulations and experiments to demonstrate the advantages of adaptive control.
Self-Tuning Regulator (STR)
The STR uses a polynomial feedback law of the form
| [3] |
where R, S, and T are polynomials. This feedback law can be used to implement a PID controller, or a more advanced designs based on observer feedback systems (23). Figure 3 shows a block diagram of the controller. The transfer function form the command input uc(k) to the process output
| [4] |
Figure 3.
A general linear adaptive controller with two degrees of freedom and adjustable control parameters. B/A is the transfer function of the process. A and B are relative prime and A is also assumed monic (23). R, S, and T are control polynomials to achieve desired performance of the closed-loop system.
The roots of the closed-loop characteristic polynomial Ac,
| [5] |
determine the transient response characteristics of the closed-loop systems. The roots are chosen by the designer, and Eq. [5] is used to solve for the controller polynomials R and S. The polynomial T is chosen so that the closed-loop system in Eq. [5] has desired zero locations.
Model Reference Adaptive Control (MRAC)
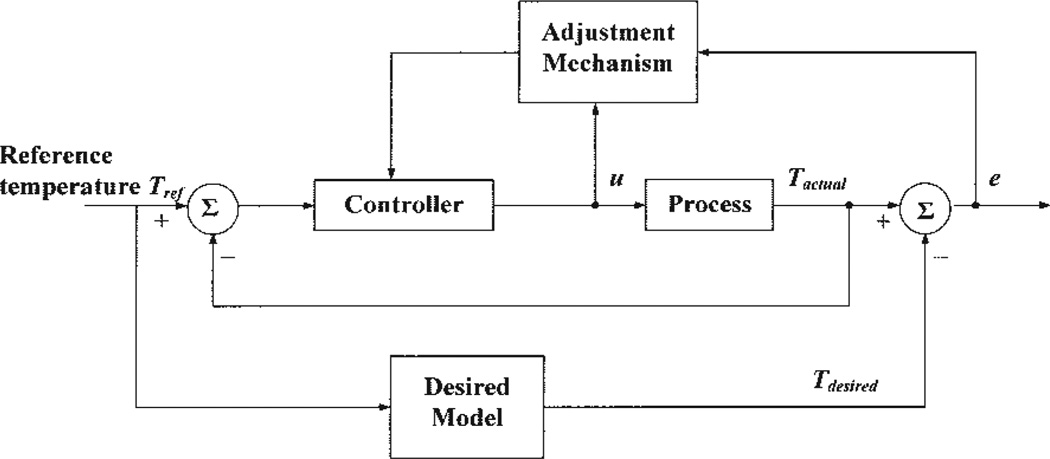
The diagram of a MRAC system is shown in Fig. 4. This system has an inner feedback loop composed of the process and the controller, and an outer feedback loop for adjusting controller parameters. The parameters were changed on the basis of the error between the output of the system, Tactual, and the output of the desired model, Tdesired. We consider two separate parameter adjustment mechanisms (23). The first mechanism is based on Lyapunov stability theory and yields an adjustment mechanism that guarantees stability of the closed-loop adaptive system. The second mechanism uses a gradient method, known as the MIT rule, for adjusting the controller parameters.
Figure 4.
Block diagram of a model reference adaptive control (MRAC) system. The controller is adjusted based on the error between the actual output Tactual and the model output Tdesired and input u.
To design the MRAC, we represent the hyperthermia process using the state-space model
| [6] |
where x(k) is an n × 1 state vector, which represents the temperatures; u(k) is m × 1 vector defining the powers to the amplifier; A is an n × n system matrix, which incorporates both conduction and perfusion terms; and B is an n × m system input matrix, which represents the effects of the m power patterns. It is desired that the closed-loop response x(k) of the hyperthermia process match the response xm(k) of a reference model
| [7] |
where xm(k) is the state vector representing the temperatures of the model and uc(k) is the input vector defining the command inputs to the model. The polynomials Am and Bm are the state matrix and input matrix of the model, respectively, and are chosen by the designer.
The inner loop of the MRAC system uses the general linear control
| [8] |
where M and L are control gain matrices with adjustable parameters θ. Combining Eqs. [6–8] yields a dynamic model for the inner loop of the MRAC system
| [9] |
Let e be the error between the output y of the closed-loop system and the output ym of the model. To minimize the error e, the parameters θ were adjusted in such a way that the loss function
| [10] |
was minimized. As mentioned earlier, there are two techniques for adjusting θ. We first consider the MIT rule, where we move the parameters in the direction of the negative gradient of J, that is,
| [11] |
where γ is the adaptation gain.
Approximating the dynamics of the hyperthermia process as a second-order system and applying the MIT rule yields the parameter adjustment law
| [12] |
The selection of adaptation gain is critical because there is no guarantee that an adaptive controller based on the MIT rule will give a stable closed-loop system.
To guarantee closed-loop stability, we consider a second adjustment that is based on Lyapunov stability theory. By choosing the parameter adjustment law chosen as
| [13] |
where e(k) = x(k) − xm(k), γ > 0 is the adaptation gain; P is a positive definite matrix; ψ is a matrix containing Ac, Bc, Am, and Bm, it can be shown that the closed-loop system is stable. In the Results section, simulation and experimental results for the three adaptive as well as fixed-gain control systems considered in this section are shown: STR adaptive control, MRAC using the MIT rule, MRAC using Lyapunov stability theory, and PID control.
Transrectal Intracavitary Array and Amplifier System
An ultrasound array was designed for transrectal intracavitary use to heat the entire prostate with little harm to other organs from the limited confines of the rectum (24, 25). Resonating at 1.5 MHz, the applicator was constructed of PZT-8 (lead zirconate-titanate, EDO, Salt Lake City, UT) material using one-third cylinder sections cut from 25-mm O.D., 15-mm-long full cylinders. The cylindrical sections were subdivided by scoring the inner electrode surface and were arranged along the primary axis of the applicator body. The array has 16 elements arranged in a 4 × 4 pattern. Each element can be powered individually or in any combination by the amplifier system.
The applicator was powered by a 64-channel high-power ultrasound phased-array driving amplifier (Advanced Surgical System Inc., Tucson, AZ). Designed to operate between 1 and 2 MHz and to deliver 60 W per channel, the amplifiers had externally mounted electrical matching circuits that transformed the transducer impedance to 50Ω, matching the output impedance of the amplifiers (26).
Water circulator (Model 75211-21 and 75211-22, Cole-Parmer Instrument Company, Vernon Hills, IL) and air-flow systems (A-850 Maxima air pump, Rolf Hagen Corp., Mansfield, MA) were connected to the applicator and used to inflate and control the temperature of a latex water bolus (PROcovers®, ATL Supplies, Reedsville, PA), which provided acoustic coupling between the array and the rectum. All components of the array and circulation system were made from nonmagnetic materials.
MR Thermometry
The proton resonance frequency (PRF) has been shown to be linearly dependant on temperature (16). Temperature-induced PRF shifts can be estimated with MRI by measuring changes in the phase of the MR signal and dividing by 2π multiplied by the time in which the phase developed. A reference phase image was acquired before the delivery of ultrasound. Subsequent images were acquired at 7.4-s intervals to measure the phase change over time. Exploration of the temperature-dependant PRF has been shown to have an accuracy of ± 0.5°C (16). From a recent study using the PRF shift for noninvasive temperature monitoring, heating from focused ultrasound was monitored in vivo with an accuracy of 0.37°C and a time resolution of 438 ms (27).
The PRF shift was evaluated by using a spoiled gradient echo (SPGR) sequence with the following imaging parameters: repetition time, TR = 100 ms, echo time, TE = 15 ms, flip angle = 30°, data matrix 64 × 64, field of view (FOV) = 16 × 16 cm, slice thickness = 8 mm, and bandwidth = 61.7 kHz. These parameters were chosen to maximize the temperature-dependent phase shift while maintaining a high temporal resolution. The temperature elevation was obtained using the temperature dependence for muscle α(t) = −0.00909 ppm/oC (17). A birdcage coil with a length of 29 cm and inner diameter of 26 cm was used to acquire the MRI RF signals. The magnet scanner was a 3 Tesla system (MEDSPEC S300, Bruker BioSpin, Ettlingen, Germany).
The MRI-derived average temperature of a 4 × 3 pixel region was used as input to the adaptive controller. This region was chosen to be near an optical temperature probe (Model 3100, Luxtron® Corp., Mountain View, CA). The temperature probe was shielded in a brass catheter to avoid direct ultrasound heating (28) and for the localization in the MR images.
Computer Simulation of Ultrasound Hyperthermia Process
Simulations were initially performed before experiments to compare different control methods and to determine the initial control variables. The acoustical pressure of an 8 × 8 two-dimensional array (29) was calculated by modeling every element of the array as an independent simple source and the net pressure due to all the elements was determined by summing the effects of each simple source (30). The deposited power contributing to the temperature elevation at some depth into the tissue was calculated by considering attenuation appropriately in the model (31).
The nature of heat transfer in tissue from the ultrasound field was determined by applying Pennes’ bioheat transfer equation (32, 33), which combines the convective effects of the blood flow and the conductive properties of soft tissues, providing a simplified model for heat transfer in biological systems (34). In simulation, the bioheat transfer equation was implemented in a space of 40 × 40 × 20 mm3 with digitized spatial and temporal cubic grid of 1 × 1 × 1 mm3 and 1 s period, respectively, and realized using a finite difference method. The focus was located 40 mm away from the surface of the transducer. Boundary condition as well as the initial condition of the block was set at 37°C with the blood temperature constantly at 37°C. Other simulation parameters are tissue density of 998 kg/m3, specific heat of both tissue and blood 3770 J/(kg°C), and thermal conductivity of 0.5W/(m°C).
To conduct computer simulations with different controllers, the distribution of the deposited power in a 3D tissue volume was calculated with initial electrical power of 0.1 W, subsequently the thermal response of the tissue was estimated using the bioheat transfer equation. The temperature at predefined location as well as history data points were analyzed by the adaptive controller to predict the proper amount of power for the next cycle of heating.
To evaluate the performance of the adaptive control and PID control methods, blood perfusion rate was set to linearly increase from 2.0 to 10.0 kg/m3s during the 30-minute heating period. Using STR, the first 20 s of the hyperthermia treatment was used to estimate the initial STR control parameters. For the MRAC methods the initial value of the control parameters Θ was set to zero with proper value of adaptation gains. The reference temperature for all controllers was an exponential signal with a time constant of 4τ = 5 minutes.
Ex Vivo Phantom Experiments
Nine ex vivo phantom experiments with bovine muscle tissue were conducted within the MRI scanner using the intracavitary applicator. The ultrasound array was fastened to a platform made of plexiglas, which has an elliptical hole (8 × 15 cm) as an acoustic window, allowing the ultrasonic energy to be transmitted to the target. Phantoms were placed right above the window with solid contact to the inflated water bolus using ultrasound gel (Sonotech Inc., Bellingham, WA). The degassed water was circulated through the bolus at room temperature to allow the constant boundary condition. MR temperatures in a region of interest (ROI) selected from the tissue from predefined images were used as feedback to the controller. For comparison to the MRI-derived temperature measurement, the ROI was selected adjacent to an optical temperature probe embedded in the tissue.
A desired increase of 8°C above initial temperature was set to simulate the temperature rise for hyperthermia treatment. Exponential function with time constant of 4τ = 6 minutes was applied as reference input. The adaptation gains (γ = 0.005~0.015) and initial control variables were carefully chosen to generate minimal overshoots, small oscillation, and fast settling time. The sonication time was 30 minutes, with the initial electrical power of 0.1 W. The tissue was allowed to return to room temperature before subsequent experiments.
In Vivo Animal Experiments
Rabbit Experiments
Five New Zealand white rabbits (4–5 kg, males) were used for 24 separate control experiments. All animal experiments were conducted with procedures approved by the Penn State Institutional Animal Care and Use Committee (IACUC). The experimental setup for the rabbits test was similar to the ex vivo phantom experiment. Rabbits were anaesthetized with an intramuscular injection of ketamine (40 mg/kg, Fort Dodge Animal Health, Fort Dodge, IA) and xylazine (10 mg/kg, Phoenix Scientific, Inc., St. Joseph, MO). After shaving the thigh, depilatory agent was applied to the skin to eliminate any remaining hair. The rabbits were laid down on the platform on their lateral position and their shaved thigh was just above the ultrasound transducer through the acoustic window. To make effective acoustic contact, ultrasound gel was applied between the water bolus membrane and the rabbit thighs. The rabbit controlled heating experiments were performed in a similar manner as the ex vivo experiments except the control variables used a time constant for the reference temperature at 4τ = 8 minutes, and the ultrasound exposure time was 25 minutes.
Canine Experiment
Two canines (~15 kg mongrel, male) were used for the prostate hyperthermia experiment with the MR thermometry and adaptive temperature controller. These dogs were anaesthetized with Telazol (100 mg/ml, reconstituted with Tilet-amine hydrochloric acid and Zolazepam hydrochloric acid, Fort Dodge Animal Health, Fort Dodge, IA). The rectums of the canines were cleaned and filled with degassed acoustic coupling gel. After placing the dogs on the MRI table, the array was inserted. Good contact was verified by MRI images before baseline temperature sensitive MRI images were collected. The temperature from a predefined region in the canine prostate was selected as the feedback to the controller. The target temperature was set to 43°C, the time constant of the reference was 4τ = 6 minutes, and the exposure time was chosen to be around 8 minutes.
RESULTS
Simulation Results
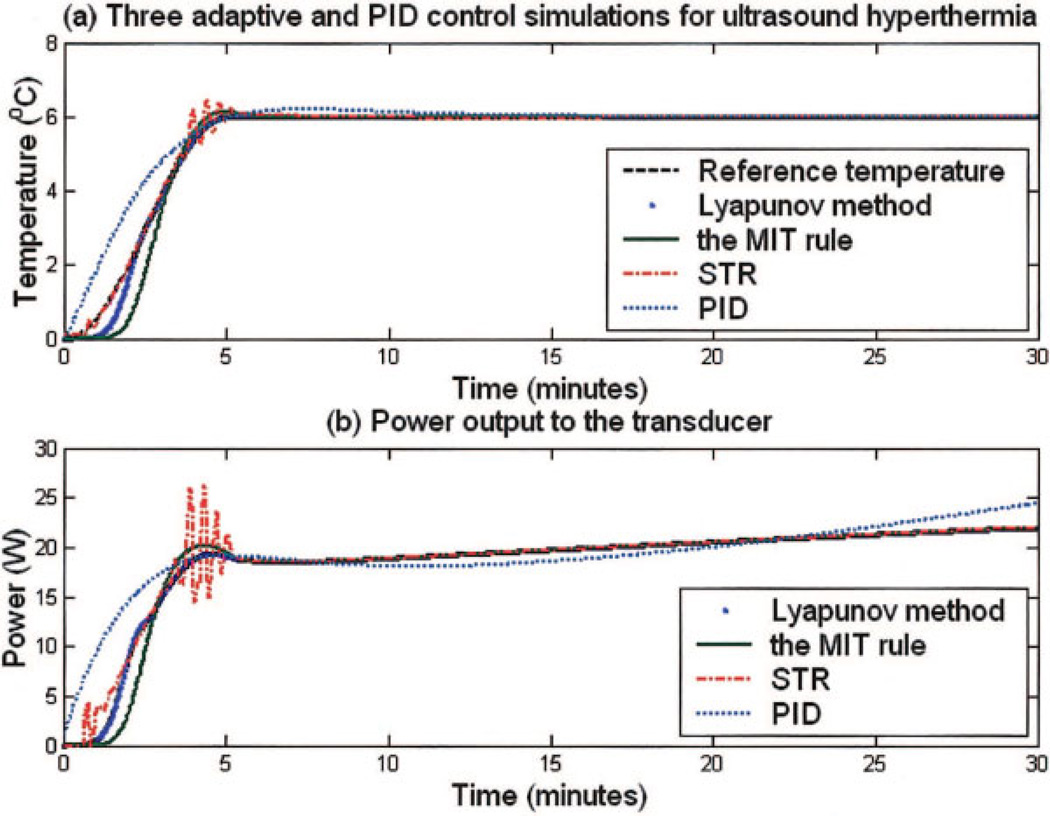
Figure 5(a) shows the reference temperature and the temperature elevations from the adaptive and PID controllers while the power trajectories to the amplifier as directed by each controllers are plotted in Fig. 5(b). The controllers had a desired target temperature of 43°C and rise time of 5 minutes with the blood perfusion linearly increased from 2.0 to 10.0 kg/m3s during the 30-minute hyperthermia simulation. Results of rise time, overshoots, and steady-state errors from Fig. 5(a) are listed in Table 1. All three methods reached the steady state temperature within 5 ± 0.2 minutes and maintained the target temperature with errors less than 0.3°C. It is noted that two MRAC methods had smaller overshoots (0.3°C) than the STR controller (1.4°C).
Figure 5.
Computer simulation results of three adaptive and PID controllers with a blood perfusion rate from 2.0 kg/m3s to 10.0 kg/m3s during the simulated hyperthermia process. (a) Temperature elevation and reference temperature trajectory. Detailed results of rise time, overshoot temperatures, and steady-state errors are listed in Table 2. (b) Electrical power transmitted from the amplifier as a function of time for the Lyapunov-based MRAC, MIT rule-base MRAC, STR, and PID control methods. [Color figure can be viewed in the online issue, which is available at www.interscience.wiley.com.]
Table 1.
Overall Rise Time, Overshoots, and Steady-State Errors Summarized from the Temperature Elevations of the Three Adaptive and PID Controllers Computer Simulations
| Methods | Rise Time (Min) |
Overshoot (°C) |
Steady-State Error (°C) |
|---|---|---|---|
| PID | 4.7 | 0.2 | 0.4 |
| STR | 4.8 | 1.4 | 0.3 |
| MRAC (MIT rule) | 4.9 | 0.3 | 0.1 |
| MRAC (Lyapunov) | 5.0 | 0.2 | 0.1 |
Figure 5(a) plots the temperature elevation of each controller as a function of time.
Ex Vivo Phantom Results
Nine ex vivo experiments were conducted with Lyapunov-based MRAC method using five bovine muscle phantoms. MR temperatures in an ROI adjacent to an optical temperature probe were used as thermal feedback to the controller. The target temperature of 10°C above the ambient temperature (28°C) was desired for 25 minutes of hyperthermia. The time constant of the exponential reference was 4τ = 6 minutes. The adaptation gain of the MRAC method was set to 0.001.
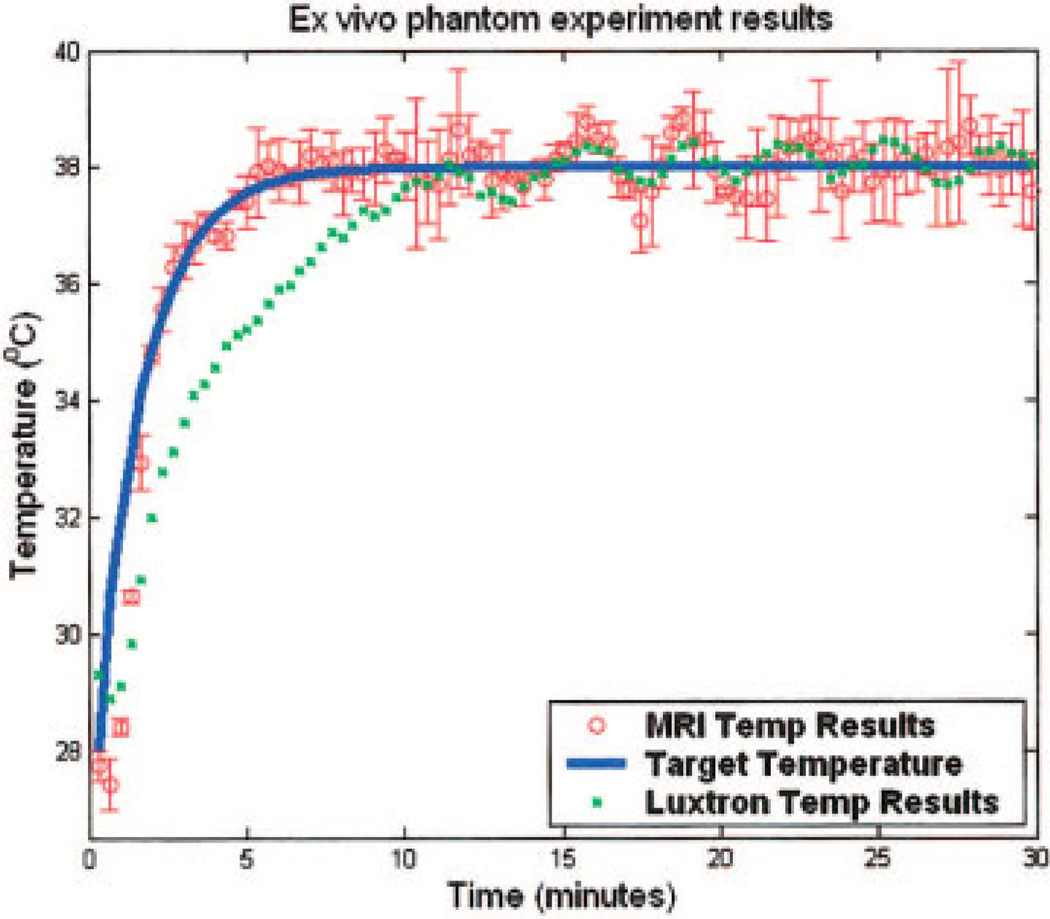
As a typical result, Fig. 6 plots the exponential reference temperature (solid line), the temperature elevation from the fiber optic probe (dots), and the MR measurement within the ROI (open circles, mean ± SD). Starting at an initial phantom temperature of 28°C, the controller achieved the steady-state temperature of 38°C within 6.0 ± 0.2 minutes. The deviation of the MR measurement to the steady-state temperature was no greater than ±1.37°C. After the first 10 minutes, the MR measurement agreed with the probe temperature measurement to within ±0.89°C.
Figure 6.
A typical plot of the result from ex vivo bovine muscle hyperthermia experiments using MRAC adaptive temperature control and MR thermometry. Shown are temperature elevation acquired by MR (circles with error bars) inside the ROI, measurements made by fiber optic probe (small squares) neighboring the ROI, together with reference temperature (line). [Color figure can be viewed in the online issue, which is available at www.interscience.wiley.com.]
In Vivo Animal Results
Rabbit Results
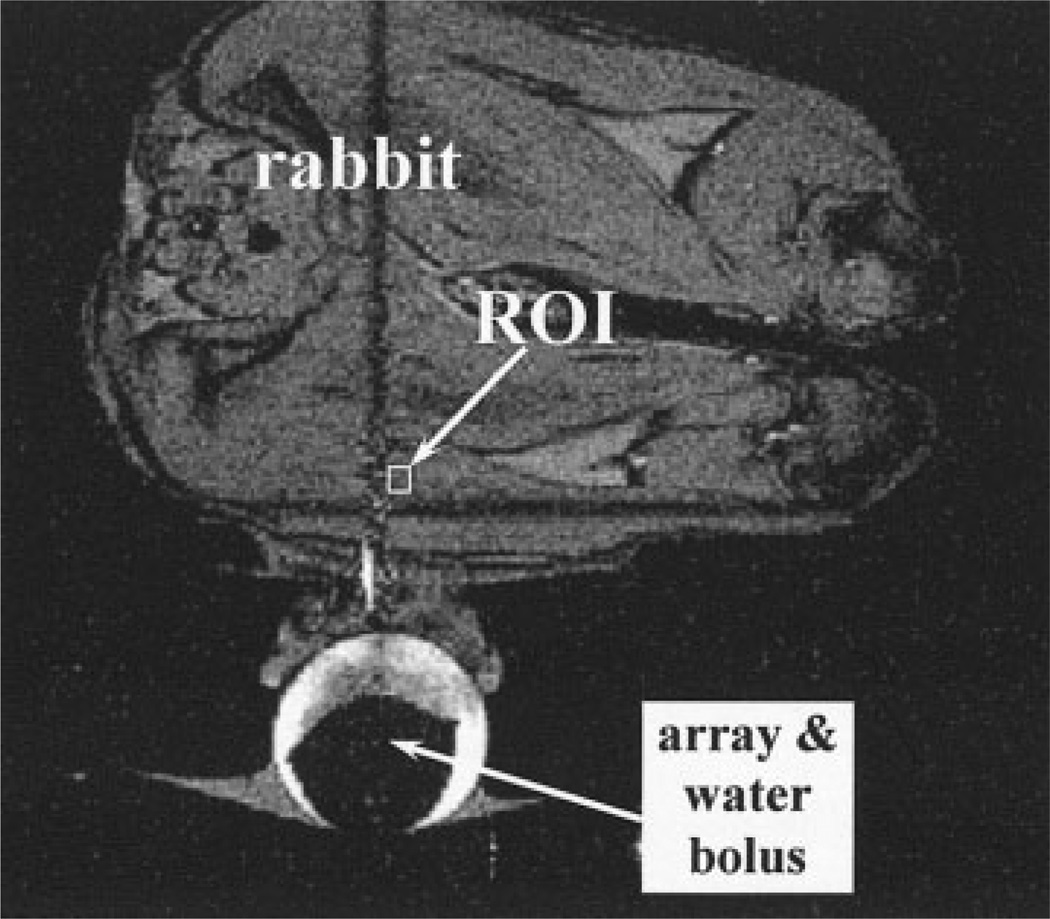
An MR image of an axial view of the rabbit thigh and the transducer orientation is shown in Fig. 7. As indicated in the figure, the array is adjacent to the rabbit thigh along with the ROI in which the temperature was determined for the input to the controller. For rapid hyperthermia heating without causing skin burn, it is desired to reach 44.3°C with the time constant of 4τ = 8 minutes for a total of 25 minutes hyperthermia.
Figure 7.
MR image showing the axial view of the rabbit thigh, displaying the location of the array and water bolus with respect to the ROI.
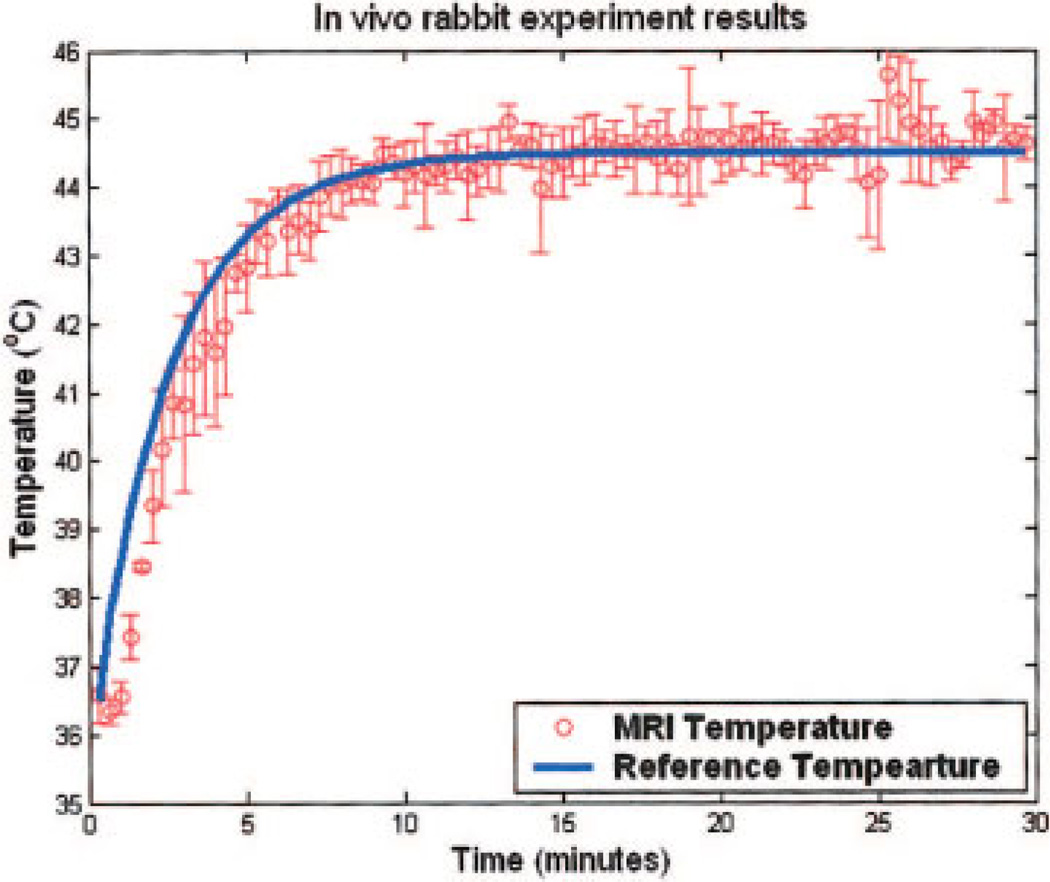
Figure 8 plots a representative result with the reference temperature and MR temperature elevations. The rabbit thigh muscle was heated from 36.8°C to 44.3°C in 8.0 ± 0.5 minutes. The maximum variation from the desired temperature profile was 2.2°C. After reaching steady state, tissue temperature was maintained at 44.3°C with average variation of 1.45°C.
Figure 8.
MRAC adaptive feedback temperature elevation from the average of the in vivo rabbit thigh muscle hyperthermia using the control variables as 4τ = 8 min, adaptation gain = 0.005, and optimized initial value. MR measurement (circles) and reference (line) are plotted versus the time. [Color figure can be viewed in the online issue, which is available at www.interscience.wiley.com.]
Canine Results
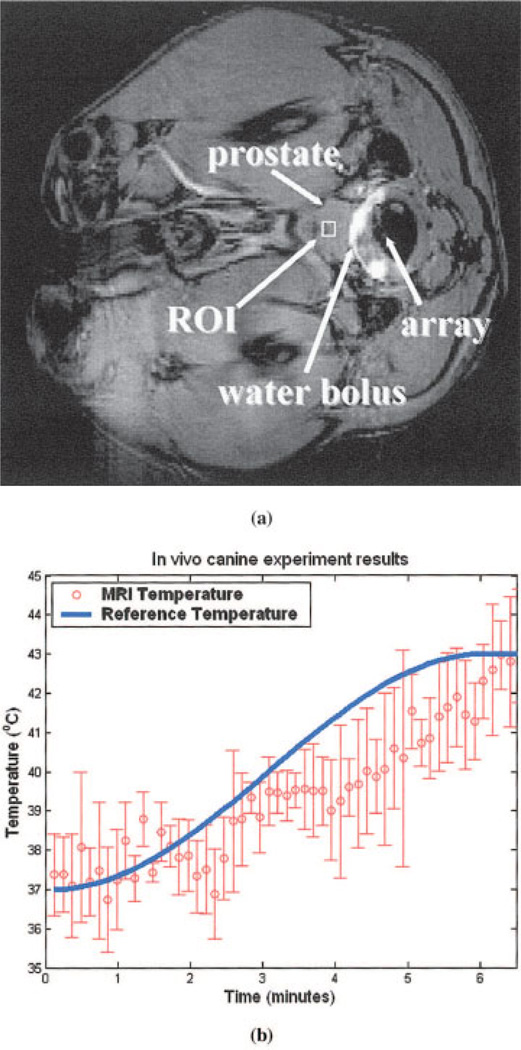
Figure 9(a) shows an axial view of the experimental setup, indicating the ultrasound array solidly coupled to the canine prostate through the water bolus inside the rectum. ROI was chosen in the middle of the prostate as shown in Fig. 9(a) with 4 × 3 pixels. Average MR measurement in the ROI was sent to the Lyapunov-base MRAC controller as thermal feedback. The plot in Fig. 9(b) shows within 6.5 ± 0.5 minutes the canine prostate temperature reached the 43 ± 2.0°C for a total of 10 experiments for two canines. The target temperature was set to be 43°C with exponential time constant 4τ = 6 minutes. To save the animal for as many experiments as possible, each experiment was stopped 1 minute after the steady-state temperature was reached. However, the full 25 minutes heating using rabbits has been shown previously to demonstrate the effectiveness of the controller.
Figure 9.
(a) MR image of the axial view of the canine prostate, showing the location of the ultrasound array, canine prostate, and water bolus. (b) In the preliminary canine prostate hyperthermia experiments, the agreement of MR temperature measurements and the reference indicates the potential of intracavitary ultrasound hyperthermia treatment for human prostate cancer. [Color figure can be viewed in the online issue, which is available at www.interscience.wiley.com.]
DISCUSSIONS AND CONCLUSIONS
In computer simulation, although each control method kept a stable steady-state temperature, the power levels linearly increased as a function of time. This could be explained by the increase in blood perfusion, taking more heat away from the target tissue and resulting in more input energy required to maintain the steady-state temperature. The mean overshoot by STR was substantially higher than that using MRAC and PID methods, which was also demonstrated in the ex vivo experiments using fiber optic probes (Table 2) (35, 36). The main cause of the large vibrations using STR controller was due to the involvement of explicit system identification step. The measurement resolution of the fiber optic thermometer (~0.01°C) is significant compared with the temperature increase per measurement (~0.04°C). Therefore, the estimated system parameters had low accuracy and long convergence period, which resulted in the temperature oscillations in both simulations and ex vivo experiments. Although PID control with fixed gains showed good performance in simulations, its experimental results displayed large overshoot and large steady-state errors. Moreover, one optimal combination of control gains works only for limited hyperthermia systems, any component change (e.g., different transducer or different patient) will need another gain set. Finding the optimal gain is time and effort intense.
Table 2.
Mean Performance of the ex vivo Experiments with Bovine Muscles Using the Conventional PID and the Three Adaptive Controllers
| Methods | Rise Time (Min) |
Overshoot (°C) |
Steady-State Error (°C) |
|---|---|---|---|
| PID | 6.5 | 0.8 | 1.0 |
| STR | 6 | 1.8 | 1.5 |
| MRAC (MIT rule) | 6 | 0.1 | 0.2 |
| MRAC (Lyapunov) | 6 | 0.1 | 0.2 |
MRAC, on the other hand, does not require prior knowledge of the hyperthermia system showing fast rise time, small overshoot, small steady-state oscillations in simulations and ex vivo and in vivo experiments (see Table 2). One important advantage of using MRAC is that the rise time is significant decreased compared with nonadaptive control methods. In previous research using a PID controller with constant gains by Smith et al. (9), about 7–24 minutes was required for 7°C temperature increase, whereas with this MRAC control method, only 6–8 minutes was needed for the same 7°C temperature increase.
Temperature regulation using the MRAC methods and MRI thermal feedback demonstrates the stability and robustness during the ex vivo and in vivo ultrasound hyperthermia experiments. To optimize the controller’s performance, several parameters have been tested, such as time constants of reference temperature, adaptation gains, and initial values of the control variable Θ. The parameters were tested in such a way that one of them was varied, while the others were held constantly. Then the controller’s response of rise time, overshoot temperature, and steady-state errors were analyzed and summarized in Table 3 in the experimental result summary column.
Table 3.
The Experimental Results of Rise Time, Overshoot, and Steady-State Errors by Examining the Variation of One MRAC Control Variable at a Time for Adaptive MRI Thermal Feedback Control of Ultrasound Hyperthermia
| Control Parameters | Experimental Results Summary | |||||
|---|---|---|---|---|---|---|
| Exp. No. |
Time Constant (Min) |
Adaptation Gain |
Initial Values | Rise Time (Min) |
Overshoot (°C) |
Steady-State Error (°C) |
| 1 | 4τ = 3 | 0.005 | Optimized value | 3 ± 0.5 | 1.9 ± 0.6 | 1.8 ± 0.5 |
| 4τ = 8 | 0.005 | Optimized value | 8 ± 0.5 | 1.3 ± 0.3 | 1.5 ± 0.6 | |
| 2 | 4τ = 7.8 | 0.005 | Optimized value | 8.1 ± 0.5 | 1.3 ± 0.3 | 1.5 ± 0.5 |
| 4τ = 7.8 | 0.015 | Optimized value | 7.85 ± 0.5 | 1.5 ± 0.4 | 1.5 ± 0.5 | |
| 3 | 4τ = 6 | 0.005 | Zero | 12 ± 0.5 | 5.2 ± 0.6 | 3.5 ± 0.5 |
| 4τ = 6 | 0.005 | Optimized value | 6 ± 0.5 | 1.1 ± 0.3 | 1.5 ± 0.6 | |
For each experiment (i.e., 1, 2, or 3), the control parameter under investigation is marked as bold.
From Table 3, examining the controller results from experiment 1, it is indicated that with small time constant (4τ = 3 min) the controller is able to reach the therapeutic level faster (3 ± 0.5 min < 8 ± 0.5 min) than with large time constant (4τ = 8 min); however, it caused larger overshoot (1.9 ± 0.6°C > 1.3 ± 0.3°C) and greater oscillations (1.8 ± 0.5°C > 1.5 ± 0.6°C). Based on the allowable overshoot and oscillations, in this research, 4τ was limited to times greater than 5 minutes to ensure animal safety.
From the results of experiment 2 in Table 3, with smaller adaptation gain (γ = 0.005), the adaptive controller updated the control parameters in a slower way so that it took longer (8.1 ± 0.5 min > 7.85 ± 0.5 min) for the control variables to reach the optimal values than with the larger gain (γ = 0.015). Not surprisingly, the conservative manner (γ = 0.005) also resulted in smaller overshoot (1.3 ± 0.3°C < 1.5 ± 0.4°C) and perhaps smaller steady-state error, although not shown in this research.
Finally, since the acquisition of a slice of MRI temperature image took longer time (7.4 s per measurement) than the fiber optic thermometer (up to 0.25 s per measurement), it took a much longer time for the controllers to reach the optimal values starting from zero initial values. To improve this, the initial values optimized from simulations and previous experiments were applied. Table 3 also shows that with optimized initial parameters values, the performance of the control system was significantly improved, yielding smaller rise time (6 ± 0.5 min < 12 ± 0.5 min), less overshoot (1.1 ± 0.3°C < 5.2 ± 0.6°C), and lower steady-state oscillations (1.5 ± 0.6°C < 3.5 ± 0.5°C).
One important issue during MR thermometry is motion. Temperature measurement using MR is actually based on the subtraction of current image with respect to the initial one. Motion during the experiment can result in measurement errors or mistaken measurements, which can typically cause the controller to oscillate or even become unstable. In this research, the temperature was acquired by averaging a region of MR measurement (4 × 3 mm2). This can effectively compensate for small motion, such as breath. Results from the in vivo experiments showed the MRAC controller worked well under small motion. Large motion, such as animal kick, was also observed during the experiments typically followed by experiment failure. To minimize the animal movement, anesthetized drug should be paid special attention to avoid movement as much as possible.
In summary, to accomplish the noninvasive ultrasound hyperthermia treatment, self-tuning regulator (STR) and model reference adaptive control (MRAC) methods with MR thermometry were proposed and applied to an intracavitary ultrasound hyperthermia system. Computer simulations as well as ex vivo phantom and in vivo animal experiments displayed that these methods did not require a priori knowledge of the tissue properties and adaptively adjusted the amplitudes of the array’s driving signal according to the blood perfusion and other dynamic tissue properties to achieve controlled, effective ultrasound hyperthermia.
ACKNOWLEDGEMENTS
This work was supported by the Whitaker Foundation (RG-00-0042) and the Department of Defense Congressionally Directed Medical Prostate Cancer Research Program (DAMD17-0201-0124).
REFERENCES
- 1.Overgaard J, Gonzalez GD, Hulshof MC, Arcangeli G, Dahl O, Mella O, et al. Randomised trial of hyperthermia as adjuvant to radiotherapy for recurrent or metastatic malignant melanoma. European Society for Hyperthermic Oncology. Lancet. 1995;345(8949):540–543. doi: 10.1016/s0140-6736(95)90463-8. [DOI] [PubMed] [Google Scholar]
- 2.Overgaard J. The current and potential role of hyperthermia in radiotherapy. Int J Radiat Oncol Biol Phys. 1989;16:535–549. doi: 10.1016/0360-3016(89)90470-7. [DOI] [PubMed] [Google Scholar]
- 3.Overgaard J, Overgaard M. Hyperthermia as an adjuvent to radiotherapy in the treatment of malignant melanoma. Int J Hyperthermia. 1987;3(6):483–501. doi: 10.3109/02656738709140422. [DOI] [PubMed] [Google Scholar]
- 4.Dewey WC, Hopwood LE, Sapareto SA, Gerweck LE. Cellular response to combination of hyperthermia and radiation. Radiology. 1977;123:463–474. doi: 10.1148/123.2.463. [DOI] [PubMed] [Google Scholar]
- 5.Sneed PK, Phillips TL. Combining hyperthermia and radiation: How beneficial? Oncology. 1991;5(3):99–112. [PubMed] [Google Scholar]
- 6.Falk MH, Issels RD. Hyperthermia in oncology. Int J Hyperthermia. 2001;17(1):1–18. doi: 10.1080/02656730150201552. [DOI] [PubMed] [Google Scholar]
- 7.Hildebrandt B, Wust P, Ahlers O, Dieing A, Sreenivasa G, Kerner T, et al. The cellular and molecular basis of hyperthermia. Crit Rev Oncol Hematol. 2002;43:33–56. doi: 10.1016/s1040-8428(01)00179-2. [DOI] [PubMed] [Google Scholar]
- 8.Wust P, Hildebrandt B, Sreenivasa G, Rau B, Gellermann J, Riess H, et al. Hyperthermia in combined treatment of cancer. Lancet Oncol. 2002;3:487–497. doi: 10.1016/s1470-2045(02)00818-5. [DOI] [PubMed] [Google Scholar]
- 9.Smith NB, Merrilees NK, Dahleh M, Hynynen K. Control system for an MRI compatible intracavitary ultrasound array for thermal treatment of prostate disease. Int J Hyperthermia. 2001;17(3):271–282. doi: 10.1080/02656730010025841. [DOI] [PubMed] [Google Scholar]
- 10.Salomir R, Vimeux FC, de Zwart JA, Grenier N, Moonen CT. Hyperthermia by MR-guided focused ultrasound: accurate temperature control based on fast MRI and a physical model of local energy deposition and heat conduction. Magn Reson Med. 2000;43(3):342–347. doi: 10.1002/(sici)1522-2594(200003)43:3<342::aid-mrm4>3.0.co;2-6. [DOI] [PubMed] [Google Scholar]
- 11.Hazle JD, Diederich CJ, Kangasniemi M, Price RE, Olsson LE, Stafford RJ. MRI-guided thermal therapy of transplanted tumors in the canine prostate using a directional transurethral ultrasound applicator. J Magn Reson Imaging. 2002;15:409–417. doi: 10.1002/jmri.10076. [DOI] [PubMed] [Google Scholar]
- 12.McNichols RJ, Kangasniemi M, Gowda A, Bankson JA, Price RE, Hazle JD. Technical developments for cerebral thermal treatment: Water-cooled diffusing laser fibre tips and temperature-sensitive MRI using intersecting image planes. Int J Hyperthermia. 2004;20:45–56. doi: 10.1080/02656730310001611035. [DOI] [PubMed] [Google Scholar]
- 13.Weidensteiner C, Quesson B, Caire-Gana B, Kerioui N, Rullier A, Trillaud H, et al. Real-time MR temperature mapping of rabbit liver in vivo during thermal ablation. Magn Reson Med. 2003;50:322–330. doi: 10.1002/mrm.10521. [DOI] [PubMed] [Google Scholar]
- 14.Wust P, Gellermann J, Seebass M, Fahling H, Turner P, Wlodarczyk W, et al. Part-body hyperthermia with a radiofrequency multiantenna applicator under online control in a 1.5 T MR-tomograph. Rofo. 2004;176:363–374. doi: 10.1055/s-2004-812736. [DOI] [PubMed] [Google Scholar]
- 15.Guilhon E, Quesson B, Moraud-Gaudry F, de Verneuil H, Canioni P, Salomir R, et al. Image-guided control of transgene expression based on local hyperthermia. Mol Imaging. 2003;2:11–17. doi: 10.1162/15353500200302151. [DOI] [PubMed] [Google Scholar]
- 16.Ishihara Y, Calderon A, Watanabe H, Okamoto K, Suzuki Y, Kuroda K, et al. A precise and fast temperature mapping using water proton chemical shift. Magn Reson Med. 1995;34(6):814–823. doi: 10.1002/mrm.1910340606. [DOI] [PubMed] [Google Scholar]
- 17.Kuroda K, Chung A, Hynynen K, Jolesz F. Calibration of water proton chemical shift with temperature for noninvasive temperature imaging during focused ultrasound surgery. J Magn Reson Imaging. 1998;8(1):175–181. doi: 10.1002/jmri.1880080130. [DOI] [PubMed] [Google Scholar]
- 18.Behnia B, Suther M, Webb AG. Closed-loop feedback control of phased-array microwave heating using thermal measurements from magnetic resonance imaging. Magn Reson Eng. 2002;15(1):101110. [Google Scholar]
- 19.Quesson B, Vimeux F, Salomir R, de Zwart JA, Moonen CT. Automatic control of hyperthermic therapy based on real-time Fourier analysis of MR temperature maps. Magn Reson Med. 2002;47(6):1065–1072. doi: 10.1002/mrm.10176. [DOI] [PubMed] [Google Scholar]
- 20.Hutchinson E, Dahleh M, Hynynen K. The feasibility of MRI feedback control for intracavitary phased array hyperthermia treatments. Int J Hyperthermia. 1998;14(1):39–56. doi: 10.3109/02656739809018213. [DOI] [PubMed] [Google Scholar]
- 21.Vanne A, Hynynen K. MRI feedback temperature control for focused ultrasound surgery. Phys Med Biol. 2003;48(1):31–43. doi: 10.1088/0031-9155/48/1/303. [DOI] [PubMed] [Google Scholar]
- 22.Mougenot C, Salomir R, Palussiere J, Grenier N, Moonen CT. Automatic spatial and temporal temperature control for MR-guided focused ultrasound using fast 3D MR thermometry and multispiral trajectory of the focal point. Magn Reson Med. 2004;52:1005–1015. doi: 10.1002/mrm.20280. [DOI] [PubMed] [Google Scholar]
- 23.Astrom KJ, Wittenmark B. Adaptive control. Boston: Addison-Wesley; 1995. [Google Scholar]
- 24.Diederich CJ, Hynynen K. The feasibility of using electrically focused ultrasound arrays to induce deep hyperthermia via body cavities. IEEE Trans Ultrason Ferroelectr Freq Control. 1991;38(3):207–219. doi: 10.1109/58.79605. [DOI] [PubMed] [Google Scholar]
- 25.Smith NB, Buchanan M, Hynynen K. Transrectal ultrasound applicator for prostate heating monitored using MRI thermometry. Int J Radiat Oncol Biol Phys. 1998;43(1):217–225. doi: 10.1016/s0360-3016(98)00366-6. [DOI] [PubMed] [Google Scholar]
- 26.Daum DR, Buchanan MT, Fjield T, Hynynen K. Design and evaluation of a feedback based phased array system for ultrasound surgery. IEEE Trans Ultrason Ferroelectr Freq Control. 1998;45(2):431–438. doi: 10.1109/58.660153. [DOI] [PubMed] [Google Scholar]
- 27.de Zwart JA, Vimeux FC, Delalande C, Canioni P, Moonen CT. Fast lipid-suppressed MR temperature mapping with echo-shifted gradient-echo imaging and spectral-spatial excitation. Magn Reson Med. 1999;42:53–59. doi: 10.1002/(sici)1522-2594(199907)42:1<53::aid-mrm9>3.0.co;2-s. [DOI] [PubMed] [Google Scholar]
- 28.Hynynen K, Edwards DK. Temperature measurements during ultrasound hyperthermia. Med Phys. 1989;16(4):618–626. doi: 10.1118/1.596364. [DOI] [PubMed] [Google Scholar]
- 29.Saleh K, Smith NB. Two dimensional array design for tissue ablation for treatment of benign prosthetic hyperplasia. Int J Hyperthermia. 2004;20(1):7–31. doi: 10.1080/0265673031000150867. [DOI] [PubMed] [Google Scholar]
- 30.Goodman JW. Introduction to Fourier optics. New York: McGraw-Hill; 1968. [Google Scholar]
- 31.Nyborg W. Heat generation by ultrasound in a relaxing medium. J Acoust Soc Am. 1981;70:310–312. [Google Scholar]
- 32.Pennes HH. Analysis of tissue and arterial blood temperatures in the resting human forearm. J Appl Physiol. 1948;1:93–122. doi: 10.1152/jappl.1948.1.2.93. [DOI] [PubMed] [Google Scholar]
- 33.Sapareto SA, Dewey WC. Thermal dose determination in cancer therapy. Int J Radiat Oncol Biol Phys. 1984;10:787–800. doi: 10.1016/0360-3016(84)90379-1. [DOI] [PubMed] [Google Scholar]
- 34.Strohbehn JW. Hyperthermia equipment evaluation. Int J Hyperthermia. 1994;10(3):429–432. doi: 10.3109/02656739409010288. [DOI] [PubMed] [Google Scholar]
- 35.Sun L, Schiano JL, Smith NB. An adaptive control method for ultrasound prostate hyperthermia. Proc IASTED Int Conf AMS; November 4–6; Cambridge, MA. 2002. pp. 347–352. [Google Scholar]
- 36.Sun L, Schiano JL, Smith NB. Novel adaptive control methods for ultrasound thermal treatment with a two-dimensional tapered array. Proc IEEE Ultrasonics Symposium; October 8–11; Honolulu, HI. 2003. pp. 1274–1277. [Google Scholar]


