

Abstract
The orientation of the mitotic spindle with respect to the polarity axis is crucial for the accuracy of asymmetric cell division. In budding yeast, a surveillance mechanism called the spindle position checkpoint (SPOC) prevents exit from mitosis when the mitotic spindle fails to align along the mother-to-daughter polarity axis. SPOC arrest relies upon inhibition of the GTPase Tem1 by the GTPase-activating protein (GAP) complex Bfa1–Bub2. Importantly, reactions signaling mitotic exit take place at yeast centrosomes (named spindle pole bodies, SPBs) and the GAP complex also promotes SPB localization of Tem1. Yet, whether the regulation of Tem1 by Bfa1–Bub2 takes place only at the SPBs remains elusive. Here, we present a quantitative analysis of Bfa1–Bub2 and Tem1 localization at the SPBs. Based on the measured SPB-bound protein levels, we introduce a dynamical model of the SPOC that describes the regulation of Bfa1 and Tem1. Our model suggests that Bfa1 interacts with Tem1 in the cytoplasm as well as at the SPBs to provide efficient Tem1 inhibition.
Keywords: Bfa1, mitotic exit network, modeling and simulation, spindle position checkpoint, Tem1
Introduction
In many eukaryotic cells, the mitotic spindle dictates the site of cell division (Straight and Field, 2000). However in budding yeast, the site of cytokinesis (bud neck) is determined early in the cell cycle independently of the mitotic spindle (Pruyne and Bretscher, 2000; Casamayor and Snyder, 2002). Therefore, to preserve the fidelity of chromosome segregation, budding yeast’s mitotic spindle must elongate along the mother-to-daughter cell polarity axis, moving one set of chromosomes through the bud neck into the daughter cell compartment (also named as ‘bud’). Two functionally redundant microtubule-associated pathways, namely Kar9- and dynein-dependent pathways, orientate the spindle with respect to the cell polarity axis (Siller and Doe, 2009; Moore and Cooper, 2010). If the spindle fails to align properly, a surveillance mechanism called the spindle position checkpoint (SPOC) prevents cells from exiting mitosis until correct spindle orientation is achieved (Caydasi et al, 2010a).
Mitotic exit in budding yeast is driven by a signal transduction cascade called the mitotic exit network (MEN) (Figure 1A) (Jaspersen et al, 1998). Activation of the small GTPase Tem1 is the most upstream event in the initiation of MEN (Lee et al, 2001). Yet, Tem1 activation is not well understood. For many years, the Lte1 protein was postulated to function as the guanine nucleotide exchange factor (GEF) of Tem1 (Shirayama et al, 1994a, 1994b). However, this view was recently disproved and so far a GEF for Tem1 has not been identified (Yoshida et al, 2003; Geymonat et al, 2009, 2010; Bertazzi et al, 2011; Falk et al, 2011). Inactivation of Tem1 occurs via acceleration of Tem1 GTP hydrolysis by the Bfa1–Bub2 GTPase-activating protein (GAP) complex (Geymonat et al, 2002). Bfa1 and Bub2 are essential components of the SPOC (Fesquet et al, 1999; Fraschini et al, 1999; Li, 1999; Pereira et al, 2000; Wang et al, 2000).
Figure 1.

MEN and SPOC. (A) Schematic representation of MEN and SPOC pathways. Tem1 triggers the MEN cascade by promoting SPB recruitment of Cdc15 kinase, which activates Dbf2–Mob1 at the SPBs. Dbf2–Mob1 promotes the full release of Cdc14 from the nucleolus into the cytoplasm. Fully released Cdc14 inactivates the mitotic cyclin/Cdk and reverses the Cdk-dependent phosphorylation of several Cdk substrates, hence providing mitotic exit (Visintin et al, 1998; Jaspersen et al, 1999; Stegmeier and Amon, 2004). Misalignment of the mitotic spindle activates Bfa1–Bub2 via Kin4, hence Tem1 is inhibited. Kin4 is under tight control: Phosphorylation of the conserved threonine (T209) residue within Kin4’s activation loop by the bud neck kinase Elm1 is essential for Kin4 catalytic activity (Caydasi et al, 2010b; Moore et al, 2010). Rts1, B type regulatory subunit of the protein phosphatase 2A (PP2A), provides proper Kin4 localization at the SPBs and at the mother cell cortex by promoting Kin4 dephosphorylation (Chan and Amon, 2009; Caydasi et al, 2010b). Daughter-specific protein Lte1 inactivates Kin4 and excludes it from the dSPB during an unperturbed anaphase, counteracting Rts1 (Bertazzi et al, 2011; Falk et al, 2011). (B) Localization of the SPOC components (colored in A) in an anaphase cell with misaligned (left panel) and correctly aligned (right panel) spindle. Protein color coding is consistent in (A, B).
The activity of the Bfa1–Bub2 GAP complex is kept under tight control. In cells with correctly aligned spindles, the polo-like kinase Cdc5 inactivates the GAP complex by phosphorylating Bfa1 (Gruneberg et al, 2000; Hu et al, 2001; Geymonat et al, 2003; Park et al, 2004). However, upon spindle misalignment, the kinase Kin4 phosphorylates Bfa1, preventing its inhibitory phosphorylation by Cdc5. Kin4 is therefore crucial for maintaining the GAP complex active (D’Aquino et al, 2005; Pereira and Schiebel, 2005; Maekawa et al, 2007; Caydasi and Pereira, 2009) (Figure 1A).
The yeast centrosomes (named spindle pole bodies, SPBs) have a critical role in the regulation of mitotic exit. Association of Tem1 with SPBs is indispensable for MEN activation (Gruneberg et al, 2000; Valerio-Santiago and Monje-Casas, 2011). Active Tem1 at the SPBs promotes SPB binding of its effector kinase Cdc15, which in turn is required for activation and SPB localization of the downstream kinase Dbf2 in complex with its regulatory subunit Mob1 (Figure 1A) (Cenamor et al, 1999; Asakawa et al, 2001; Visintin and Amon, 2001). The SPB also plays a key role in SPOC regulation. Inhibition of the GAP complex by Cdc5 occurs at the SPBs (Maekawa et al, 2007). During an unperturbed mitosis, Bfa1–Bub2 and Tem1 preferentially bind to the SPB that moves into the daughter cell (dSPB, daughter SPB), whereas during spindle misalignment they associate equally with both SPBs albeit at reduced levels compared with cells with correctly aligned spindles (Pereira et al, 2000; Molk et al, 2004; Caydasi and Pereira, 2009) (Figure 1B). This localization change is a consequence of the phosphorylation of Bfa1 by Kin4, which destabilizes the binding of Bfa1–Bub2 GAP complex to the SPBs, and seems to be crucial for the checkpoint activity (Pereira and Schiebel, 2005; Caydasi and Pereira, 2009). Although Tem1 SPB binding is highly dynamic irrespective of the spindle orientation status, Tem1 levels at the SPBs also decrease during spindle misalignment because Tem1 SPB association mainly occurs via its interaction with the GAP complex (Molk et al, 2004; Caydasi and Pereira, 2009; Valerio-Santiago and Monje-Casas, 2011). However, a small pool of Tem1 can bind more stably to the SPBs in a GAP-independent manner (Pereira et al, 2000; Caydasi and Pereira, 2009; Valerio-Santiago and Monje-Casas, 2011). The physiological significance and regulation of this pool is not yet understood.
It is clear that inhibition of the MEN in response to spindle misalignment involves an intricate regulatory network that controls Tem1 localization and GTP hydrolysis by Bfa1–Bub2 GAP complex; in addition to Bfa1 localization and phosphorylation by Kin4 and Cdc5 kinases. Quantitative analysis and mathematical modeling are important tools that help to elucidate how such elaborate systems might work. So far, mathematical models have helped to enlighten some mitotic control mechanisms; however, no modeling has been done for SPOC (Chen et al, 2004; Doncic et al, 2005; Toth et al, 2007; Lohel et al, 2009; Lopez-Aviles et al, 2009; Simonetta et al, 2009). One of the reasons for this is the lack of quantitative data on SPOC, which is restricted to in-vitro assays of Tem1 (nucleotide-binding properties and GTPase activity) in addition to microscopy studies of Bfa1–Bub2 and Tem1 (SPB-binding dynamics) (Geymonat et al, 2002, 2003; Molk et al, 2004; ; Caydasi and Pereira, 2009; Monje-Casas and Amon, 2009; Valerio-Santiago and Monje-Casas, 2011). Here, we employed a fluorescence microscopy based strategy to quantify the number of Bfa1, Bub2 and Tem1 molecules associated with the SPBs. By combining protein numbers with quantitative time-lapse data, we assessed the amounts of GAP-dependent and -independent Tem1 pools at the SPBs and showed that they coexist during mitosis. These quantitative studies served as a basis to construct a compartmentalized dynamical model of the SPOC. Our model points out the importance of cytoplasmic Bfa1–Tem1 interactions for robust inhibition of Tem1 in response to spindle misalignment and it highlights the contribution of Cdc5-independent Bfa1 inhibitory mechanisms to allow rapid Tem1 activation upon spindle realignment.
Results
Quantification of the number of Bfa1, Bub2 and Tem1 molecules at the SPBs
To estimate the levels of Bfa1, Bub2 and Tem1 at the SPBs during anaphase, we employed a fluorescence ratio method that uses GFP-tagged structural kinetochore proteins as reference standard (Joglekar et al, 2006, 2008). It was established that in anaphase ∼352 molecules of Nuf2–GFP, 352 molecules of Ndc80–GFP and 83 molecules of Cse4–GFP are present at each kinetochore cluster, which consists of 16 kinetochores clustered in the vicinity of each SPB (Coffman et al, 2011; Lawrimore et al, 2011). The experimental set up was implemented in our strain background, using Nuf2–GFP as a reference to calculate the relative fluorescence intensity of each protein of interest (POI). Importantly, the mean fluorescence intensities of Cse4–GFP, Ndc80–GFP and an integrated signal of Nuf2–GFP and Ndc80–GFP linearly correlated with the known number of molecules at the kinetochores, validating the accuracy of our measurements (Supplementary Figure 1A and B).
We next measured the mean fluorescence intensities of Bfa1–GFP, Bub2–GFP and Tem1–GFP at the SPBs of anaphase cells in a kar9Δ background. KAR9 deleted cells frequently misalign their anaphase spindle, hence allowing for the capture of both normal- and mis-oriented spindles in the same strain background. Signal intensities at the daughter and the mother SPBs (dSPB and mSPB, respectively) were computed separately for cells with normally aligned spindles. In the case of spindle misalignment, measurements of dSPB and mSPB were combined (any SPB) because the signal intensities at the two SPBs were not significantly different (Supplementary Figure 1C). SPB-bound Bfa1–Bub2 and Tem1 levels are not constant during anaphase (Molk et al, 2004; Caydasi and Pereira, 2009). Consistent with this, we observed a relatively high fluorescence intensity variation within Bfa1–GFP, Bub2–GFP and Tem1–GFP sample populations (coefficient of variation>47%) compared with the Nuf2–GFP signal distribution (coefficient of variation <25%) (Supplementary Figure 1C). We also compared the total cellular levels of Bfa1–GFP, Bub2–GFP and Tem1–GFP by measuring their whole-cell mean fluorescence intensities during anaphase. We found that Bfa1 and Bub2 had similar total cellular amounts, whereas Tem1 was 2.5-fold higher than Bfa1 or Bub2 (Supplementary Figure 2).
Based on Nuf2–GFP, we calculated the number of Bfa1–GFP, Bub2–GFP and Tem1–GFP molecules at SPBs (Figure 2A; Table I). When comparing the average SPB-bound amounts of Bfa1 and Bub2 in cells with normal aligned anaphase spindles, we observed an asymmetric index (ratio of dSPB- to mSPB-associated protein) of 5–6. In the case of spindle misalignment, mean Bfa1 and Bub2 numbers at both SPBs were similar to the levels observed at the mSPB during a normal anaphase. The same was true for Tem1. However, in comparison to Bfa1 and Bub2, higher levels of Tem1 were detected at the mSPB and SPBs of cells with misaligned spindles. Furthermore, although the majority of Tem1 is targeted to the SPBs via the GAP complex (Pereira et al, 2000), the asymmetric index observed for Tem1 during normal anaphase was only 2.3 compared with 5–6 for Bfa1–Bub2. Thus, the binding of Tem1 to daughter and mother SPBs differs from Bfa1 and Bub2 in anaphase.
Figure 2.
Tem1, Bfa1 and Bub2 levels at the SPBs. (A) Box-whisker plots representing the number of molecule distributions of SPB-bound Tem1–GFP, Bfa1–GFP and Bub2–GFP in kar9Δ cells during anaphase. (B) Mean fluorescence intensities of Bfa1–3mCherry and Tem1–GFP at the SPBs during mitosis. (C) Box-whisker plots of SPB-bound Tem1–GFP number of molecules in bfa1Δ bub2Δ cells during early (2 μm <spindle length<4 μm) and late anaphase (spindle length>4 μm). (D) Mean fluorescence intensity of SPB-bound Tem1–GFP in bfa1Δ bub2Δ cells during mitosis. In box-whisker plots, upper and the lower boundaries of the boxes are the third and the first quartiles. The lines and circles in the boxes show the median and mean values, respectively. Whiskers indicate the tenth and the ninetieth percentiles. Mean fluorescence intensity line graphs are the average of ‘n’ cells monitored with 1-min time resolution. In each cell, maximum signal of each protein is normalized to 1. The distances between the SPBs (pole-to-pole distances) are plotted as a reference for cell cycle progression. Source data is available for this figure in the Supplementary Information.

Table 1. Bfa1, Bub2 and Tem1 number of molecules at the SPBs.
| Mean | s.d.a | CVb (%) | SPB:totalc | |
|---|---|---|---|---|
| Bfa1 | ||||
| Misalignmentd | 50 | 32 | 64 | 0.04 |
| Alignment, mSPB | 57 | 39 | 68 | 0.04 |
| Alignment, dSPB | 287 | 96 | 34 | 0.21 |
| Bub2 | ||||
| Misalignmentd | 37 | 24 | 65 | 0.03 |
| Alignment, mSPB | 31 | 21 | 68 | 0.02 |
| Alignment, dSPB | 199 | 89 | 45 | 0.14 |
| Tem1 | ||||
| Misalignmentd | 125 | 35 | 28 | 0.03 |
| Alignment, mSPB | 112 | 41 | 37 | 0.03 |
| Alignment, dSPB | 255 | 98 | 38 | 0.07 |
| bfa1Δ bub2Δ (spindle<4 μm)d | 75 | 29 | 39 | 0.02 |
| bfa1Δ bub2Δ (spindle>4 μm)d | 96 | 31 | 32 | 0.03 |
aStandard deviation.
bCoefficient of variation.
cRatio of the SPB-bound protein to the total cellular amount of the protein.
dAny of the SPBs.
We next compared the SPB localization of Bfa1 and Tem1 throughout mitosis by time-lapse microscopy of cells simultaneously expressing TEM1–GFP and BFA1–3mCherry (Figure 2B; Supplementary Figure 3A). Along with the mean fluorescence intensities at the SPBs, distances between the SPBs (pole-to-pole distances) were measured as a reference for spindle elongation and hence cell-cycle progression. As previously shown for Bfa1–GFP, Bfa1–3mCherry levels increased at the dSPB and decreased at the mSPB during early anaphase (Caydasi and Pereira, 2009). Tem1–GFP also increased at the dSPB similar to Bfa1, but did not drastically change at the mSPB. After the spindle reached 7 μm in length, a sharp drop was observed for dSPB-bound Bfa1, whereas the decline of Tem1 at the dSPB was rather slow. Importantly, time-lapse analysis of cells carrying Bfa1–3mCherry and Bub2–GFP revealed that the SPB localization profile of Bub2–GFP was similar to that of Bfa1–3mCherry during mitosis (Supplementary Figure 3B).
While the vast majority of Tem1 binds to the SPBs via the GAP complex, there is a small pool of Tem1 that binds to both SPBs (in a symmetric manner) in the absence of Bfa1 or Bub2 (Pereira et al, 2002; Caydasi and Pereira, 2009; Valerio-Santiago and Monje-Casas, 2011). We refer to this fraction of Tem1 as the ‘GAP-independent pool’. We reasoned that this pool might be responsible for the differences between Tem1 and Bfa1 SPB localization profiles during mitosis. Using TEM1–GFP bfa1Δ bub2Δ cells, we determined the average number of GAP-independent Tem1 molecules at the SPBs in early (spindle <4 μm) and late anaphase (spindle >4 μm). Because mSPB and dSPB bind equal amount of Tem1, we combined the measurements of both SPBs (represented as ‘any SPB’; Supplementary Figure 1C and D; Figure 2C; Table I). In concordance with previous reports, the GAP-independent Tem1 pool was relatively small and the amounts were significantly less in early than in the late anaphase (Figure 2C; Table I) (Pereira et al, 2000; Valerio-Santiago and Monje-Casas, 2011). Time-lapse analysis of Tem1–GFP in bfa1Δ bub2Δ cells confirmed that the GAP-independent Tem1 levels did not change significantly from metaphase until mid-anaphase (Figure 2D; Supplementary Figure 3C). Only after the anaphase spindle reached a length of 6–7 μm, the increase of Tem1 at both SPBs became pronounced (Figure 2D). Interestingly, in bfa1Δ bub2Δ cells, maximum levels of Tem1 at the SPBs were observed after spindle collapse (Figure 2D). These data thus suggest that the maximum level of GAP-independent Tem1 at the SPBs is reached after mitotic exit.
GAP-dependent and GAP-independent pools of Tem1 coexist at the SPBs
We next asked whether two Tem1-binding sites (GAP-dependent and GAP-independent) coexist at the SPBs in cells expressing BFA1 and BUB2. This was particularly important because the presence of the Tem1 GAP-independent pool at SPBs was so far based on the analysis of bfa1Δ bub2Δ cells. However, whether this GAP-independent binding site would also contribute to Tem1 SPB localization in the presence of Bfa1–Bub2 was not analyzed. We postulated that if Tem1 associates with two binding sites at SPBs, the SPB-binding profile of Tem1 in wild-type (WT) cells should represent the sum of the GAP-dependent and -independent pools. If this were true, subtracting the GAP-independent pool of Tem1 from the total SPB-associated Tem1 pool should give rise to a SPB-binding profile closer to the one observed for Bfa1 and/or Bub2. To test this hypothesis, we converted the SPB-associated fluorescence intensities obtained from the time-lapse analysis of TEM1–GFP BFA1–3mCherry and TEM1–GFP Spc42–eqFP bfa1Δ bub2Δ cells (Figure 2B and D) into protein numbers by scaling the curves in the y-axis according to the average number of molecules presented in Table I (Figure 3A and B). This conversion allowed comparison of protein levels among different fluorophores and time lapses. By subtracting the scaled Tem1 time-lapse curve of bfa1Δ bub2Δ cells from that of WT cells, we obtained a hypothetical time-lapse curve for the number of Tem1 molecules recruited to SPBs in a GAP-dependent manner (Figure 3C, upper panel). Interestingly, this GAP-dependent curve for Tem1 displayed the same profile of the Bfa1 curve, as its ratio to Bfa1 remained relatively constant over time (Figure 3C, lower panel). Collectively, our data indicate that GAP-dependent and -independent pools of Tem1 coexist at the SPBs of WT cells throughout mitosis and the difference in SPB localization of Tem1 and Bfa1 results from the Tem1 GAP-independent pool.
Figure 3.
Number of molecules of Bfa1 and Tem1 at the SPBs as the cells progress in mitosis. mSPB- and dSPB-bound protein numbers of Bfa1 (A), Tem1 (B, left) and GAP-independent pool of Tem1 (B, right) derived from the mean fluorescence intensity curves in Figure 2B and D, according to the average number of molecules shown in Table I. (C) Upper panel: Hypothetical GAP-dependent Tem1 numbers at the SPBs obtained by subtraction of the Tem1 (bfa1Δ bub2Δ) curve (B, right) from Tem1 (WT) curve (B, left). Lower panel: Tem1 to Bfa1 ratio versus time obtained by division of Tem1 (WT) (B, left) or Tem1 (bfa1Δ bub2Δ) (B, right) curves to the Bfa1 curve (A). (D) Mean fluorescence intensity of Mob1–GFP at the SPBs and the bud neck in WT and bfa1Δ bub2Δ cells carrying Spc42–eqFP. The time point when the fast spindle elongation starts, when Mob1–GFP peaks at the SPBs and at the bud neck are indicated with dashed lines. The corresponding time points are also marked in (B). ‘n’ shows the number of cells from which the graphs are obtained. The distances between the SPBs (pole-to-pole distances) are plotted as a reference for cell-cycle progression. (E) Number of molecules of Bfa1 and Tem1 during the course of spindle misalignment and realignment. Numbers are derived from the time-lapse data shown in Supplementary Figure 5 according to the average number of molecules shown in Table I. Shaded region marks the period of spindle misalignment. Source data is available for this figure in the Supplementary Information.

SPB-bound Tem1 levels sufficient for MEN activation
Taking into account that complete depletion of Tem1 from the SPBs prevents MEN activation (Gruneberg et al, 2000; Valerio-Santiago and Monje-Casas, 2011), we sought to determine the number of SPB-bound active Tem1 molecules that would be sufficient for MEN activation. For this, we took advantage of bfa1Δ bub2Δ cells in which Tem1 binding to the SPBs is greatly reduced compared with WT cells (Figures 2A and 3B), yet mitotic exit is not delayed (Fraschini et al, 1999; Pereira et al, 2000).
As direct tools to visualize Tem1 activity are not established, we followed the SPB localization of the downstream MEN component Mob1 as a timely marker for MEN activation (Luca et al, 2001; Yoshida and Toh-e, 2001; Pereira et al, 2002). SPB binding of Dbf2–Mob1 requires active Tem1 and Cdc15 at the SPBs (Visintin and Amon, 2001). In addition, Dbf2–Mob1 accumulates at the bud neck after the decline of mitotic Cdk1 activity, hence after exit from mitosis (Hwa Lim et al, 2003; Meitinger et al, 2011, 2012). In WT cells, Mob1 localized at the mSPB in early anaphase and to both SPBs during mid-anaphase followed by its accumulation at the bud neck (Frenz et al, 2000; Luca et al, 2001; Yoshida and Toh-e, 2001) (Figure 3D; Supplementary Figure 4A). In the absence of Bfa1–Bub2, Mob1 prematurely localized to both SPBs during metaphase (Pereira et al, 2002) (Figure 3D; Supplementary Figure 4B). However, in both WT and bfa1Δ bub2Δ cells, Mob1 levels peaked at the SPBs when the spindle was 6–7 μm in length, which was 7–8 min before its accumulation at the bud neck (Figure 3D). Interestingly in bfa1Δ bub2Δ cells, when Mob1 reached its highest levels at the SPBs, SPB-bound Tem1 numbers were still low (75 molecules; Figure 3B and D, right panels, note the dashed gray lines as landmarks) and the maximum levels of SPB-bound Tem1 were reached only after Mob1 had accumulated at the bud neck (i.e., after mitotic exit). We therefore concluded that 75 Tem1 molecules at the SPBs are sufficient to promote Dbf2–Mob1 activation in the absence of the GAP complex.
A dynamical model of the SPOC
To analyze the systemic capability of the SPOC to inhibit Tem1 at the SPBs, we developed a dynamical model of the SPOC focusing on the regulation of Tem1 by the GAP complex Bfa1–Bub2 according to the wiring diagram outlined in Figure 4. Details can be found in Materials and methods and in the Supplementary Information. We considered the regulation of Bfa1 to model Bfa1–Bub2 GAP activity because Bfa1 is the regulatory subunit of the GAP complex and its regulation is better understood. We designed our model such that it could reproduce the binding pattern of Bfa1 and Tem1 at the dSPB in both situations, when the SPOC is active, and when it is inactive. To this end, we distinguished between molecules at the dSPB and molecules in the cytosol (Figure 4A), allowing them to exchange with kinetics compatible with previous FRAP analysis (Caydasi and Pereira, 2009). We considered that Tem1 associates with the SPBs in a GAP-dependent (Figure 4C) and -independent manner (Figure 4B). Into this framework, we incorporated a reduced model of the intrinsic GTPase-cycle of Tem1 (Figure 4B; Supplementary Information) together with the acceleration of GTP hydrolysis by the Bfa1–Bub2 GAP complex (Figure 4C) (Geymonat et al, 2002). We accounted for Bfa1 regulation through counteracting phosphorylation by Cdc5 and Kin4. Kin4 is essential for the activation of the SPOC in response to spindle misalignment; hence we used Kin4 to switch between active and inactive SPOC by allowing or disallowing it to phosphorylate Bfa1, respectively (Figure 4A).
Figure 4.

Schematic of the dynamical model. Yellow boxes indicate the SPB compartment. Reactions crossing the compartment boundary represent the reversible SPB association of the respective species or complexes. (A) Regulation of Bfa1 by Kin4, Cdc5 and their opposing phosphatases PPX (likely to be PP2A bound to its Cdc55 subunit (Queralt et al, 2006)) and PPY (so far unknown phosphatase). Reactions marked with an asterisk take place for the respective Bfa1–Tem1 complexes, too. Kin4-mediated phosphorylation reactions depend on spindle misalignment (input signal; encircled ‘S’). Rate coefficients of the reversible Bfa1–SPB association reactions differ with respect to the state of Bfa1. (B) Reduced intrinsic Tem1 GTPase-cycle and reversible SPB association. Tem1 bound directly to the SPB does not interact with Bfa1; however, hydrolysis and nucleotide exchange take place. (C) Interaction of Tem1 with Bfa1. The scheme is repeated for each phosphorylation state of Bfa1, that is, the scheme is repeated three times with all instances of Bfa1* in the scheme replaced by either Bfa1 (‘unphosphorylated’), Bfa1P (phosphorylated by Kin4) or Bfa1P (phosphorylated by Cdc5). GTP hydrolysis by the respective Bfa1–Tem1GTP complexes (dashed arrows) is or is not accelerated depending on the GAP activity of the respective state of Bfa1. (D) Chart summarizing the key properties of the three model variants. Model outcome shows the inhibition of Tem1 sufficiently below the threshold during spindle misalignment and reactivation of Tem1 well above the threshold upon spindle realignment.
An important question we wanted to address in silico was whether the GAP inhibits Tem1 solely at the SPBs or also in the cytosol. Therefore, we modeled both possibilities under two model variants, named as ‘hot-spot-association’ and ‘ubiquitous-association’ models (Figure 4D). In the hot-spot-association variant, binding of Bfa1 and Tem1 takes place exclusively at the SPB. This restriction was removed in the ‘ubiquitous-association model, allowing for cytosolic association of Bfa1 and Tem1 (reactions marked with encircled ‘C’ in Figure 4C). In addition, because it is unclear whether the GAP complex containing unphosphorylated Bfa1 (Bfa1 which is neither phosphorylated by Cdc5 nor by Kin4) is active or inactive in vivo, we made another model variant, namely the ‘ubiquitous-inactive’ variant, to investigate the effect of the activity of unphosphorylated Bfa1 (Figure 4D). The ‘ubiquitous-inactive’ variant considers unphosphorylated Bfa1 to be inactive or inhibited.
Model simulation and analysis
In vivo, Bfa1 and Tem1 levels rapidly decreased at the SPBs upon spindle misalignment (Figure 3E; Supplementary Figure 5, shaded area), whereas they accumulated at the dSPB concomitantly with the establishment of correct spindle alignment during anaphase (Figure 3E; Supplementary Figure 5, after shaded area). To reproduce such behavior in silico, we simulated an arbitrary time period of 60 min in total, starting from an early anaphase state with a misaligned spindle (phosphorylation of Bfa1 by Kin4 switched on). After 30 min, we consider the spindle to align correctly and turn off the SPOC (phosphorylation of Bfa1 by Kin4 switched off) (Figure 5A). The model output shows the levels of Bfa1 and Tem1 in their respective active and inactive states at the SPBs and in the cytosol.
Figure 5.

Model dynamics and cytosolic Bfa1–Tem1 association. (A) Deterministic simulations of ubiquitous-association (i), hot-spot-association (ii) and ubiquitous-inactive (iii) models. Amounts of Bfa1 and Tem1 in active and inactive forms are shown at the SPB and in the cytosol. Simulations start with activation of the SPOC from a metaphase-like state (t=0 min). Vertical lines indicate the time point of proper spindle alignment (t=30 min), resulting in deactivation of the SPOC. Dashed horizontal lines mark the number of active Tem1 molecules at the SPB sufficient for MEN activation. (B) In silico 10-fold overexpression of Bfa1. Asterisk in the left panel indicates that the curves for both model variants coincide. (C) In-vivo overexpression of BFA1. TEM1–GFP Gal1–clb2ΔDB cells containing the LEU2-based multicopy plasmid with or without Gal1–BFA1 were arrested in late anaphase by induction of the Gal1 promoter. Percentage of cells with Tem1–GFP signal at the SPBs was quantified in the presence and absence of BFA1 overexpression.
To evaluate the ability of the model variants to regulate Tem1 activity in response to spindle alignment status, we defined a so-called ‘threshold’ for the SPB-bound Tem1–GTP level that is certainly sufficient for initiation of MEN signaling. The landmark was based on the aforementioned number of Tem1 molecules at the SPBs in bfa1Δ bub2Δ cells (75 molecules) (Table I). Through analysis of a mathematical model of the intrinsic Tem1 GTPase-cycle, we estimated that 86% of the total Tem1 amount would be bound to GTP if no GAP were present (see Supplementary Information). We therefore set the threshold to 65 molecules (0.86 × 75) of Tem1–GTP at the SPB (Figure 5A; Supplementary Figure 6, the horizontal dashed line in the plots of the Tem1 level at the SPB). Thus, 65 molecules of Tem1–GTP served as a safe landmark for the SPB-bound Tem1–GTP levels that is capable of triggering the MEN cascade and help us to discriminate between different model variants. Ideally, a model must maintain the level of Tem1–GTP well below 65 molecules if the SPOC is active, and allow rapid recovery of Tem1–GTP to the level of or above this threshold upon deactivation of the SPOC to initiate MEN signaling.
Tem1 interacts with Bfa1 in the cytosol and at the SPBs
In the ubiquitous-association model in which Tem1 and Bfa1 can interact both at the SPB and in the cytosol, Bfa1 becomes rapidly activated and depleted from the SPB in response to spindle misalignment (Figure 5Ai, orange areas). Tem1 level decreases at the SPB along with Bfa1 and at the same time inactive Tem1 predominates in the cytosol as well as at the SPB (Figure 5Ai, red areas). The amount of remaining GTP-bound Tem1 is well below 65 molecules at the SPB (horizontal dashed lines in Figure 5A); hence we consider the inhibition of mitotic exit to be reliable. Because of the discrete and stochastic nature of chemical reactions, considerable intrinsic noise can be present if the molecule numbers are low. Thus, we employed a discrete stochastic simulation method (Gillespie, 1976) to assess the robustness of the checkpoint response with respect to intrinsic noise. In fact, even when the intrinsic noise is considered, SPB-bound active Tem1 stays well below the threshold value (Supplementary Figure 6A, t<30 min). After spindle realignment, Bfa1 and Tem1 accumulate at the SPB and reach the desired levels. However, active Tem1 accumulates slowly, reaching the defined threshold at the SPB about 30 min after spindle realignment (Supplementary Figure 6A, t>30 min).
In the hot-spot-association model, which restricts Tem1–Bfa1 association to the SPB, the dynamics of the total SPB-bound Bfa1 and Tem1 levels at the SPB are virtually the same as in the ubiquitous-association model (Figure 5Aii). The deterministic and stochastic simulations show that during spindle misalignment, the level of SPB-bound Tem1–GTP cannot be reduced below the threshold sufficient to activate MEN (Figure 5Aii; Supplementary Figure 6B, t<30 min). Thus, the ubiquitous-association model is insufficient to inhibit Tem1 upon checkpoint activation. On the other hand, active Tem1 accumulates rapidly at the SPB after spindle realignment, reaching about 84% of the total SPB-bound Tem1, which is close to the theoretical limit of 86% in the absence of the GAP (Figure 5Aii; Supplementary Figure 6B, t>30 min).
We next tested the two models in vivo. BFA1 overexpression in silico resulted in reduced Tem1 levels at the SPB in the ubiquitous-association model while Tem1 levels were elevated in the hot-spot-association model (Figure 5B). When we overexpressed BFA1 in vivo, SPB-bound Tem1 decreased in the majority of the cells supporting the ubiquitous-association model and excluding the hot-spot-association model (Figure 5C). Taken together, the ubiquitous-association model is able to reproduce the Tem1 SPB-binding behavior observed in vivo upon BFA1 overexpression, as well as providing sufficient Tem1 inhibition during the checkpoint response. It is also worth mentioning that even if the Tem1–GTP threshold were lower than 65 molecules, the ubiquitous-association model would be valid, while the hot-spot-association model would still fail to inhibit Tem1 upon SPOC activation. Thus, our in-silico analysis strongly suggests that cytoplasmic Bfa1–Tem1 interactions are essential for SPOC proficiency.
The ubiquitous-association model provides sufficient Tem1 inhibition during spindle misalignment; however, the recovery of active Tem1 upon spindle realignment is rather slow. Slow recovery in the ubiquitous-association model is a consequence of the slow deactivation of cytosolic Bfa1 by Cdc5, which is limited by the turnover of Bfa1 at the SPBs. We thus resimulated the ubiquitous-association model, yet assuming that unphosphorylated Bfa1 is inactive or inactivated upon spindle realignment (Figure 5Aiii). This new model variant, namely the ubiquitous-inactive model, exhibits the same strong Tem1 inhibition as the ubiquitous-association model. In addition, it shows rapid accumulation of active Tem1 at the SPB after spindle realignment, indicating that an additional Bfa1 inhibitor can significantly improve Tem1–GTP recovery. The superior properties of this variant are also reflected in the stochastic simulations as the inhibition and the recovery of Tem1 are rapid and robust (Supplementary Figure 6C). Taken together, the ubiquitous-inactive model combines the reliable Tem1 inhibition from the ubiquitous-association model with rapid Tem1–GTP recovery upon checkpoint deactivation.
Robustness of the ubiquitous-association and ubiquitous-inactive models to perturbations of the GDP-dissociation rate
The ability of our models to regulate Tem1 activity is largely dependent on the GDP-dissociation rate coefficient of Tem1 (see Supplementary Information). To assess the robustness of the ubiquitous-association and ubiquitous-inactive models to perturbations of the GDP-dissociation rate, the ability of both models to inhibit Tem1 upon spindle misalignment (‘relative inhibition’) and to activate Tem1 upon spindle realignment (‘relative recovery’) are examined for a range of GDP-dissociation rate coefficients (Figure 6A). In terms of relative inhibition, both models behave similarly and require a low GDP-dissociation rate coefficient to allow inhibition of Tem1 below the levels sufficient for MEN activation (Figure 6A, red curves). In contrast, GDP-release must be significantly faster in the ubiquitous-association model to reach the same relative recovery as the ubiquitous-inactive model (Figure 6A, green curves). SPOC can only work reliably if both inhibition and recovery are sufficient. Thus, we combined the relative inhibition and recovery into the ‘quality level’, which is zero if at least one of the two criteria (relative inhibition and recovery) is not satisfied. The quality level can only be high if both relative inhibition and recovery are high. Importantly, the quality level of the ubiquitous-inactive model is higher and covers considerably wider range of GDP-dissociation rates than the ubiquitous-association model (Figure 6B, dark blue curves).
Figure 6.

Comparison of ‘ubiquitous-association’ (solid curves) and ‘ubiquitous-inactive’ (dashed curves) models with respect to the regulation of Tem1–GTP at the SPB as a function of the GDP-dissociation rate coefficient. The GDP-dissociation rate coefficient was scanned in the range from 0.001 to 100 s−1, assuming a fold-acceleration by the GAP of λ=103 (see Materials and methods). For each parameter value, both models were simulated and the respective levels of Tem1–GTP were recorded at time points t=30 min and t=40 min (i.e., 30 min after SPOC activation and 10 min after subsequent spindle realignment). From these data, relative inhibition (red) and recovery (green) of Tem1, quality level (dark blue) and dynamic range of the checkpoint response (light blue) were computed. Vertical lines indicate the one-fold (dashed) and five-fold (solid) of the GDP-dissociation rate constant measured by (Geymonat et al, 2002). Refer to the main text for details. (A) Relative inhibition and recovery of Tem1 as percentage of the theoretical limit. (B) Quality level and dynamic range as percentage of the theoretical limit.
For robust checkpoint response, a clear distinction between the checkpoint active and inactive states is desirable. As a measure of robustness, we computed the ‘dynamic range’ of the checkpoint response (Figure 6B, light blue curves). The dynamic range shows how distinct the SPOC active and inactive states are in terms of SPB-bound active Tem1 amounts. Interestingly, the dynamic range of the ubiquitous-inactive model is identical or higher than the dynamic range of the ubiquitous-association model for all parameter values scanned. The maximum dynamic range of the ubiquitous-inactive model is reached near the maximal quality level of this model. In contrast, the maximum quality level of the ubiquitous-association model lies in a region of only moderate dynamic range. Importantly, quality level of the ubiquitous-inactive model is maximal for GDP-dissociation rate coefficients close to our estimated nominal value of 0.017 s−1 (vertical solid lines in Figure 6). Collectively, our analysis shows that the ubiquitous-inactive model is more robust against perturbations of the Tem1 GDP-dissociation rate.
Discussion
Spatial and temporal control of mitotic exit requires elaborate regulatory mechanisms involving differential phosphorylation and binding to subcellular compartments. Although it is simple to capture single component behavior, integration of all the behaviors in a global network has so far been missing. Here, we assembled the reactions related to the GAP (Bfa1–Bub2) and the GTPase (Tem1) into a compartmentalized dynamical model of the SPOC. Our model captured the observed protein behavior and furthermore provided in-silico evidence that cytoplasmic regulation of Tem1 by the GAP complex is critical for robust checkpoint arrest. We therefore anticipate that, although SPOC and MEN proteins accumulate at the SPBs and this location is undoubtedly important for MEN signaling, contribution of the cytoplasmic pools to the regulation of SPOC and MEN components should not be underestimated.
A quantitative approach to study SPOC
The lack of quantitative data and the goal of building a dynamical model of the SPOC led us to determine the amounts of SPOC components at the SPBs. We observed that Tem1 binding to the SPBs did not exactly follow the SPB binding of Bfa1–Bub2. First, Tem1 was less asymmetric than Bfa1–Bub2 at the SPBs during normal spindle alignment. Second, there was more Tem1 than Bfa1–Bub2 at the SPBs when the anaphase spindle was misaligned. The latter was somehow surprising because Tem1 was thought to be reduced at the SPBs to the same extent as Bfa1–Bub2 during spindle misalignment (Bardin et al, 2000; Pereira et al, 2000; Molk et al, 2004). Our data suggested that the discrepancy between Tem1 and Bfa1 SPB-binding patterns might arise from the Tem1 pool that associates with the SPBs in a GAP-independent manner. Importantly, quantitative time-lapse analysis indicated that GAP-independent and GAP-dependent Tem1 pools coexist throughout mitosis in WT cells. This conclusion is also in concordance with the biphasic recovery curve obtained from the FRAP analysis of SPB-associated Tem1–GFP (Molk et al, 2004). How Tem1 binds to the SPBs independently of the GAP complex and how this pool is regulated are currently not clear. Yet, the SPB outer plaque component Nud1, which serves as a scaffold protein for the GAP complex, is also likely to be the receptor for the Tem1 GAP-independent pool (Gruneberg et al, 2000; Valerio-Santiago and Monje-Casas, 2011).
One of the major difficulties in understanding when MEN is activated arises from the lack of an in-vivo tool to discriminate between Tem1–GTP and Tem1–GDP. In Schizosaccharomyces pombe, antibodies raised against the GDP-bound form of the Tem1-homolog Spg1, allowed monitoring of the inactive Spg1 in vivo (Sohrmann et al, 1998). However, so far no reagents have been established to differentiate between active and inactive Tem1 species in budding yeast, and although Tem1 can be replaced by Spg1, the Spg1-antibodies failed to work in budding yeast (unpublished observation of GP). Our model was therefore designed to provide the ratio of GTP and GDP-bound Tem1. However, for the evaluation of the checkpoint proficiency in the model, it was essential to set a critical level of SPB-bound Tem1–GTP sufficient for MEN activation. In the search for such a landmark, we looked for a situation where Tem1 levels at the SPBs were low and still mitotic exit occurred without a delay. bfa1Δ bub2Δ cells were excellent candidates as they met those two criteria. Tem1 levels at the SPBs of bfa1Δ bub2Δ cells (GAP-independent Tem1) were low during metaphase and increased through anaphase. Although this behavior was described before, it was unclear whether the increase happened before or after mitotic exit. Through careful analysis of fluorescence time-lapse data, we showed that the GAP-independent Tem1 was low until mid-anaphase, increased through telophase and reached a maximum after mitotic exit. Monitoring of Mob1–GFP localization as a marker for cell-cycle progression led us to the conclusion that the threshold for Tem1 activation is already matched during metaphase–early anaphase in these cells, strikingly when the SPB-bound Tem1 levels were still low. Indeed, this also reflected the precocious localization of Cdc15, Mob1 and Dbf2 to the SPBs and premature activation of the Dbf2 kinase activity (Fesquet et al, 1999; Pereira et al, 2000; Visintin and Amon, 2001). However, it is likely that because Cdc15 and Dbf2–Mob1 SPB localization is also enhanced by Cdc5 and early anaphase released Cdc14, Mob1 increases at the SPBs of bfa1Δ bub2Δ cells in a similar manner to WT cells, independently of Tem1 (Jaspersen and Morgan, 2000; Konig et al, 2010; Rock and Amon, 2011). As a consequence, in the absence of the GAP complex mitotic exit occurs in time, indicating that inhibition of Tem1 is not necessary in an unperturbed anaphase (Fraschini et al, 1999; Pereira et al, 2000). The importance of the increase in the GAP-independent SPB-bound pool of Tem1 is however still puzzling. Considering that its maximum levels are reached after mitotic exit, one can speculate that Tem1 might have another function at the SPBs after activation of MEN.
SPOC model
The SPOC model captured the localization of Bfa1 and Tem1, and further allowed for analysis of the ratio of active and inactive GAP and GTPase amounts at the SPBs. Using the aforementioned Tem1–GTP threshold as a marker together with the results of deterministic and stochastic simulations, we were able to infer on the SPOC proficiency in silico. Our model predicts two important phenomena about regulation of Tem1 and Bfa1. First, robust checkpoint arrest is only achieved if Tem1 inhibition takes place in the cytoplasm and at the SPBs. This was a consequence of the Tem1 pool that binds to the SPBs in a GAP-independent manner. This pool cannot be inhibited by the GAP if the association of the GAP and GTPase is restricted to the SPBs (Figure 7, left). However, Tem1 binds to the GAP-independent binding site with a certain turnover that allows for exchange between the cytosolic and the SPB-associated pools (Caydasi and Pereira, 2009). Therefore, when cytosolic GAP and GTPase association was allowed, the GAP-independent Tem1 pool could be inhibited by cytoplasmic GAP complexes (Figure 7, right). Cytoplasmic interaction of Bfa1 and Tem1 was also supported by an in-vivo experiment where high cellular levels of Bfa1 titrated Tem1 from the SPBs. Again, this experiment could be reproduced in silico only when the cytosolic Bfa1–Tem1 interaction was considered.
Figure 7.

Tem1 inhibition in the cytoplasm improves Tem1 inhibition at the SPB. Tem1 undergoes an intrinsic GTPase-cycle (bent arrows), resulting in a balance between Tem1 active (Tem1–GTP) and inactive (Tem1–GDP) states. The active GAP complex Bfa1–Bub2 binds to Tem1 and shifts the balance effectively towards Tem1–GDP. Tem1-association with the SPB can be compared with a vessel (‘cytosol’) with two chambers connected by a narrow tube. The chambers represent the GAP-dependent (bottom) and GAP-independent (top) Tem1 pools. If association of Bfa1 and Tem1 is spatially restricted to the bottom chamber like in the hot-spot-association model (left), the balance is affected only locally due to the narrow passage to the cytosol. Because Bfa1 does not affect Tem1 in the top chamber, the balance there is the same as in the cytosol. If Bfa1 can additionally associate with Tem1 in the cytosol, which is the situation in the ubiquitous-association and ubiquitous-inactive models (right), the balance in the cytosol is affected, too. Because the inflow into this chamber is then dominated by inactive Tem1, the concentration in the small chamber shifts towards inactive Tem1 despite the absence of the GAP complex. The outflow of active Tem1 in turn hardly affects the cytosol due to the huge difference of the volumes.
Second, rapid activation of Tem1 upon spindle realignment in silico could be achieved when unphosphorylated Bfa1 (Bfa1 which is not phosphorylated by Kin4 or by Cdc5) was considered to be inactive or inactivated by additional mechanisms parallel to Cdc5. Cdc5-phosphorylated Bfa1 accumulates slowly in the cytoplasm during normal spindle alignment, as Cdc5 phosphorylates only the SPB-bound Bfa1 (Maekawa et al, 2007) and the turnover rate of Bfa1 at the SPB limits the amount released into the cytoplasm (Caydasi and Pereira, 2009). Therefore, unphosphorylated Bfa1 needs to be inhibited especially if the anaphase spindle is normally aligned. According to the previous reports, Bfa1-11A mutant that cannot be phosphorylated by Cdc5 is sufficient to provide SPOC arrest even in the absence of Kin4; suggesting that unphosphorylated Bfa1 is active if the spindle is misaligned (Pereira and Schiebel, 2005). However, the same mutant does not promote a mitotic arrest if the anaphase spindle is normally aligned; implying that unphosphorylated Bfa1 is not fully active in this case (Hu et al, 2001). Thus, it is possible that GAP complexes containing unphosphorylated Bfa1 need to be inactivated by yet unknown mechanisms whenever correct spindle alignment is achieved. In fact, there is evidence that one of the effectors of Cdc42, Gic1/2, inhibits the interaction of Bfa1–Bub2 with Tem1 (Hofken and Schiebel, 2004). It is therefore conceivable that Gic1/2 inhibits Bfa1–Bub2 GAP activity towards Tem1 by preventing GAP–GTPase interaction upon dSPB entrance into the bud. Alternatively, additional regulation might be at the level of Bub2 as it is also subject to phosphorylation (Hu and Elledge, 2002). Thus, several regulatory layers might contribute to GAP inactivation in addition to the well-established Bfa1–Cdc5 branch.
Previously, two possible mechanisms were suggested to explain how the GAP Bfa1–Bub2 might inhibit the GTPase Tem1 during spindle misalignment. One of them highlighted the importance of Bfa1–Bub2 redistribution from the SPBs into the cytoplasm where the GAP is kept away from its inhibitor Cdc5 and inactivates Tem1 in the cytoplasm (Caydasi and Pereira, 2009). The other mechanism focused on exclusion of Tem1 from the SPBs together with Bfa1 because Tem1 localization is mainly dependent on Bfa1–Bub2; and Tem1 SPB localization is essential for mitotic exit (Pereira et al, 2000; Monje-Casas and Amon, 2009; Valerio-Santiago and Monje-Casas, 2011). These two mechanisms are not mutually exclusive and probably both are important for inhibition of Tem1. Indeed, because SPB-bound Tem1 level is higher than the calculated threshold during spindle misalignment, removal of Tem1 from the SPBs cannot be the only way for blocking mitotic exit, but the activity of the GAP is required as well. Our dynamical SPOC model greatly supports the necessity of Tem1 inhibition in the cytoplasm as well as at the SPBs to achieve minimum levels of Tem1–GTP at the SPBs.
We propose that SPOC translates the information about spindle orientation into Bfa1–Bub2 activity, which in turn transmits a ‘WAIT’-signal throughout the cytosol. This mechanism might be analogous to the spindle assembly checkpoint (SAC; reviewed in Musacchio and Salmon, 2007), which senses spindle attachment at individual kinetochores and broadcasts a nucleoplasmic ‘WAIT’-signal from kinetochores until proper attachment is established. Modeling of SAC helped to pinpoint advantages and problems of putative regulatory mechanisms (Doncic et al, 2005; Sear and Howard, 2006; Ibrahim et al, 2008; Simonetta et al, 2009). Similarly, we anticipate that mathematical modeling of SPOC will serve as a basis to integrate future findings and evaluate novel hypothesis related to checkpoint architectures and regulation.
Materials and methods
Strains and growth conditions
Strains and plasmids used in this study are listed in Supplementary Table 1. All yeast strains used are isogenic with S288C. Basic yeast methods and growth media were as described (Sherman, 1991). PCR-based methods were used for gene deletions and epitope tagging of the genes (Knop et al, 1999; Wiedenmann et al, 2002; Janke et al, 2004). For fluorescence time-lapse microscopy, cells were cultured in filter sterilized synthetic media. For analysis of Tem1 localization upon BFA1 over expression, cells were grown in filter sterilized synthetic media without leucine to select for the LEU2-based Gal1-multicopy plasmid. Media contained raffinose (3%) as the whole carbon source to avoid induction of the Gal1 promoter. Then, galactose (2%) was added to log-phase culture and incubated at 30°C for 3 h before analysis.
Fluorescence microscopy
For fluorescence signal intensity quantification, cells grown in filter sterilized synthetic media were adhered on small glass-bottom Petri dishes (MatTek) using 6% concanavalin A-Type IV. Images were acquired at 30°C using a Deltavision RT system (Applied Precision, USA) on an Olympus IX70 inverted microscope with a × 100 oil immersion objective ( × 100/1.40 UPLS Apo, UIS2), a CCD camera (CoolSNAP HQ/ICX285 Photometrics) and softWoRx software (Applied Precision, USA). FITC and RD-TR-PE excitation/emission filter sets were used to detect GFP and eqFP/mCherry respectively. In all, 19 z-stack images were acquired with an optical section spacing of 0.2 μm and 1 × 1 binning. Images of all z-stacks were first taken in GFP and then in eqFP channel with 0.2 s exposure time for both wavelengths. Time-lapse experiments were performed and analyzed as described previously (Caydasi and Pereira, 2009). Briefly, 12 z-stacks (2 × 2 binning) of 3 μm section spacing were taken for each time lapse with 1-min time interval for 1 h at 30°C. Signal intensities were corrected for the background and the acquisition bleaching. An average graph for each POI was obtained by aligning the time-lapse data from individual cells according to the pole–pole distances, where the start of spindle elongation was set as a reference time point.
For BFA1 overexpression experiment, still images were taken without fixation of the cells, using a Zeiss Axiophot microscope (Carl Zeiss MicroImaging, Inc.) equipped with a × 100 NA 1.45 Plan-Fluar oil immersion objective (Carl Zeiss MicroImaging, Inc.), an EMCCD camera (Cascade:1K; Photometrics) and Metamorph software. In all, 12 z-stack series of 0.3 μm steps were captured in GFP channel with 1 × 1 binning and 0.2 s exposure time. Z-stacks were sum-projected using Image J software.
Quantification of fluorescence intensities
For each set of experiment, we took images of a mixture of cells including the cells without any fluorescent tag, and cells with Nuf2–GFP signal. The mixture also contained the cells with GFP-tagged POI (Bfa1–GFP, Bub2–GFP or Tem1–GFP) and Spc42–eqFP as a reference for cell type determination. Only anaphase cells (distance between the SPBs >3 μm) were considered for quantification.
Acquired z-stacks were sum-projected using the SoftWoRx software and mean fluorescence intensities were measured using Image J (NIH) software mean gray value calculation tool. The size of the ROI (region of interest) was 0.644 μm2 (156 pixels) for the SPBs and kinetochore clusters. For whole-cell fluorescence measurements, the borders of the cells were drawn according to the whole-cell fluorescence in the GFP channel, using image J polygon selection tool. The size of the ROI for whole-cell fluorescence was 28±3 μm2 (mean±s.d.). Background fluorescence intensity (IBG) was determined by measuring an area free of cells but close by the ROI. Fluorescence intensity of the cells without any fluorescent tag was also measured (I0) and corrected for the background (I0,corrected=I0/IBG−1). Correction of the ROI fluorescence intensity (IROI) was done according to  is the mean of the corrected fluorescence intensity of the cells without any fluorescent tag.
Estimation of the Tem1, Bfa1 and Bub2 number of molecules at the SPBs
To estimate the distributions of the molecule numbers, we consider the normalized fluorescence intensities of our reference protein Nuf2 and the POI to be samples of the independent random variables XNuf2 and XPOI. We fit these samples to skewed normal distributions with probability density functions pNuf2 and pPOI. The molecule number distribution of the POI is then given by  where NNuf2=352 is the number of Nuf2 molecules per kinetochore cluster. We approximate this distribution by computing (x/y)NNuf2 from large random samples (x, y) generated according to the distributions given by pNuf2 and pPOI.
Estimation of the total cellular molecular numbers of proteins
We calculated the number of protein molecules per cell by taking the predetermined SPB bound known number of molecules as a reference and using the following formula:
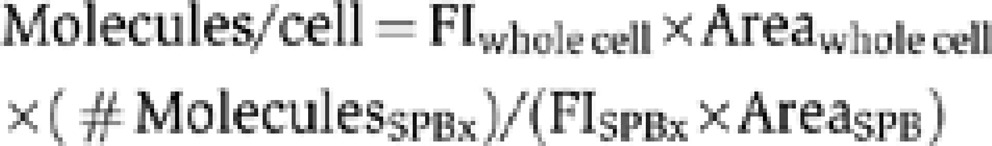 |
Where; AreaSPB is 0.644 μm2, Areawhole cell is 28 μm2, FIwhole cell is the median value of mean whole-cell fluorescence intensities from Supplementary Figure 2C (Nuf2 versus Bfa1, Bub2 and Tem1), FISPBx is the median value of the mean fluorescence intensities at the SPBs from Supplementary Figure 1C and #MoleculesSPBx is the SPB-bound number of molecules presented in Table I and Figure 1A and C.
In this way, number of Bfa1 molecules per cell was calculated as 1374±292, which is similar to the published value (1380 molecules per cell) by (Ghaemmaghami et al, 2003). In the same way, Bub2 and Tem1 number of molecules per cell was found to be 1395±123 and 3787±291, respectively. Because Bfa1 and Tem1 ratios were particularly important for our model, we compared their whole-cell protein amounts more carefully (Supplementary Figure 2C, Tem1 versus Bfa1). We found that Tem1 amounts were ∼2.5-fold higher than that of Bfa1. Considering 1374 Bfa1 molecules per cell on average, this gave rise to 3435 (1374 × 2.5) molecules of Tem1 per cell, which is similar to the number of molecules per cell calculated above.
Conversion of the ‘fluorescence intensity versus time’ time-lapse curves to ‘number of molecules versus time’ curves
Once the average number of SPB-bound proteins were determined using the ‘protein–GFP/Nuf2–GFP’ system (see Table I for molecule numbers in anaphase cells), we used these protein numbers as a reference to convert the fluorescence intensity profiles (from the time-lapse analysis) into the number of molecules profiles. We considered that the average fluorescence intensity of a protein-fluorophore curve at each SPB (Figure 2B and D) correlates with the number of molecules of the same protein at each SPB (Table I). In the case of conversion of the Bfa1–3mCherry fluorescence time-lapse curve into number of molecules profile, we made the basic assumption that number of molecules of Bfa1–mCherry is equal to the number of molecules of Bfa1–GFP. In addition, SPB-binding profile of Bfa1–3mCherry was not different than Bfa1–GFP during mitosis (Figure 2B; Caydasi and Pereira, 2009).
More specifically, we first determined the median of anaphase fluorescence intensities for the graphs shown in Figure 2B considering all time points where the pole-to-pole distance was larger than 3 μm (excluding time points after spindle breakdown). For each protein species (Bfa1, Tem1) we obtained two median fluorescence intensity values, one for the dSPB and one for the mSPB. These values were plotted versus the corresponding mean anaphase protein amounts reported in Table I. We fitted a linear trendline for the plotted points using Microsoft Excel software and obtained the Equation of the trendline. The Equation was later used for conversion of the fluorescence intensities at each time point of the time-lapse curve into number of molecules. Note that for the conversion of Tem1–GFP bfa1Δ bub2Δ time-lapse curve (Figure 2B) we differentiated between the early and late anaphase fluorescence intensities. Likewise, in case of spindle misalignment during the time lapse (i.e., kar9Δ cells; Supplementary Figure 5) we also included the corresponding fluorescence intensity and the number of molecules during spindle misalignment as separate data points and added the linear trendline accordingly.
Mathematical model and simulation
The wiring diagram of the SPOC mechanism (Figure 4) was translated into reaction Equations (see Supplementary Information), which were then translated into a set of coupled ordinary differential Equations (ODEs; see Supplementary Information) under the assumption of mass action kinetics for all reactions. The ODEs were implemented in matlab (MathWorks) and integrated using its built-in solver ode15s. Parameters and initial conditions are given in the Supplementary Information. To obtain absolute levels of Bfa1 and Tem1 for comparison with our experimental data, we convert the individual variables from concentrations to particle numbers and sum them up appropriately (see Supplementary Information). Stochastic simulations were carried out using a custom implementation of the stochastic simulation algorithm (SSA) (Gillespie, 1976) in matlab. Sample mean and standard deviation were then computed from ensembles of 200 individual trajectories.
SBML (Systems Biology Markup Language) files of all three models have been submitted to the BioModels database ( http://www.ebi.ac.uk/biomodels-main/) with accession numbers MODEL1202090001, MODEL1202090002 and MODEL1202090003.
Model kinetics and parameterization
Binding reactions
We used reversible mass action kinetics for all binding reactions. These reactions introduce two kinetic parameters: a first-order dissociation rate coefficient, and a second-order association rate coefficient. Coefficients of equivalent binding reactions were lumped together. For instance, we assumed that binding of Bfa1 to the SPB occurs with the same kinetics regardless of whether Bfa1 is bound to Tem1 or not. In contrast, binding kinetics was considered different for Bfa1 that was phosphorylated by Kin4. Reactions considered kinetically equivalent are listed in Supplementary Information along with every rate coefficient.
We estimated the rate coefficients for Bfa1 dissociation from the SPB according to the formula koff=(ln 2)/t1/2, in which the mean residency times t1/2 were taken from (Caydasi and Pereira, 2009). Tem1 turns over at the SPB much faster than Bfa1 (Caydasi and Pereira, 2009). Because Bfa1 constitutes a large fraction of the Tem1-binding sites at the SPB, the rate coefficient for Bfa1 dissociation from the SPB is also considered as the rate coefficient of the Bfa1–Tem1 complex dissociation from the SPB. The respective association rate coefficients were manually adjusted such that the steady-state amounts of SPB-bound Bfa1 and Tem1 matched our measurements.
GTPase-cycle
We modeled the intrinsic GTPase-cycle of Tem1 by two antagonistic first-order reactions, which were derived from a more detailed model of the GTPase-cycle (refer to Supplementary Information for the derivation and definitions of all parameters with respect to the GTPase-cycle, see also Supplementary Figures 8 and 9). The transition from Tem1–GTP to Tem1–GDP is characterized by the effective rate coefficient khydλ=pGDP koffT+λkcat, which combines GTP hydrolysis and exchange of bound GTP for GDP. Similarly, exchange of GDP for GTP is characterized by the effective rate coefficient knex=pGTP koffD. The quantities pGDP=0.2 and pGTP=0.8 reflect the probabilities of the nucleotide-free GTPase to bind either GDP or GTP and depend on the intracellular concentrations and affinities for the respective nucleotides. The rate coefficients of GTP hydrolysis (kcat=0.002 s−1) and GTP-release (koffT=0.0012, s−1) of Tem1 were taken from in-vitro measurements performed at 30°C (Geymonat et al, 2002). The GDP-dissociation rate coefficient of Tem1 (koffD) was assumed to be 0.017 s−1. This value is similar to the GDP-dissociation rate of the homolog of Tem1 in S. pombe (Spg1) measured at 30°C and is about five times higher than the measured GDP-dissociation rate of Tem1 at 14°C (Furge et al, 1998; Geymonat et al, 2002). We used the dimensionless fold-acceleration λ to accommodate accelerated hydrolysis of Tem1–GTP through interaction with the GAP complex Bfa1–Bub2 (which is in our model represented by Bfa1 for brevity). GDP-release is the most sensitive undetermined parameter in our model of the GTPase-cycle with respect to the steady-state Tem1–GTP level, and similarly the fold-acceleration λ is highly important for the inactivation of Tem1 in our SPOC models. Therefore, we simulate the models with GDP-release rate coefficients and fold accelerations in a range spanning five orders of magnitude as described in the ‘Parameter scans’ section below. From these scans we selected the fold-acceleration λ=103, such that a further increase would have only subtle influence on the dependency of all model variants on the GDP-release rate coefficient (Supplementary Figure 7). This fold-acceleration and the resulting effective rate coefficient for GAP-accelerated GTP hydrolysis khydGAP=2 s−1 are well within the reported limits of GTP hydrolysis by Ras in the presence of RasGAP (Gideon et al, 1992). Then robustness of the model variants with respect to GDP-release can be evaluated by considering the scan of the GDP-release rate coefficient alone.
Phosphorylation and dephosphorylation of Bfa1
Given that no kinetic data are available for phosphorylation of Bfa1 by Kin4 and Cdc5, we modeled these reactions by pseudo first-order processes to introduce the least amount of complexity. We manually adjusted the characterizing rate coefficients for the phosphorylation reactions at the SPB (Figure 4A) considering that (1) phosphorylation by Cdc5 is fast enough such that not the phosphorylation rate per se, but the turnover rate of Bfa1 at the SPB limits the amount of Bfa1, which can be phosphorylated by Cdc5 per unit time and (2) phosphorylation by Kin4 is significantly faster than Cdc5 to allow for suppression of further phosphorylation of Bfa1 by Cdc5. The rate coefficients for dephosphorylation of Bfa1 by unknown phosphatases can be interpreted as the inverse of the expected lifetime of the respective phosphorylated state. The lifetime of the Kin4-phosphorylated state was chosen such that the steady state is approached within the first 30 min after SPOC deactivation. The lifetime of the Cdc5-phosphorylated state was set to a similar value if the SPOC is active; however, in checkpoint active state, the model is insensitive to this parameter because in this case phosphorylation through Kin4 prevents phosphorylation by Cdc5. In contrast, dephosphorylation of Cdc5 is turned off upon SPOC deactivation to allow for accumulation of this phosphoform during anaphase.
Parameter scans
We simulated the model variants deterministically as described above with the Tem1 GDP-dissociation rate coefficient and the fold-acceleration of GTP hydrolysis by the GAP varied in a wide range koffD∈[10−3, 102 s−1] and λ∈[1, 104 s−1], respectively (see previous section and Supplementary Information). All other parameters remained at their nominal values. For every combination of parameter values for koffT and λ we recorded:
the number of Tem1–GTP molecules remaining at the SPB at t=30 min (x 30)
the number of Tem1–GTP molecules accumulated at the SPB at t=40 min (x 40)
Furthermore, we defined the constants xMEN=65 molecules and xmax=255 molecules. Here, xMEN is the threshold of Tem1–GTP at the SPB that is sufficient for MEN activation and xmax is the total amount of Tem1 at the SPB that is reached in steady state in all models. Thus, xmax is an upper bound of the level of Tem1–GTP at the SPB at t=40 min. Importantly, xMEN and xmax are independent from the scanned parameters and models.
Relative inhibition and recovery
From the recorded Tem1–GTP levels (x30 and x40), we computed the relative inhibition (I) and recovery (R), which we defined as I=max{0, 1−x30/xMEN} and R=max{0, (x40−xMEN)/(xmax−xMEN)} and, respectively. Relative inhibition measures the reduction of the SPB-bound Tem1–GTP below the threshold (xMEN) 30 min after SPOC activation. Similarly, relative recovery measures the increment of SPB-bound Tem1–GTP above the threshold (xMEN) 10 min after SPOC deactivation.
Quality level
We computed the quality level of the checkpoint response (Q) based on the relative inhibition (I) and recovery (R). We defined the quality level to be the minimum of both criteria (Q=min{I, R}). The quality level combines relative inhibition and recovery into a more rigorous measure: If one of relative inhibition or recovery is not sufficient, the quality level of the parameter combination is zero. Low-quality levels indicate that either inhibition or recovery (or both) is barely sufficient, whereas a quality level of 1 would mean that both inhibition and recovery are maximal.
Dynamic range
We defined the dynamic range as DR=(x40−x30)/xmax. A high dynamic range is desirable because this property implies robustness of the checkpoint response. It is important to note that low-quality levels can be associated with high dynamic ranges. This is particularly pronounced if low quality is a consequence of poor inhibition of Tem1, due to the asymmetry of maximal inhibition and maximal recovery in terms of absolute molecule numbers, which is hidden in the normalized measures I and R. The dynamic range complements the nonlinear quality level with a linear measure of robustness.
Supplementary Material
Supplementary figures S1-9, Supplementary tables S1-5
Acknowledgments
We acknowledge K Bloom for sharing unpublished data; M Geymonat and SG Sedgwick for providing original data; Elmar Schiebel, Victor Sourjik, Anton Khmelinskii, Franz Meitinger, Fouzia Ahmad and Peter Kreyssig for critically reading the manuscript; Pereira and Dittrich lab members for comments and discussions. This work was supported by the Helmholtz Association Grant HZ-NG-111 and DFG grant PE 1883-1/1 granted to GP. AKC is funded by a DKFZ-ZMBH postdoctoral fellowship. ML is a fellow of the international DKFZ PhD program. The work of BI was funded by the Helmholtz Association Grant HZ-NG-111 and priority program InKoMBio (SPP 1395). PD and GG are supported by the NEUNEU project (248992) sponsored by the European Community.
Author contributions: GP and BI supervised and coordinated the study. AKC designed and performed the laboratory-based experiments and corresponding data analysis. ML computed the conversion of fluorescence intensity distributions into number of molecules distributions. ML and BI performed the modeling and in-silico simulations. AKC and ML designed and prepared the figures. AKC and ML wrote the manuscript with critical input of GP and BI. PD and GG contributed to the modeling and commented on the manuscript.
Footnotes
The authors declare that they have no conflict of interest.
References
- Asakawa K, Yoshida S, Otake F, Toh-e A (2001) A novel functional domain of Cdc15 kinase is required for its interaction with Tem1 GTPase in Saccharomyces cerevisiae. Genetics 157: 1437–1450 [DOI] [PMC free article] [PubMed] [Google Scholar]
- Bardin AJ, Visintin R, Amon A (2000) A mechanism for coupling exit from mitosis to partitioning of the nucleus. Cell 102: 21–31 [DOI] [PubMed] [Google Scholar]
- Bertazzi DT, Kurtulmus B, Pereira G (2011) The cortical protein Lte1 promotes mitotic exit by inhibiting the spindle position checkpoint kinase Kin4. J Cell Biol 193: 1033–1048 [DOI] [PMC free article] [PubMed] [Google Scholar]
- Casamayor A, Snyder M (2002) Bud-site selection and cell polarity in budding yeast. Curr Opin Microbiol 5: 179–186 [DOI] [PubMed] [Google Scholar]
- Caydasi AK, Ibrahim B, Pereira G (2010a) Monitoring spindle orientation: spindle position checkpoint in charge. Cell Division 5: 28. [DOI] [PMC free article] [PubMed] [Google Scholar]
- Caydasi AK, Kurtulmus B, Orrico MI, Hofmann A, Ibrahim B, Pereira G (2010b) Elm1 kinase activates the spindle position checkpoint kinase Kin4. J Cell Biol 190: 975–989 [DOI] [PMC free article] [PubMed] [Google Scholar]
- Caydasi AK, Pereira G (2009) Spindle alignment regulates the dynamic association of checkpoint proteins with yeast spindle pole bodies. Dev Cell 16: 146–156 [DOI] [PubMed] [Google Scholar]
- Cenamor R, Jimenez J, Cid VJ, Nombela C, Sanchez M (1999) The budding yeast Cdc15 localizes to the spindle pole body in a cell-cycle-dependent manner. Mol Cell Biol Res Commun 2: 178–184 [DOI] [PubMed] [Google Scholar]
- Chan LY, Amon A (2009) The protein phosphatase 2A functions in the spindle position checkpoint by regulating the checkpoint kinase Kin4. Genes Dev 23: 1639–1649 [DOI] [PMC free article] [PubMed] [Google Scholar]
- Chen KC, Calzone L, Csikasz-Nagy A, Cross FR, Novak B, Tyson JJ (2004) Integrative analysis of cell cycle control in budding yeast. Mol Biol Cell 15: 3841–3862 [DOI] [PMC free article] [PubMed] [Google Scholar]
- Coffman VC, Wu P, Parthun MR, Wu JQ (2011) CENP-A exceeds microtubule attachment sites in centromere clusters of both budding and fission yeast. J Cell Biol 195: 563–572 [DOI] [PMC free article] [PubMed] [Google Scholar]
- D’Aquino KE, Monje-Casas F, Paulson J, Reiser V, Charles GM, Lai L, Shokat KM, Amon A (2005) The protein kinase Kin4 inhibits exit from mitosis in response to spindle position defects. Mol Cell 19: 223–234 [DOI] [PubMed] [Google Scholar]
- Doncic A, Ben-Jacob E, Barkai N (2005) Evaluating putative mechanisms of the mitotic spindle checkpoint. Proc Natl Acad Sci USA 102: 6332–6337 [DOI] [PMC free article] [PubMed] [Google Scholar]
- Falk JE, Chan LY, Amon A (2011) Lte1 promotes mitotic exit by controlling the localization of the spindle position checkpoint kinase Kin4. Proc Natl Acad Sci USA 108: 12584–12590 [DOI] [PMC free article] [PubMed] [Google Scholar]
- Fesquet D, Fitzpatrick PJ, Johnson AL, Kramer KM, Toyn JH, Johnston LH (1999) A Bub2p-dependent spindle checkpoint pathway regulates the Dbf2p kinase in budding yeast. EMBO J 18: 2424–2434 [DOI] [PMC free article] [PubMed] [Google Scholar]
- Fraschini R, Formenti E, Lucchini G, Piatti S (1999) Budding yeast Bub2 is localized at spindle pole bodies and activates the mitotic checkpoint via a different pathway from Mad2. J Cell Biol 145: 979–991 [DOI] [PMC free article] [PubMed] [Google Scholar]
- Frenz LM, Lee SE, Fesquet D, Johnston LH (2000) The budding yeast Dbf2 protein kinase localises to the centrosome and moves to the bud neck in late mitosis. J Cell Sci 113: (Part 19): 3399–3408 [DOI] [PubMed] [Google Scholar]
- Furge KA, Wong K, Armstrong J, Balasubramanian M, Albright CF (1998) Byr4 and Cdc16 form a two-component GTPase-activating protein for the Spg1 GTPase that controls septation in fission yeast. Curr Biol 8: 947–954 [DOI] [PubMed] [Google Scholar]
- Geymonat M, Spanos A, de Bettignies G, Sedgwick SG (2009) Lte1 contributes to Bfa1 localization rather than stimulating nucleotide exchange by Tem1. J Cell Biol 187: 497–511 [DOI] [PMC free article] [PubMed] [Google Scholar]
- Geymonat M, Spanos A, Jensen S, Sedgwick SG (2010) Phosphorylation of Lte1 by Cdk prevents polarized growth during mitotic arrest in S. cerevisiae. J Cell Biol 191: 1097–1112 [DOI] [PMC free article] [PubMed] [Google Scholar]
- Geymonat M, Spanos A, Smith SJ, Wheatley E, Rittinger K, Johnston LH, Sedgwick SG (2002) Control of mitotic exit in budding yeast. In vitro regulation of Tem1 GTPase by Bub2 and Bfa1. J Biol Chem 277: 28439–28445 [DOI] [PubMed] [Google Scholar]
- Geymonat M, Spanos A, Walker PA, Johnston LH, Sedgwick SG (2003) In vitro regulation of budding yeast Bfa1/Bub2 GAP activity by Cdc5. J Biol Chem 278: 14591–14594 [DOI] [PubMed] [Google Scholar]
- Ghaemmaghami S, Huh WK, Bower K, Howson RW, Belle A, Dephoure N, O’Shea EK, Weissman JS (2003) Global analysis of protein expression in yeast. Nature 425: 737–741 [DOI] [PubMed] [Google Scholar]
- Gideon P, John J, Frech M, Lautwein A, Clark R, Scheffler JE, Wittinghofer A (1992) Mutational and kinetic analyses of the GTPase-activating protein (GAP)-p21 interaction: the C-terminal domain of GAP is not sufficient for full activity. Mol Cell Biol 12: 2050–2056 [DOI] [PMC free article] [PubMed] [Google Scholar]
- Gillespie DT (1976) A general method for numerically simulating the stochastic time evolution of coupled chemical reactions. J Comp Phys 22: 403–434 [Google Scholar]
- Gruneberg U, Campbell K, Simpson C, Grindlay J, Schiebel E (2000) Nud1p links astral microtubule organization and the control of exit from mitosis. EMBO J 19: 6475–6488 [DOI] [PMC free article] [PubMed] [Google Scholar]
- Hofken T, Schiebel E (2004) Novel regulation of mitotic exit by the Cdc42 effectors Gic1 and Gic2. J Cell Biol 164: 219–231 [DOI] [PMC free article] [PubMed] [Google Scholar]
- Hu F, Elledge SJ (2002) Bub2 is a cell cycle regulated phospho-protein controlled by multiple checkpoints. Cell Cycle 1: 351–355 [PubMed] [Google Scholar]
- Hu F, Wang Y, Liu D, Li Y, Qin J, Elledge SJ (2001) Regulation of the Bub2/Bfa1 GAP complex by Cdc5 and cell cycle checkpoints. Cell 107: 655–665 [DOI] [PubMed] [Google Scholar]
- Hwa Lim H, Yeong FM, Surana U (2003) Inactivation of mitotic kinase triggers translocation of MEN components to mother-daughter neck in yeast. Mol Biol Cell 14: 4734–4743 [DOI] [PMC free article] [PubMed] [Google Scholar]
- Ibrahim B, Dittrich P, Diekmann S, Schmitt E (2008) Mad2 binding is not sufficient for complete Cdc20 sequestering in mitotic transition control (an in silico study). Biophys Chem 134: 93–100 [DOI] [PubMed] [Google Scholar]
- Janke C, Magiera MM, Rathfelder N, Taxis C, Reber S, Maekawa H, Moreno-Borchart A, Doenges G, Schwob E, Schiebel E, Knop M (2004) A versatile toolbox for PCR-based tagging of yeast genes: new fluorescent proteins, more markers and promoter substitution cassettes. Yeast 21: 947–962 [DOI] [PubMed] [Google Scholar]
- Jaspersen SL, Charles JF, Morgan DO (1999) Inhibitory phosphorylation of the APC regulator Hct1 is controlled by the kinase Cdc28 and the phosphatase Cdc14. Curr Biol 9: 227–236 [DOI] [PubMed] [Google Scholar]
- Jaspersen SL, Charles JF, Tinker-Kulberg RL, Morgan DO (1998) A late mitotic regulatory network controlling cyclin destruction in Saccharomyces cerevisiae. Mol Biol Cell 9: 2803–2817 [DOI] [PMC free article] [PubMed] [Google Scholar]
- Jaspersen SL, Morgan DO (2000) Cdc14 activates cdc15 to promote mitotic exit in budding yeast. Curr Biol 10: 615–618 [DOI] [PubMed] [Google Scholar]
- Joglekar AP, Bouck DC, Molk JN, Bloom KS, Salmon ED (2006) Molecular architecture of a kinetochore-microtubule attachment site. Nat Cell Biol 8: 581–585 [DOI] [PMC free article] [PubMed] [Google Scholar]
- Joglekar AP, Salmon ED, Bloom KS (2008) Counting kinetochore protein numbers in budding yeast using genetically encoded fluorescent proteins. Methods Cell Biol 85: 127–151 [DOI] [PMC free article] [PubMed] [Google Scholar]
- Knop M, Siegers K, Pereira G, Zachariae W, Winsor B, Nasmyth K, Schiebel E (1999) Epitope tagging of yeast genes using a PCR-based strategy: more tags and improved practical routines. Yeast 15: 963–972 [DOI] [PubMed] [Google Scholar]
- Konig C, Maekawa H, Schiebel E (2010) Mutual regulation of cyclin-dependent kinase and the mitotic exit network. J Cell Biol 188: 351–368 [DOI] [PMC free article] [PubMed] [Google Scholar]
- Lawrimore J, Bloom KS, Salmon ED (2011) Point centromeres contain more than a single centromere-specific Cse4 (CENP-A) nucleosome. J Cell Biol 195: 573–582 [DOI] [PMC free article] [PubMed] [Google Scholar]
- Lee SE, Frenz LM, Wells NJ, Johnson AL, Johnston LH (2001) Order of function of the budding-yeast mitotic exit-network proteins Tem1, Cdc15, Mob1, Dbf2, and Cdc5. Curr Biol 11: 784–788 [DOI] [PubMed] [Google Scholar]
- Li R (1999) Bifurcation of the mitotic checkpoint pathway in budding yeast. Proc Natl Acad Sci USA 96: 4989–4994 [DOI] [PMC free article] [PubMed] [Google Scholar]
- Lohel M, Ibrahim B, Diekmann S, Dittrich P (2009) The role of localization in the operation of the mitotic spindle assembly checkpoint. Cell Cycle 8: 2650–2660 [DOI] [PubMed] [Google Scholar]
- Lopez-Aviles S, Kapuy O, Novak B, Uhlmann F (2009) Irreversibility of mitotic exit is the consequence of systems-level feedback. Nature 459: 592–595 [DOI] [PMC free article] [PubMed] [Google Scholar]
- Luca FC, Mody M, Kurischko C, Roof DM, Giddings TH, Winey M (2001) Saccharomyces cerevisiae Mob1p is required for cytokinesis and mitotic exit. Mol Cell Biol 21: 6972–6983 [DOI] [PMC free article] [PubMed] [Google Scholar]
- Maekawa H, Priest C, Lechner J, Pereira G, Schiebel E (2007) The yeast centrosome translates the positional information of the anaphase spindle into a cell cycle signal. J Cell Biol 179: 423–436 [DOI] [PMC free article] [PubMed] [Google Scholar]
- Meitinger F, Boehm ME, Hofmann A, Hub B, Zentgraf H, Lehmann WD, Pereira G (2011) Phosphorylation-dependent regulation of the F-BAR protein Hof1 during cytokinesis. Genes Dev 25: 875–888 [DOI] [PMC free article] [PubMed] [Google Scholar]
- Meitinger F, Palani S, Pereira G (2012) The power of MEN in cytokinesis. Cell Cycle 11: 219–228 [DOI] [PubMed] [Google Scholar]
- Molk JN, Schuyler SC, Liu JY, Evans JG, Salmon ED, Pellman D, Bloom K (2004) The differential roles of budding yeast Tem1p, Cdc15p, and Bub2p protein dynamics in mitotic exit. Mol Biol Cell 15: 1519–1532 [DOI] [PMC free article] [PubMed] [Google Scholar]
- Monje-Casas F, Amon A (2009) Cell polarity determinants establish asymmetry in MEN signaling. Dev Cell 16: 132–145 [DOI] [PMC free article] [PubMed] [Google Scholar]
- Moore JK, Chudalayandi P, Heil-Chapdelaine RA, Cooper JA (2010) The spindle position checkpoint is coordinated by the Elm1 kinase. J Cell Biol 191: 493–503 [DOI] [PMC free article] [PubMed] [Google Scholar]
- Moore JK, Cooper JA (2010) Coordinating mitosis with cell polarity: molecular motors at the cell cortex. Semin Cell Dev Biol 21: 283–289 [DOI] [PMC free article] [PubMed] [Google Scholar]
- Musacchio A, Salmon ED (2007) The spindle-assembly checkpoint in space and time. Nat Rev Mol Cell Biol 8: 379–393 [DOI] [PubMed] [Google Scholar]
- Park JE, Park CJ, Sakchaisri K, Karpova T, Asano S, McNally J, Sunwoo Y, Leem SH, Lee KS (2004) Novel functional dissection of the localization-specific roles of budding yeast polo kinase Cdc5p. Mol Cell Biol 24: 9873–9886 [DOI] [PMC free article] [PubMed] [Google Scholar]
- Pereira G, Hofken T, Grindlay J, Manson C, Schiebel E (2000) The Bub2p spindle checkpoint links nuclear migration with mitotic exit. Mol Cell 6: 1–10 [PubMed] [Google Scholar]
- Pereira G, Manson C, Grindlay J, Schiebel E (2002) Regulation of the Bfa1p-Bub2p complex at spindle pole bodies by the cell cycle phosphatase Cdc14p. J Cell Biol 157: 367–379 [DOI] [PMC free article] [PubMed] [Google Scholar]
- Pereira G, Schiebel E (2005) Kin4 kinase delays mitotic exit in response to spindle alignment defects. Mol Cell 19: 209–221 [DOI] [PubMed] [Google Scholar]
- Pruyne D, Bretscher A (2000) Polarization of cell growth in yeast. I. Establishment and maintenance of polarity states. J Cell Sci 113: Part 3): 365–375 [DOI] [PubMed] [Google Scholar]
- Queralt E, Lehane C, Novak B, Uhlmann F (2006) Downregulation of PP2A(Cdc55) phosphatase by separase initiates mitotic exit in budding yeast. Cell 125: 719–732 [DOI] [PubMed] [Google Scholar]
- Rock JM, Amon A (2011) Cdc15 integrates Tem1 GTPase-mediated spatial signals with Polo kinase-mediated temporal cues to activate mitotic exit. Genes Dev 25: 1943–1954 [DOI] [PMC free article] [PubMed] [Google Scholar]
- Sear RP, Howard M (2006) Modeling dual pathways for the metazoan spindle assembly checkpoint. Proc Natl Acad Sci USA 103: 16758–16763 [DOI] [PMC free article] [PubMed] [Google Scholar]
- Sherman F (1991) Getting started with yeast. Methods Enzymol 194: 3–21 [DOI] [PubMed] [Google Scholar]
- Shirayama M, Matsui Y, Tanaka K, Toh-e A (1994a) Isolation of a CDC25 family gene, MSI2/LTE1, as a multicopy suppressor of ira1. Yeast 10: 451–461 [DOI] [PubMed] [Google Scholar]
- Shirayama M, Matsui Y, Toh EA (1994b) The yeast TEM1 gene, which encodes a GTP-binding protein, is involved in termination of M phase. Mol Cell Biol 14: 7476–7482 [DOI] [PMC free article] [PubMed] [Google Scholar]
- Siller KH, Doe CQ (2009) Spindle orientation during asymmetric cell division. Nat Cell Biol 11: 365–374 [DOI] [PubMed] [Google Scholar]
- Simonetta M, Manzoni R, Mosca R, Mapelli M, Massimiliano L, Vink M, Novak B, Musacchio A, Ciliberto A (2009) The influence of catalysis on mad2 activation dynamics. PLoS Biol 7: e10. [DOI] [PMC free article] [PubMed] [Google Scholar]
- Sohrmann M, Schmidt S, Hagan I, Simanis V (1998) Asymmetric segregation on spindle poles of the Schizosaccharomyces pombe septum-inducing protein kinase Cdc7p. Genes Dev 12: 84–94 [DOI] [PMC free article] [PubMed] [Google Scholar]
- Stegmeier F, Amon A (2004) Closing mitosis: the functions of the Cdc14 phosphatase and its regulation. Annu Rev Genet 38: 203–232 [DOI] [PubMed] [Google Scholar]
- Straight AF, Field CM (2000) Microtubules, membranes and cytokinesis. Curr Biol 10: R760–R770 [DOI] [PubMed] [Google Scholar]
- Toth A, Queralt E, Uhlmann F, Novak B (2007) Mitotic exit in two dimensions. J Theor Biol 248: 560–573 [DOI] [PubMed] [Google Scholar]
- Valerio-Santiago M, Monje-Casas F (2011) Tem1 localization to the spindle pole bodies is essential for mitotic exit and impairs spindle checkpoint function. J Cell Biol 192: 599–614 [DOI] [PMC free article] [PubMed] [Google Scholar]
- Visintin R, Amon A (2001) Regulation of the mitotic exit protein kinases Cdc15 and Dbf2. Mol Biol Cell 12: 2961–2974 [DOI] [PMC free article] [PubMed] [Google Scholar]
- Visintin R, Craig K, Hwang ES, Prinz S, Tyers M, Amon A (1998) The phosphatase Cdc14 triggers mitotic exit by reversal of Cdk-dependent phosphorylation. Mol Cell 2: 709–718 [DOI] [PubMed] [Google Scholar]
- Wang Y, Hu F, Elledge SJ (2000) The Bfa1/Bub2 GAP complex comprises a universal checkpoint required to prevent mitotic exit. Curr Biol 10: 1379–1382 [DOI] [PubMed] [Google Scholar]
- Wiedenmann J, Schenk A, Rocker C, Girod A, Spindler KD, Nienhaus GU (2002) A far-red fluorescent protein with fast maturation and reduced oligomerization tendency from Entacmaea quadricolor (Anthozoa, Actinaria). Proc Natl Acad Sci USA 99: 11646–11651 [DOI] [PMC free article] [PubMed] [Google Scholar]
- Yoshida S, Ichihashi R, Toh-e A (2003) Ras recruits mitotic exit regulator Lte1 to the bud cortex in budding yeast. J Cell Biol 161: 889–897 [DOI] [PMC free article] [PubMed] [Google Scholar]
- Yoshida S, Toh-e A (2001) Regulation of the localization of Dbf2 and mob1 during cell division of saccharomyces cerevisiae. Genes Genet Syst 76: 141–147 [DOI] [PubMed] [Google Scholar]
Associated Data
This section collects any data citations, data availability statements, or supplementary materials included in this article.
Supplementary Materials
Supplementary figures S1-9, Supplementary tables S1-5