Summary
Single molecule Förster resonance energy transfer (FRET) experiments are a versatile method for investigating the conformational distributions and dynamics of biological macromolecules. In a common type of experiment, the fluorescence bursts from individual molecules freely diffusing in solution are detected as they pass through the observation volume of a confocal microscope. Correlation analysis of the fluorescence bursts shows that under typical experimental conditions, for time scales up to several tens of milliseconds, the probability for a molecule to return to the confocal volume is greater than the probability of a new molecule being detected. Here we present RASP (recurrence analysis of single particles), a method that is based on this recurrence behavior and allows us to significantly extend the information that can be extracted from single molecule FRET experiments. The number and peak shapes of subpopulations within the sample can be identified essentially in a model-free way by constructing recurrence FRET efficiency histograms. These are obtained by first selecting photon bursts from a small transfer efficiency range (initial bursts), and then building the FRET efficiency histogram only from bursts detected within a short time (the recurrence interval) after the initial bursts. Systematic variation of the recurrence interval allows the kinetics of interconversion between subpopulations to be determined on time scales from ~50 μs up to ~100 ms from equilibrium measurements. We demonstrate the applicability of the method on measurements of several peptides and proteins with different degrees of conformational heterogeneity and folding dynamics. The concepts presented here can be extended to other observables available from single molecule fluorescence experiments.
Introduction
Förster resonance energy transfer (FRET) is a sensitive method for determining distances on a nanometer scale1, 2. In combination with single molecule fluorescence detection, FRET is used increasingly to investigate the structure and dynamics of biological macromolecules3-7. To this end, a suitable donor and an acceptor fluorophore are attached to the biomolecule of interest; the donor is excited specifically with an appropriate laser line; and the fluorescence emission of donor and acceptor is collected. From an analysis of the photon rates from donor and acceptor or their fluorescence lifetimes, the efficiency of transfer between the two dyes can be determined, which can then be converted into distance information via the known distance dependence of the transfer efficiency1, 2. Both measurement and analysis techniques have matured greatly over the past decade5, 7, with two dominant approaches for data acquisition. Single molecules are either observed immobilized on a surface (or in a matrix) or freely diffusing in solution. Fluorescence from immobilized molecules can be recorded for extended periods of time, which allows kinetic processes to be monitored up to seconds or even minutes, but their conformation or dynamics can be affected by interactions with the surface. This complication is absent in experiments on freely diffusing molecules, but the observation time is limited by the diffusion time of the molecules through the confocal volume, typically in the range of a millisecond. Even though the short observation times allow the use of high excitation rates, and thus the best time resolution, dynamics on longer time scales are not accessible from the individual passage of a molecule through the laser beam.
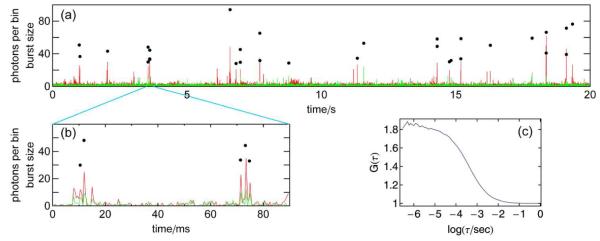
The most common way of analyzing single molecule FRET experiments of freely diffusing molecules8, 9 involves two steps. First, the fluorescence of single molecules is identified as “bursts” of photons, intervals during which the count rate increases significantly above the background signal. In a second step, transfer efficiencies (or fluorescence lifetimes, anisotropies etc.) are calculated from all bursts individually and combined in a histogram. These histograms can then be used to identify subpopulations present in the sample, to determine their mean transfer efficiencies, and to analyze the corresponding distributions. This procedure and related analysis methods treat the bursts of detected photons as independent events, i.e. as originating from independent molecules. However, it is obvious from a correlation analysis of the complete data that the signal exhibits a significant correlation out to time scales much longer than the average diffusion time through the confocal volume (Fig. 1c). Visual inspection of the fluorescence signal traces clearly indicates that this correlation is not caused by unusually long fluorescence bursts, but by clusters of short bursts (Fig. 1a,b). Due to the low concentrations of molecules in single-molecule experiments (typically tens of picomolar), there is a high probability that a molecule that leaves the confocal volume returns before a new molecule enters. Two bursts detected within a short time interval are thus likely to originate from the same molecule. Even though the influence of this recurrence effect is included implicitly in the models used to fit correlation curves10, and it has been addressed in theoretical papers11, 12, and in experiments on fluorescent nanoparticles12 and cells13, the resulting additional information content has largely been ignored in single molecule experiments.
Figure 1.
The recurrence effect in single-molecule FRET experiments of freely diffusing molecules is clearly visible as clustering of photon bursts in binned time traces (a,b) (donor signal in green, acceptor signal in red, 1 ms binning). Points indicate the positions and the numbers of photon counts of identified bursts. The clustering is also the origin of fluorescence intensity correlation on time scales greater than the mean diffusion time (~1ms) through the confocal volume (c). Data were measured on freely diffusing FRET-labeled CspTm in 1.1 M GdmCl.
Here, we show that taking into account the recurrence effect can be used to significantly extend the time scales and information accessible from single molecule FRET experiments. We present a simple and essentially model-free approach for extracting the shapes and positions of subpopulations in transfer efficiency histograms and distinguishing homogeneous from inhomogeneous peak broadening. We also show that burst time correlation analysis can be used to quantify the probability that two bursts originate from the same molecule and to estimate interconversion rates between subpopulations on time scales much longer than the duration of individual bursts. We illustrate this recurrence analysis of single particles (RASP) with single molecule measurements of labeled proteins where we determine the peak shapes and heterogeneity of the individual subpopulations in the FRET efficiency histograms and obtain protein folding dynamics both with sub-millisecond time resolution and on time scales much longer than the duration of individual bursts.
Results and discussion
Burst time correlation and the ‘same molecule’ probability
The finite amplitude of the FCS curve at times much longer than the mean diffusion time through the confocal volume, and the clustering of bursts in photon trajectories (Fig. 1) indicate the recurrence of single molecules, but can we show more directly that these clustered bursts originate from the same molecule? Bursts from different and non-interacting molecules are expected to be uncorrelated, but if bursts originate from the same molecule, they should be correlated. In analogy to photon time correlation functions used in fluorescence correlation spectroscopy (FCS), we define the ‘burst time’ correlation as:
| 1 |
where B1 and B2 denote subsets of bursts, for example defined by ranges of transfer efficiencies; p({b1,t}, {b2,t +τ}) denotes the joint probability of observing two bursts b1
 B1 and b2
 B2 at times t and t + τ,* respectively; and p({b1,t}) and p({b2,t}) are the probabilities of detecting bursts b1 and b2, respectively, at time t, where t is the temporal midpoint of the burst. We assume the system to be ergodic, which implies that all three probabilities do not depend on the choice of t.
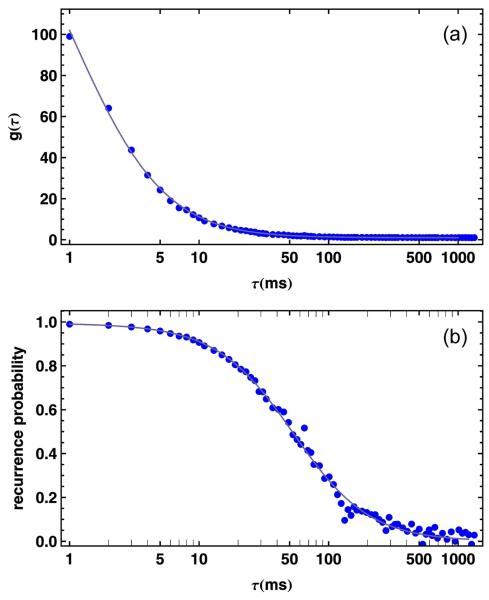
An example for g(τ) calculated from a single molecule measurement of the fluorescently labeled small cold shock protein CspTm 14, 15 is given in Fig. 2a, which indicates a significant correlation between bursts up to a time scale of ~100 ms. We can use this correlation between bursts to substantially extend the time scale accessible from experiments on freely diffusing molecules, but for a quantitative analysis, we need to take into account the probability that two photon bursts measured at times t1 and t2 (with t2 − t1 = τ) were emitted by the same molecule. We show in the supplement that this ‘same molecule’ probability, psame (τ), is given by
| 2 |
where g(τ) is the burst time autocorrelation function of all detected bursts. Fig. 2b shows psame(τ) for the measurement of CspTm. From a fit to the data, we can now determine for each burst pair the probability that it originated from the same, recurring molecule, and calculate the average psame for a subset of bursts by averaging over all corresponding burst pairs.
Figure 2.
Burst time correlation and same molecule probability. (a) The burst time autocorrelation g(τ) of CspTm in 1.1 M GdmCl exhibits a large amplitude, indicative of a large probability of detecting bursts shortly after a previous burst. An empirical fit to g(τ)=1+[n−1(1+τ/τD)−3/2 is shown as a continuous line. (b) The correlation g(τ) can be converted to psame(τ), the probability that a burst originates from the same molecule as a burst detected a time τ before. The continuous line is a fit using the conversion of g(τ) to psame(τ) according to Eq.2.
Subpopulation-specific burst time correlation
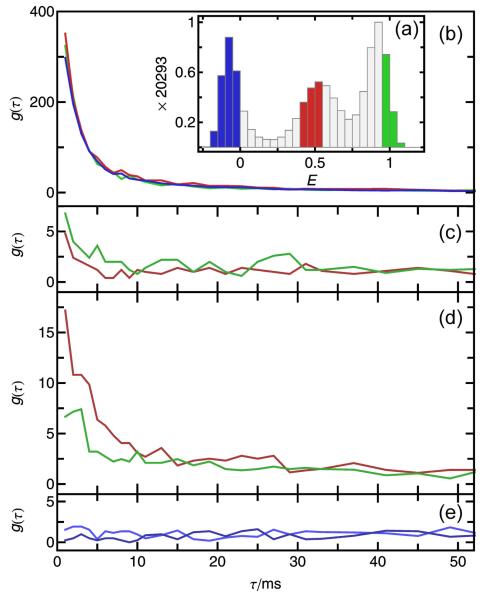
In the definition of gB1B2 (τ) (Eq. 1), B1 and B2 can represent groups of bursts that correspond to different subpopulations in the sample. For example, subpopulations can be chosen by selecting bursts from different transfer efficiency ranges. This is illustrated in Fig. 3 a for the folded, unfolded, and acceptor-inactive molecules at high, intermediate, and close to zero transfer efficiencies, respectively, of FRET-labeled CspTm at 1.1 M guanidinium chloride (GdmCl). The decays of the autocorrelations (B1=B2) are very similar for all subpopulations, which shows that their recurrence behavior is very similar. The subpopulation autocorrelations (Fig. 3b) obtained from these subsets of bursts have higher amplitudes than the autocorrelation function of all bursts (Fig. 2 a). This is expected since at lower concentration, the likelihood that two bursts detected within a short time were emitted by the same (i.e. recurring) molecule is higher than the likelihood that they were emitted by two different molecules. In analogy to FCS, the amplitude of the burst time correlation is thus inversely related to the concentration of molecules in a subpopulation. Similarly, the total amplitude of g(τ), and thus the magnitude of psame at a given time τ, can be increased by reducing the concentration of fluorescent molecules in the sample.
Figure 3.
Subpopulation-specific burst time correlations. Bursts were selected from transfer efficiency ranges reflecting the unfolded (red), folded (green), or acceptor-inactive (blue) subpopulations, as shown in the FRET efficiency histogram (a). (Note that values of E >1 or <0 are due to corrections for background and direct acceptor excitation. For details see Ref.9) Colors in panels b-e indicate the E range of the initial bursts. (b) Subpopulation-specific autocorrelations exhibit large amplitudes, reflecting the high probability of recurrence. The cross-correlations between folded and unfolded subpopulations (c) yield small but significant amplitudes, which may reflect an imperfect separation of the subpopulations for the E ranges in (a). Acceptor photobleaching results in significant amplitudes of the cross-correlation from acceptor-active to -inactive subpopulations (d). (e) No cross-correlation from acceptor-inactive to -active subpopulations is observed, showing that blinking processes do not occur on the recurrence time scale.
Interestingly, the cross-correlations of bursts from molecules with an inactive acceptor to those from an active one (unfolded or folded) exhibit no significant amplitude (Fig. 3e). This shows that the number of molecules that recover their acceptor fluorescence on the recurrence time scale is negligible. All burst pairs where the first burst is from a molecule with inactive acceptor and the second burst from a molecule with active acceptor must thus be from two different molecules. The opposite cross-correlations, i.e. a burst from a folded or unfolded molecule first and from a molecule with inactive acceptor second, show small but significant amplitudes (Fig. 3d). This effect can be explained by bleaching of the acceptor dye prior to the recurrence of the molecule. The small amplitudes for the cross-correlations between the folded and unfolded states (Fig. 3c) might be caused by the imperfect separation of the subpopulations defined by the transfer efficiency ranges chosen, an effect that has to be considered carefully for interpreting cross-correlation signals.
Recurrence Transfer Efficiency Histograms
The recurrence effect allows us to extend the information available from transfer efficiency histograms, one of the most popular types of analysis for FRET experiments on freely diffusing molecules 5, 7, 8. If a molecule retains its mean transfer efficiency for a time much longer than the diffusion time, two bursts separated by a short time interval are very likely to yield the same transfer efficiency, because they are likely to have originated from the same molecule. We can visualize this behavior by constructing transfer efficiency histograms from a set of bursts selected by two criteria. First, the bursts b2 must be detected during a time interval between t1 and t2 (the ‘recurrence interval’, T = (t1, t2)) after a previous burst b1 (the ‘initial burst’). Second, the initial bursts must yield a transfer efficiency, E(b1), within a defined range, ΔE1 (the ‘initial E range’). The set R of burst pairs {b1, b2} selected by these criteria is then
| 3 |
where tb1 and tb2 are the detection times of the bursts b1 and tb2, respectively. The set of burst pairs R is the starting point for the different types of analysis presented here. A very informative way of representing the data is the transfer efficiency histogram of all values E(b2), the ‘recurrence transfer efficiency (E) histogram’.
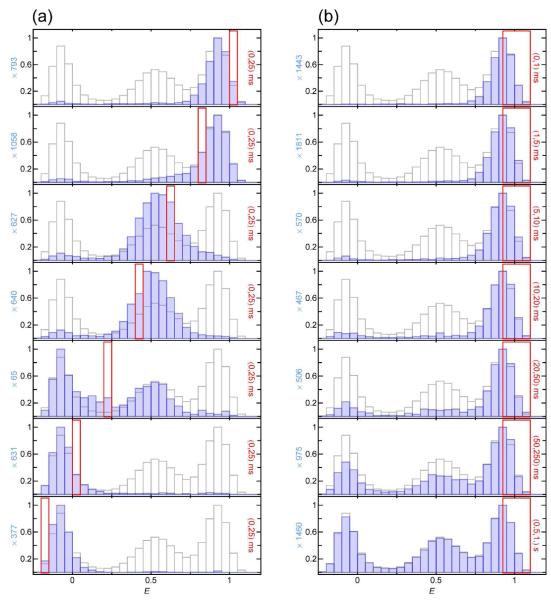
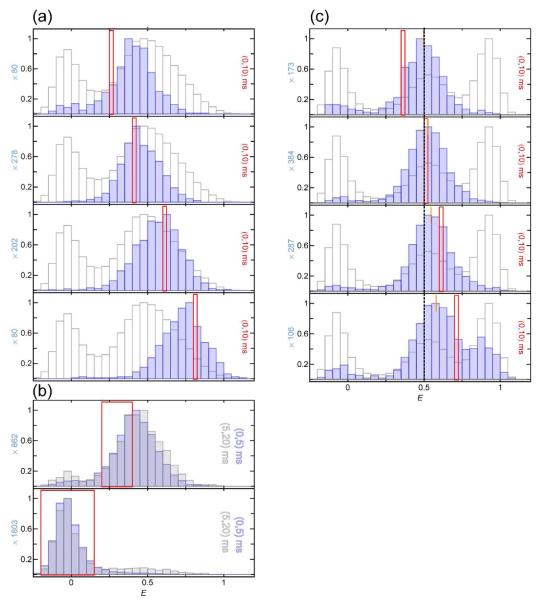
Examples of recurrence E histograms that were obtained from a measurement of CspTm labeled with Alexa Fluors 488 and 594 as donor and acceptor, respectively14, 15, in 1.1 M GdmCl are shown in Fig. 4. For comparison, the histogram of all detected bursts (the ‘complete histogram’) is shown in light grey in all panels. The initial E range ΔE1 is indicated by a red frame. Fig. 4a illustrates the dependence of the recurrence E histogram on the initial E range for a fixed recurrence interval of T = (0, 25 ms). Notably, the individual histograms resemble the subpopulations that contribute to the respective initial E range chosen, as expected if the bursts recurring within 25 ms originate preferentially from the same molecules. The histograms show that the time scale of interconversion between the subpopulations has to be much greater than the recurrence time. Otherwise, peaks of subpopulations not contributing to the initial E range would appear.
Figure 4.
Normalized recurrence E histograms of CspTm in 1.1 M GdmCl (blue) compared to the complete histogram (light gray). (a) Dependence on the initial E range (red frame) for bursts detected within 25 ms after the initial burst (recurrence indicated in each panel to the right). The peaks of the recurrence E histograms resemble the individual peaks in the complete E histogram with the entire width of the subpopulations contributing to the initial E range. (b) Dependence of a recurrence E histogram with an initial E range corresponding to the folded state on the length of the recurrence interval. With increasing recurrence interval, psame decreases and correspondingly, the contribution of new molecules increases. Since the distribution of new molecules is identical to that of the entire ensemble, the recurrence E histograms approach the complete histogram at long times.
The transfer efficiencies of the recurrence E histograms are not limited to the transfer efficiencies in the initial E range ΔE1, but the resulting peaks have a shape resembling that of the respective subpopulation(s) in the complete transfer efficiency histogram. This is expected if only homogeneous broadening contributes to the width, i.e. only factors influencing each single burst equally (e.g. shot noise or instrumental factors). If interconversion between the subpopulations is slow relative to the recurrence interval, recurrence analysis can thus be used as a simple method to obtain the transfer efficiency peaks corresponding to isolated subpopulations in an essentially model-free way. In general, several scenarios can be distinguished:
A subpopulation is not represented by a single distance, but by a static distance distribution (inhomogeneous broadening). In this case, the recurrence E histograms will reveal a distribution of distances by a change of the mean transfer efficiency of the corresponding peaks of the recurrence E histograms with the initial transfer efficiency range. In this way, heterogeneity in a subpopulation can be identified unequivocally (see Peak width analysis).
A subpopulation represents a single distance, but overlaps with another subpopulation with different mean transfer efficiency. In this case, the initial transfer efficiency range can be chosen such that only one subpopulation dominates the recurrence E histogram (see Fig. 4a).
A subpopulation represents a single distance, but interconverts with another subpopulation on the recurrence time scale (e.g. due to conformational change or photobleaching). In this case, a sufficiently short recurrence time interval will yield the pure peak of the initial subpopulation. By constructing recurrence E histograms with different delay times between initial and following bursts, interconversion rates can be obtained (see Interconversion dynamics from recurrence analysis).
The recurrence E histograms for different recurrence intervals T (Fig. 4b) illustrate the difference between recurring and new molecules. In the absence of interconversion between conformations with different transfer efficiencies, recurring molecules will resemble the subpopulation corresponding to the initial E range, while new molecules will be distributed according to the equilibrium distribution of the sample. With increasing size of the recurrence interval, the probability of detecting new molecules increases, and for very long times, the recurrence E histogram will exhibit the same distribution of subpopulations as the complete E histogram. Between 20 and 50 ms, the majority of detected CspTm molecules still are recurring molecules. This means that recurrence analysis allows the observation time to be extended by a factor of 20 to 50 from the 1 ms typical for a single burst.
Peak width analysis
To illustrate the possibility of probing heterogeneity in a sample with RASP, Fig. 5a shows recurrence E histograms of polyproline peptides containing 20 proline residues, labeled with Alexa Fluors 488 and 594 as donor and acceptor, respectively16, and measured in 3.5 M GdmCl. In spite of the large stiffness of the peptides, which form a polyproline type II helix in aqueous solution, significant conformational heterogeneity has been detected in these molecules17-19, dominated by cis-trans isomerization of peptidyl-prolyl bonds. Correspondingly, the complete E histogram (gray in the background of histograms in Fig. 5a) shows a very broad peak at intermediate transfer efficiencies. To optimize resolution, the recurrence E histograms were constructed with a very narrow initial transfer efficiency range that is shifted in small steps over the unfolded state peak. The analysis shows a pronounced dependence of the peak position in the recurrence E histogram on the initial E range, with a shift from about 0.4 to 0.8. No discrete subpopulations are resolved, suggesting a large degree of heterogeneity with a distribution of end-to-end distances that is interconverting slowly on the time scale of 10 ms. The absence of interconversion can be demonstrated directly with histograms for different recurrence times (Fig. 5b). The lower transfer efficiency half of the peak does not interconvert with the other half within 5 to 20 ms. The slight broadening of the peaks during this time can be explained by the appearance of new molecules, because the fraction of bursts in the high transfer efficiency shoulder is similar to the fraction of acceptor-active molecules detected after the acceptor-inactive state in this recurrence interval.
Figure 5.
Recurrence E histograms with narrow initial E ranges for the analysis of conformational heterogeneity. (a) Polyproline 20 in 3.5 M GdmCl. The pronounced peak position dependence reflects the broad conformational distribution in polyproline peptides16, 19. (b) Recurrence E histograms with different recurrence intervals show that no interconversion between the low and high transfer efficiency halves of the peak occur within 20 ms (upper panel). The appearance of a small number of bursts with higher transfer efficiency is due to the ~10 % of new molecules expected for this recurrence interval, as supported by the appearance of a similar fraction of acceptor-active molecules following an initial burst from acceptor-inactive molecules during the same recurrence interval (lower panel). (c) Shift of the recurrence E histogram starting from the unfolded peak of CspTm in 1.1 M GdmCl with the initial E range for bursts detected within 10 ms after the initial burst. The short orange lines indicate the peak positions of the histograms.
Even much less pronounced heterogeneity can be detected with this analysis. Fig. 5c shows a detailed analysis of recurrence E histograms of the CspTm data presented in Fig. 4. Even though shot noise is the dominant source of peak broadening, as shown by a detailed analysis of the photon statistics20 (Supplementary Fig. 1), there is a significant position dependence of the peaks on the initial E range, which suggests that heterogeneous broadening contributes to the width of the unfolded peak, possibly from labeling permutations that could not be separated during purification. For CspTm, it was previously shown that the peak width of the unfolded subpopulation is broader than expected from shot-noise and that the bursts from different parts of the peak have slightly different donor fluorescence lifetimes, suggesting that they represent subsets of unfolded molecules with slightly different mean transfer efficiencies21.
RASP can also be used to address a common issue in the analysis of transfer efficiency histograms: the determination of the number of contributing subpopulations and their peak shapes. Both the shape and position of subpopulations can be obtained by choosing short recurrence intervals and initial transfer efficiency ranges that represent only a single subpopulation, as shown in Fig. 4. The resulting parameters can then be used to constrain empirical fits of the complete histogram, or for rigorous modeling of the dynamics of the system based on photon statistics20, 22-26. Even the significance of small populations and the properties of strongly overlapping peaks can be tested with this approach.
Recurrence transfer efficiency contour plots
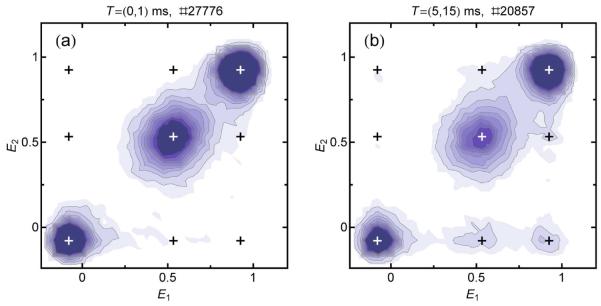
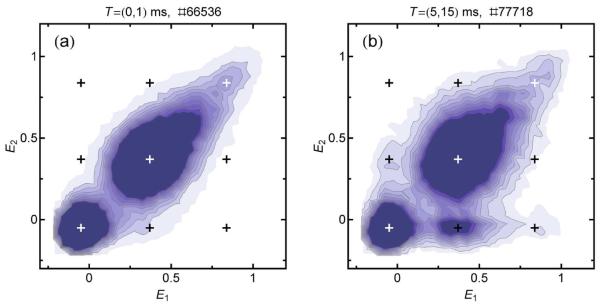
An alternative visualization of the effect of recurrence is a ‘recurrence E contour plot’, as shown in Fig. 6. The contour plots are obtained from two-dimensional histograms of burst pairs, where the initial burst and the second burst yield transfer efficiencies in range ΔE1 and ΔE2, respectively. Each plot is constructed for a certain recurrence interval T.
Figure 6.
Recurrence E contour plots of CspTm in 1.1 M GdmCl. Each bin corresponds to bursts that have a transfer efficiency of E2 and are detected between 0 and 1 ms (a) or between 5 and 15 ms (b) after a burst with transfer efficiency E1. Molecules with the same E for the first and second burst will appear on the identity line. For short recurrence intervals (a), only the three subpopulations (unfolded, folded, and acceptor-inactive molecules) are visible on the diagonal. For longer recurrence intervals (b), cross-peaks appear, which can originate either from interconversion of subpopulations or from the appearance of new molecules. The cross-peaks with E2 ≈ 0 originate from acceptor photobleaching. Black and white crosses indicate the mean transfer efficiencies of the subpopulations and possible cross-peaks. The recurrence intervals and the total numbers of burst pairs are indicated above the graphs.
Recurrence E contour plots give a detailed picture of all subpopulations present in a measured sample and of the extent of their interconversion on the recurrence time scale. The recurrence E histograms of Fig. 4a correspond to vertical slices of distinct ΔE1 ranges in a contour plot. Fig. 6 shows the contour plot of the same CspTm sample as in Fig. 4 for two different recurrence intervals. The contour plots can be interpreted in the following way. Subpopulations that are static on the recurrence time scale result in peaks on the identity line, as the transfer efficiencies of the initial burst and the recurring bursts (i.e. E1 and E2) are the same. Since, on average, shot noise affects both bursts to the same extent, the transfer efficiency distributions are broadened equally along the E1 and E2 axes, and are approximately radially symmetric, especially in the vicinity of E = 0.5†. In both plots in Fig. 6, the three expected subpopulations of folded and unfolded molecules and molecules with inactive acceptor can be clearly distinguished.
Another important feature of transfer efficiency contour plots is the appearance of cross-peaks, similar in spirit to exchange spectroscopy in NMR27. There are two possible sources of cross-peaks. The first one is interconversion between subpopulations: if a molecule changes its conformation on the recurrence time scale, it can initially have a transfer efficiency representing state A (E1), and later during the recurrence interval a transfer efficiency representing state B (E2), or vice versa. If interconversion between A and B is an equilibrium process, two cross-peaks (for state A to state B and vice versa) are expected. Because of detailed balance, both cross-peaks must then have the same magnitude, regardless of the population ratio of states A and B. In the case of acceptor photo-bleaching, an irreversible process, cross-peaks are expected only for one direction, with E1 corresponding to the acceptor-active state and E2 corresponding to the acceptor-inactive state. Another photophysical effect to be considered is blinking of the acceptor dye on the millisecond timescale caused by the reversible population of dark states28-30, which would be expected to reduce the apparent transfer efficiency and result in cross-peaks at the corresponding areas in the contour plot. As shown from burst time correlation analysis, acceptor blinking on the recurrence time scale (Fig 3e) can be neglected for all measurements presented here. The second possible origin of cross-peaks is the appearance of new molecules. The ability to distinguish between these two sources of cross-peaks is a prerequisite for analyzing interconversion kinetics quantitatively, which can be achieved by burst time correlation analysis (see Interconversion dynamics from recurrence analysis). As shown in Fig. 6a, no significant interconversion between folded and unfolded subpopulations is observed for CspTm in 1.1 M GdmCl within 1 ms. This is expected from its folding/unfolding relaxation rate constant under these conditions of ~4 s−1.14 The cross-peaks appearing for a recurrence interval of T = (5ms,15ms) (Fig.6b) originate only from the arrival of new molecules or from acceptor photo-bleaching ( E2 ≈ 0) (see also Interconversion dynamics from recurrence analysis and Fig. 9). The small heterogeneous broadening of the unfolded state peak discussed in the previous section (see Fig. 5c) corresponds to a slight elongation of the corresponding peak shape along the diagonal in Fig. 6.
Figure 9.
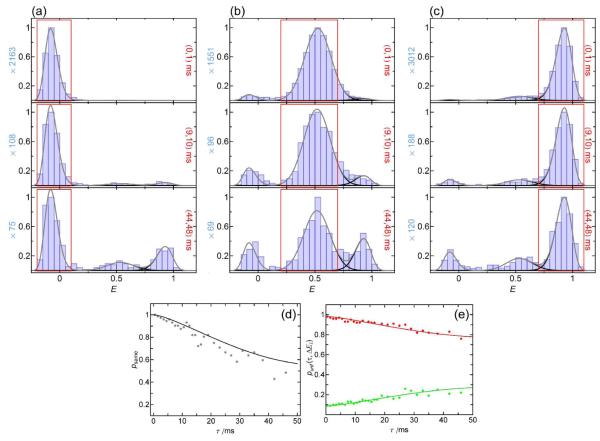
Representative recurrence E histograms of CspTm in 1.1 M GdmCl for different recurrence times and subpopulation-specific ΔE1 ranges (acceptor-inactive in a, unfolded in b, and folded in c; the recurrence intervals are indicated in each panel with red frames). For all three ΔE1 ranges, the two other populations slightly increase over time. The appearance of the acceptor-active population in (a) can be used directly to calculate psame (d, gray points) and is compared to psame calculated from the burst autocorrelation (Eq. 2, black line), showing the good agreement between both methods. The fractions of unfolded molecules punf(τ) for recurrence E histograms starting from unfolded (b) and folded (c) molecules (red and green points, e) were globally fit with a model including both folding/unfolding of recurring molecules and appearance of new molecules (continuous lines). The fit is indistinguishable from what is expected for the occurrence of new molecules only, which shows that the contribution from folding dynamics is negligible in this case.
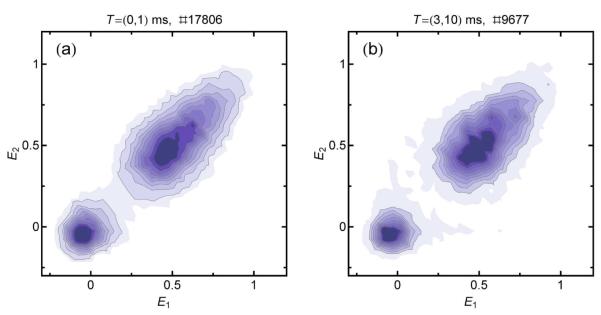
As a second example, we plot a recurrence E contour plot (Fig 7) from the same polyproline data as shown in Fig. 5. In this case, the static heterogeneity is reflected by a broad distribution of signal along the diagonal. At least three shot noise-limited distributions are required to describe the population. The slight broadening of the distribution at later times (Fig. 7b) can be fully attributed to bursts from new molecules (13%). The time scale of interconversion must thus be greater than 10 ms.
Figure 7.
Recurrence E contour plots of polyproline 20 in 3.5 M GdmCl for the first 1 ms (a) and between 3 and 10 ms after the initial burst (b). The acceptor-active subpopulation exhibits a distorted peak that would need to be modeled by at least three Gaussian subpopulations, indicating pronounced conformational heterogeneity. For longer times (b), the peak broadens due to the appearance of new molecules. The conformational heterogeneity is thus static on a time scale of up to at least 10 ms. The recurrence intervals and the total numbers of burst pairs are indicated above the graphs.
As a third example, CspTm was measured in 50% (w/v) ethylene glycol and 3.5 M GdmCl (Fig. 8). Studying the effect of viscogens on the folding and stability of proteins is of fundamental interest, as the presence of viscogens can mimic important aspects of the protein’s environment inside a cell31. The unfolded state peak in the standard transfer efficiency histogram shows an unusual asymmetry with a tail towards higher transfer efficiencies (Supplementary Fig. 2). Recurrence analysis again reveals more details. Several subpopulations are distinguishable: acceptor-inactive molecules at transfer efficiencies close to E ≈ 0; the unfolded main peak at E ≈ 0.4, which continuously merges into a smaller subpopulation at E ≈ 0.65; and a small, but significant population with E ≈ 0.9, where the peak from the folded state is expected. Note that the native state under these conditions is populated to only about one percent, and is not visible in the standard E histogram (Supplementary Fig. 2), demonstrating the sensitivity of recurrence analysis. The identification of a third subpopulation in CspTm, a classical example of a two-state folder, is surprising, but additional investigations will be necessary to exclude a photophysical origin of the additional population. For longer recurrence times (Fig. 8b), a significant cross-peak appears between the main unfolded state peak and the acceptor-inactive subpopulation, and significant broadening of the unfolded subpopulation indicates cross-peaks between its lower and higher E segments. However, while recurrence E histograms and contour plots can provide a first indication for interconversion between subpopulations, it is not possible to quantify the contributions of conformational change and new molecules, respectively, to the occurrence of cross-peaks. A more quantitative approach is thus needed.
Figure 8.
Recurrence E contour plots of CspTm in 3.5 M GdmCl and 50% ethylene glycol. The broad peak from unfolded molecules suggests pronounced heterogeneity, in addition to a small peak from folded molecules at E ≈ 0.9. Black and white crosses indicate the mean transfer efficiencies of the subpopulations and possible cross-peaks. The recurrence intervals and the total numbers of burst pairs are indicated above the graphs.
Interconversion dynamics from kinetic recurrence analysis
In this section, we introduce a method to quantitatively extract rates of interconversion between subpopulations from time-dependent recurrence E histograms. The basic idea is the following: if two subpopulations interconvert on the recurrence time scale, we expect that in a recurrence E histogram, more bursts from the second population appear during the recurrence interval than expected from the contribution of new molecules only. The corresponding analysis procedure is to choose a transfer efficiency range that is selective mainly for one subpopulation, construct histograms for different recurrence intervals, and extract the fraction of a subpopulation versus time.
To determine the rates of interconversion, we need to relate the change in the recurrence E histogram with increasing recurrence time to the dynamics of the interconversion process. The following derivation is given for the case of a system populating two states A and B, but it can be extended to more complex kinetic schemes. We define the probability pA (τ,ΔE1) that from our set of burst pairs R(ΔE1,T) (Eq. 3), b2 originates from a molecule in state A (regardless of the identity of b1), where the recurrence interval T is chosen symmetrically around τ with a duration much less than the relaxation time of the system. pA (τ, ΔE1) can be determined from fitting the corresponding recurrence histogram and determining the ratio of the peak area corresponding to subpopulation A over the total area under the peaks corresponding to A and B.‡ Burst b2 originates either from the same (recurring) molecule i as b1 or from a new molecule j. Correspondingly, pA (τ, ΔE1) can be written as a sum of two terms,
| 4 |
where denotes the probability that a recurring molecule ( i = j ) is in state A, and is the probability that a newly arriving molecule ( i ≠ j ) (leading to burst b2) is in state A. is given by the equilibrium probability of measuring a burst originating from a molecule in state A and can be determined from the areas under the corresponding peak functions fitted to the full transfer efficiency histogram.
The time dependence of is determined by the interconversion kinetics between states A and B, and can be written as
| 5a |
with
| 5b |
Here, ρA(τ, ΔE1) is the probability that a protein that emitted a burst at time 0 with a transfer efficieny in the range ΔE1 is in state A at time τ (irrespective of whether it is detected at time τ or not). ρA(0,ΔE1) and are the corresponding initial and equilibrium probabilities, respectively. The kinetic rate constant λ corresponds to the sum of the forward and backward rate constants of interconversion between A and B. The parameter ε accounts for the possibility that the relative areas under the transfer efficiency histogram peaks do not reflect the true relative populations of states A and B present in the sample. ε =εB / εA is the ratio of the burst detection efficiencies for the two subpopulations. ε deviates from unity if the quantum efficiencies of the fluorophores are different in the different local environments in states A and B.§ For the case of equal burst detection efficiencies (ε = 1), . If needed, ε can be obtained from an independent experiment that provides the true equilibrium population of A, resulting in
Alternatively, the differences in brightness of molecules in the two states could be obtained from techniques for analyzing photon counting histograms 32, 33.
ρA(0, ΔE1 can be obtained by solving Eq. 5a for ρA(τ, ΔE1), setting τ = 0, and determining from the full transfer histogram peaks by integrating only over ΔE1. In a final step, the kinetic rate constant λ is obtained by fitting pA(τ,ΔE1) according to Eq. 4. Note that λ is the only fit parameter if ρA (0,ΔE1) and are determined as described above.
No interconversion on the recurrence time scale: CspTm
We use CspTm as an example for RASP that serves as a reference without interconversion dynamics. With a folding/unfolding relaxation rate constant of 4 s−1 for CspTm at 1.1 M GdmCl 14, we only expect a very small number of folding and unfolding events on the recurrence time scale of ~10 milliseconds. We selected three different initial transfer efficiency ranges ΔE1, which represent the acceptor-inactive, the unfolded, and the folded subpopulations (Fig. 9). The recurrence E histograms for different values of τ were constructed, and fit with Gaussian and lognormal functions constrained to the peak shapes and positions obtained from the histograms for recurrence intervals from 0 to 1 ms, which are dominated by the corresponding initial subpopulations. At longer τ, the other subpopulations appear, which is expected both from folding and unfolding and from the occurrence of new molecules. If the initial E range is chosen in the acceptor-inactive subpopulation, the appearance of high transfer efficiency molecules with increasing τ can be used as an alternative way of determining the amount of new molecules, and thus psame (Fig. 9d), because this subpopulation does not convert to any of the other subpopulations due to the irreversibility of acceptor bleaching. The time dependencies of the fractions of unfolded molecules in recurrence E histograms with initial E ranges representing the folded and the unfolded subpopulations, respectively, were fit globally with Eq.4, both without constraints, and with the folding/unfolding relaxation time set to the value known from stopped-flow measurements14 (Fig. 9e). The free fit yields a rate constant much smaller then 4 s−1, and in the accessible time range of up to 50 ms, it is indistinguishable within error from the fit with the constrained rate constant of 4 s−1. This indicates that the signal change is dominated by the appearance of new molecules and that the interconversion rate is too low to be detected on the recurrence time scale. The change in populations calculated from psame** is in good agreement with the observed values (Fig. 9e). Exchange between the subpopulations on the recurrence time scale should thus result in an additional change in populations with time that can be used to quantify the interconversion dynamics.
Interconversion on the recurrence time scale: spectrin R15
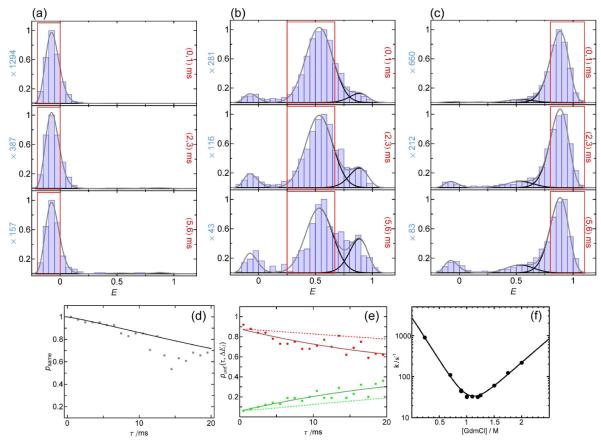
A good system to test the feasibility of determining interconversion dynamics with RASP is the spectrin domain R15. The folding of this extensively studied coiled coil protein is well described by a two-state model34, 35 with a relaxation rate constant of about 30 s−1 at 1.1 M GdmCl, close to the unfolding midpoint (Fig. 10f). Here, a variant of R15 labeled with Alexa 488 and Alexa 594 at positions 39 and 99 was investigated at 1.1 M GdmCl. The complete E histogram exhibits peaks at E = 0.54 and E = 0.86, corresponding to folded and unfolded molecules, respectively. Fig. 10 shows a selection of time-dependent recurrence E histograms starting from folded, unfolded, and acceptor-inactive molecules.
Figure 10.
Determining the folding kinetics of spectrin R15 in 1.1 M GdmCl with RASP. Recurrence E histograms with the initial E range corresponding to acceptor-inactive molecules (a) indicate the appearance of new molecules to be very small in the first 6 ms (recurrence intervals are indicated in each panel in red). Correspondingly, the appearance of the acceptor-active population in (a) (d, gray points) and the calculated psame change very little over this time. Starting from unfolded molecules (b), the appearance of folded molecules is thus due to folding transitions during the recurrence interval. Similarly, unfolding is detected starting from the folded subpopulation (c). The relaxation time from a global fit of the fractions of unfolded molecules (e) reveals a rate of 31 s−1, in excellent agreement with the ensemble value of 30 s−1 determined from ensemble stopped-flow experiments (f). The calculated curves expected in the absence of folding or unfolding dynamics (i.e. from the appearance of new molecules only) are shown as dashed lines.
The recurrence E histograms with ΔE1 corresponding to molecules with inactive acceptor (Fig. 10a) exhibit very little appearance of acceptor-active molecules on the time scale of 6 ms, as expected from burst time correlation analysis, which shows that 94% of the second bursts originate from recurring molecules between 5 and 6 ms. However, for the recurrence E histograms starting from unfolded (Fig. 10b) or folded (Fig. 10c) molecules, significant fractions of the other subpopulations appear over time. For longer recurrence times, the total number of relevant burst pairs per time decreases, resulting in a decreasing quality of the histograms. However, since the only free parameters for the histogram fits are the amplitudes of the three subpopulations, even histograms with only a few hundred bursts can be fit reasonably well. The resulting changes in the fractions of unfolded protein over time were fit globally with a relaxation rate constant of 31 s−1, in excellent agreement with the stopped-flow result of 30 s−1 (Fig. 10f), using the fraction of unfolded protein of 0.32 obtained from the complete E histogram as a constraint.
Rapid interconversion on the recurrence time scale: B domain of protein A
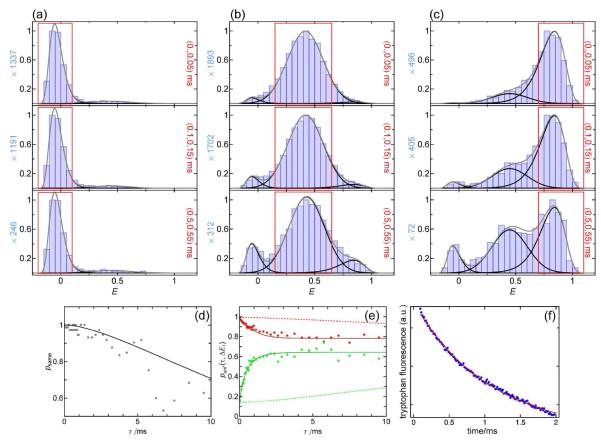
To probe the limitations in time resolution for a kinetic analysis with RASP, we chose the B domain of protein A (BdpA) from Staphylococcus aureus, which adopts a three helix bundle fold, and folds on a time scale of about 5 μs in the absence of denaturant 36, 37. The variant used here contains amino acid exchanges that facilitate characterization (F13W), speed up folding (G29A), and allow the specific incorporation of fluorescence dyes (Y14C, P57C). It has a folding relaxation rate constant of 0.93 ms−1 under the conditions investigated here, 2.5 M GdmCl and 37°C, close to the unfolding midpoint. (The rate constant was independently measured by laser-induced temperature jump experiments, see Fig. 11f) Again, the protein was labeled with Alexa Fluors 488 and 594 as FRET donor and acceptor, respectively. As the protein is expected to fold already during its diffusion time through the confocal volume, the photon emission rate was increased by using higher laser powers (300 μW), and a binning time of 50 μs was employed to maximize time resolution. Although such small bin sizes increase shot noise broadening, the quality of the fits is not reduced significantly, since the positions and widths of all subpopulations can be determined independently and are fixed for fitting the time-dependent recurrence E histograms.
Figure 11.
Determining the folding kinetics of BdpA in 2.5 M GdmCl at 37 °C with RASP. (a) Recurrence E histograms with the initial E range corresponding to acceptor-inactive molecules; the resulting psame(τ) is shown in (d). The respective recurrence intervals are indicated in each panel in red. (b, c) Recurrence E histograms with initial E ranges corresponding to mostly unfolded and folded molecules, respectively. The resulting fractions of unfolded molecules as a function of the recurrence time (e) show folding relaxation on the millisecond time scale. The resulting relaxation rate constant of 1.4 ms−1 is in good agreement with the rate constant of 0.93 ms−1 from laser temperature jump experiments where the intrinsic tryptophan fluorescence was monitored (f). The incomplete convergence of the fractions of unfolded molecules on the millisecond time scale (e) is presumably due to the presence of proline residues in BdpA that only isomerize on much longer time scales. The calculated curves expected in the absence of folding or unfolding dynamics (i.e. from the appearance of new molecules only) are shown as dashed lines.
Fig. 11 shows the results of the recurrence analysis of BdpA. Within 50 μs, the molecules rarely interconvert to other subpopulations, thus it is possible to determine the shapes of the individual peaks from the earliest recurrence E histograms. With increasing recurrence time, increasing populations of folded or unfolded molecules appear (Fig. 11b,c). The appearance of new molecules is still unlikely at this time, as only a very low fraction of acceptor-active molecules is observed in the recurrence E histograms starting from acceptor-inactive molecules (Fig. 11a). Fig. 11e summarizes the relaxation starting from folded and unfolded subpopulations. The lack of convergence of the fractions of unfolded molecules when starting from the folded and unfolded subpopulations, respectively, indicates that the system does not reach equilibrium on the millisecond time scale. This is expected because BdpA contains three proline residues, and on the recurrence time scale we thus observe only the folding of the protein molecules with all prolines in the trans conformation38. Since the unfolding reaction is not affected by proline isomerization, we obtain the final equilibrium fraction only for the unfolding, but not for the folding reaction. The relaxation rate constant obtained from a global fit is 1.4 ms−1, in good agreement with the result from temperature jump measurements of 0.93 ms−1 (Fig. 11f). In summary, RASP can thus be used to reliably determine interconversion kinetics between subpopulations from microsecond time scales to tens of milliseconds.
Experimental
Purification and labeling of CspTm (labeled at positions 2 and 67) were performed as described previously15. For the spectrin domain R15, cysteine residues were introduced by site-directed mutagenesis at positions 39 and 99, and the protein was expressed and purified as described previously34. For labeling, a 1.3:1 excess of reduced protein was incubated with Alexa Fluor 488 maleimide (Invitrogen) at 4°C for ~10 hours. Un-reacted dye was removed by gel filtration (G25 desalting; GE Healthcare Biosciences AB, Uppsala, Sweden) and the protein was incubated with Alexa Fluor 594 maleimide at room temperature for ~2 hours. Differently labeled variants were separated by ion-exchange chromatography (MonoQ HR 5/5; GE Healthcare Biosciences AB, Uppsala, Sweden). The gene encoding BdpA containing the mutations Y14C and P57C was created from the gene encoding F13W G29A BdpA by site-directed mutagenesis. The variant Y14C-P57C was over-expressed (in the plasmid pAED4) in Escherichia coli BL21 (DE3) cells and purified as described36. Labelling was carried out in a stepwise manner; initially 0.6 molar equivalents of Alexa 594 maleimide (Invitrogen) were added to reduced protein (20mM sodium citrate, pH 7). Singly labeled protein was purified using a ResourceQ ion exchange column and subsequently labeled by addition of 1.5 molar equivalents of Alexa Fluor 488 maleimide. The resulting double labeled protein was purified using a ResourceQ column and by gel filtration using a Superdex peptide HR 10/30 column. Proteins were shown to be pure using SDS PAGE and of the correct molecular weight using electrospray ionization mass spectrometry. All experiments were performed in buffer containing 0.001% Tween 20 to prevent surface adhesion of the polypeptides, and 20 mM cysteamine and 150 mM β-mercaptoethanol to reduce photo-damage. Protein concentrations for single molecule experiments were adjusted between 5 and 25 pM to obtain appropriate burst rates.
Ensemble folding and unfolding kinetics of R15 were monitored by the change in acceptor fluorescence (>590 nm) on an SX20 stopped-flow spectrometer (Applied Photophysics). The final protein concentration used was 10 nM in 50 mM sodium phosphate buffer (pH 7.0) and 0.001% Tween 20. At least six traces were averaged, and the data fitted to a single-exponential function. To avoid the influence of mixing artifacts, data collected in the first 2-3 ms were removed before fitting. Laser-induced temperature jump measurements of BdpA were performed using 10μM double-labeled protein at 37 °C in 2.5M GdmCl with the instrument described previously37. The relaxation kinetics after temperature jump from 27°C to 37°C were measured using the change in intrinsic tryptophan fluorescence.
Single-molecule fluorescence experiments were performed with a MicroTime 200 confocal microscope (PicoQuant, Berlin, Germany) equipped with a 488 nm diode laser (Sapphire 488-100 CDRH, Coherent, Santa Clara, CA) and an Olympus UplanApo 60×/1.20W objective. After passing through a 100 μm pinhole, sample fluorescence was separated into donor and acceptor components using a dichroic mirror (585DCXR, Chroma, Rockingham, VT). After passing appropriate filters (Chroma ET525/50M, HQ650/100), each component was focused onto avalanche photodiodes (SPCM-AQR-15, PerkinElmer Optoelectronics, Vaudreuil, QC, Canada), and the arrival time of every detected photon was recorded using suitable counting electronics (Hydra Harp, PicoQuant, Berlin, Germany). Measurements were performed with laser powers as indicated in Supplementary Table 1.
Burst identification was performed in two steps. First, consequent photons detected in either channel and separated by less than 100 μs were combined into one burst. A burst was retained as a significant event if the total number of counts exceeded values between 25 and 80, depending on the measurement (see supplementary table 1). In a second step, all photons not assigned to bursts were discarded. The remaining photons were binned with different time intervals between 50 μs and 1 ms (see supplementary table 1), and bins with more than 15 to 25 photons (see supplementary table 1) were retained for further analysis. This approach combines the advantage of identifying the beginning and end of a burst accurately39 with the possibility of a stringent analysis of the data in terms of burst time correlations. Identified bursts were corrected for background, differences in quantum yields of donor and acceptor, the different collection efficiencies in the detection channels, cross-talk, and direct acceptor excitation as described previously9. The results were robust with respect to the choice of thresholds. To optimize burst statistics, data acquisition times were in the range of 8 to 20 hours.
Conclusions
The examples presented here clearly indicate that recurrence analysis can be used to extend the information available from single molecule FRET experiments on freely diffusing molecules. Burst time correlation allows us to quantify the probability psame that a fluorescence burst originated from a recurring molecule, and to investigate correlations within and between subpopulations in FRET efficiency histograms. Based on these concepts, recurrence transfer efficiency histograms were developed to assess the heterogeneity in a sample and determine the positions and widths of the FRET efficiency peaks of the underlying subpopulations, essentially in a model-free way. We illustrated this approach with several proteins and peptides that exhibit different degrees of structural heterogeneity. The resulting peak shapes can be used as constraints for quantifying the contributions of the subpopulations to the complete E histogram, which greatly improves the accuracy of this type of analysis.
Recurrence transfer efficiency contour plots further extend this concept and can be used to detect even very small subpopulations and to identify interconversion between subpopulations on the recurrence time scale. By taking into account the dependence of psame on the recurrence interval, interconversion rates can be determined quantitatively. Our analysis of the folding dynamics of three small proteins shows that kinetics on time scales from about 50 μs to tens of milliseconds are accessible. This procedure allows a very simple determination of reaction rates from standard free diffusion experiments and extends accessible time scales into a range shorter than available from stopped-flow or single molecule microfluidic mixing experiments40-42, and much longer than accessible from individual bursts. The available times can be extended further by reducing the protein concentration to increase psame, and the statistics can be improved by increasing the acquisition time. RASP is not restricted to the comparison of different bursts from the same molecule; for data with sufficient photon rates, it can equally be applied to different parts of a burst (Fig. 11). The method thus complements the analysis of conventional FCS, which can provide information about conformational dynamics on the nanosecond to microsecond timescale10, 43-45.
Besides conformational heterogeneity and dynamics, RASP can also be helpful for identifying unwanted photophysical and photochemical effects. Photobleaching of the chromophores limits both the duration of fluorescence recordings from immobilized samples and the laser intensities and photon rates in diffusion experiments. Recurrence analysis offers a simple approach for quantifying the effect of photobleaching (Figs. 6-8) and might be useful for evaluating additives that improve photostability28, 29, 46. Another photophysical effect that can interfere with FRET analysis is blinking, i.e. the intermittent cessation of fluorescence emission from a dye. Burst time correlation can be employed to identify the presence of blinking on the recurrence time scale (Fig. 3).
Finally, we would like to point out that, although in the examples presented here only the FRET efficiency was analyzed in detail, RASP can be extended to any parameter that can be extracted from a fluorescence burst or part of a burst, such as fluorescence lifetimes, anisotropies, burst duration, etc. Including this additional information will further improve the resolution of the method. Additionally, it will obviously be valuable to combine RASP with a rigorous treatment of photon statistics20, 22-26, e.g. by using the peak positions identified by RASP as a starting point for calculating FRET efficiency histograms or for modeling interconversion dynamics. The analysis of more complex kinetics or heterogeneous FRET efficiency distributions may benefit from a combination with singular value decomposition47 or related approaches. In summary, we expect recurrence analysis to become a valuable and versatile tool for characterizing conformational heterogeneity and dynamics with single molecule FRET experiments.
Supplementary Information
Acknowledgements
We thank Frank Hillger for pointing out the recurrence effect in single molecule FRET experiments and for stimulating discussion in the early stages of the project, Irina Gopich for very helpful comments on the manuscript, Terrence Oas for supplying the gene for F13WG29A BdpA, and Graham Spence and Alastair Smith for help with the temperature jump experiments. This work was supported by the Swiss National Science Foundation (B.S.), the Swiss National Center of Competence in Research for Structural Biology (B.S.), a Starting Grant of the European Research Council (SingleMolFolding, B.S.), and by the Wellcome Trust (J. Clarke, grant number 064417). J. Clarke is a Wellcome Trust Senior Research Fellow. J. Clark was partially funded by a studentship from the Biotechnology and Biological Sciences Research Council.
Footnotes
As a time binning is required to calculate the correlation values from experimental data, τ corresponds to the mean time of the interval [τ-Δτ, τ+Δτ], where the size of the interval (i.e. 2 Δτ) equals the bin size used for burst identification. Note that the same bin size as for psame(τ) was used for obtaining pA(τ, ΔE1) in Eq.4 (see Supplementary Table 1 for details).
Peaks at low and high transfer efficiencies are expected to deviate from a radially symmetric shape due to the asymmetry of the β distribution16.
For fitting the recurrence histograms and extracting pA(τ, ΔE1), we take full advantage of recurrence analysis for independently determining the shapes and positions of all peaks (e.g. see fits in Fig. 9), which strongly increases the reliability of the method.
Another possible source for ε ≠ 1 are different mean diffusion times of molecules in states A and B trough the confocal volume, which will lead to larger bursts and preferential detection of the more slowly diffusing species. In this case, psame(τ) in Eq.4 will also depend on the initial transfer efficiency range, and will be given by psame(τ, ΔE1)=1−1/ gB1B2 (τ), where B1 is the set of all bursts with transfer efficiencies within ΔE1, and B2 is the set of all identified bursts. For the three proteins discussed in this work, the differences in diffusion times for the unfolded and folded states did not have a detectable effect on the analysis.
References
- 1.Van Der Meer BW, Coker G, III, Chen SYS. Resonance energy transfer: theory and data. VCH Publishers, Inc.; New York: 1994. [Google Scholar]
- 2.Stryer L. Annu. Rev. Biochem. 1978;47:819–846. doi: 10.1146/annurev.bi.47.070178.004131. [DOI] [PubMed] [Google Scholar]
- 3.Michalet X, Weiss S, Jäger M. Chem. Rev. 2006;106:1785–1813. doi: 10.1021/cr0404343. [DOI] [PMC free article] [PubMed] [Google Scholar]
- 4.Haran G. J. Phys.-Condens. Matter. 2003;15:R1291–R1317. [Google Scholar]
- 5.Selvin PR, Ha T. Single-Molecule Techniques: A Laboratory Manual. Cold Spring Harbor Laboratory Press; New York: 2008. [Google Scholar]
- 6.Schuler B, Eaton WA. Curr. Opin. Struct. Biol. 2008;18:16–26. doi: 10.1016/j.sbi.2007.12.003. [DOI] [PMC free article] [PubMed] [Google Scholar]
- 7.Sisamakis E, Valeri A, Kalinin S, Rothwell PJ, Seidel CAM. Methods Enzymol. 2010;475:455–514. doi: 10.1016/S0076-6879(10)75018-7. [DOI] [PubMed] [Google Scholar]
- 8.Deniz AA, Laurence TA, Dahan M, Chemla DS, Schultz PG, Weiss S. Annu. Rev. Phys. Chem. 2001;52:233–253. doi: 10.1146/annurev.physchem.52.1.233. [DOI] [PubMed] [Google Scholar]
- 9.Schuler B. Methods. Mol. Biol. 2007;350:115–138. doi: 10.1385/1-59745-189-4:115. [DOI] [PubMed] [Google Scholar]
- 10.Rigler R, Elson ES. Flourescence Correlation Spectroscopy: Theory and Applications. Springer; Berlin: 2001. [Google Scholar]
- 11.Földes-Papp Z. Exp Mol Pathol. 2007;82:147–155. doi: 10.1016/j.yexmp.2006.12.002. [DOI] [PubMed] [Google Scholar]
- 12.Zumofen G, Hohlbein J, Hubner CG. Phys Rev Lett. 2004;93 doi: 10.1103/PhysRevLett.93.260601. [DOI] [PubMed] [Google Scholar]
- 13.Edel JB, Hill EK, de Mello AJ. Analyst. 2001;126:1953–1957. doi: 10.1039/b106559a. [DOI] [PubMed] [Google Scholar]
- 14.Schuler B, Lipman EA, Eaton WA. Nature. 2002;419:743–747. doi: 10.1038/nature01060. [DOI] [PubMed] [Google Scholar]
- 15.Hoffmann A, Kane A, Nettels D, Hertzog DE, Baumgärtel P, Lengefeld J, Reichardt G, Horsley DA, Seckler R, Bakajin O, Schuler B. Proc. Natl. Acad. Sci. USA. 2007;104:105–110. doi: 10.1073/pnas.0604353104. [DOI] [PMC free article] [PubMed] [Google Scholar]
- 16.Schuler B, Lipman EA, Steinbach PJ, Kumke M, Eaton WA. Proc. Natl. Acad. Sci. USA. 2005;102:2754–2759. doi: 10.1073/pnas.0408164102. [DOI] [PMC free article] [PubMed] [Google Scholar]
- 17.Watkins LP, Chang HY, Yang H. J. Phys. Chem. A. 2006;110:5191–5203. doi: 10.1021/jp055886d. [DOI] [PubMed] [Google Scholar]
- 18.Doose S, Neuweiler H, Barsch H, Sauer M. Proc. Natl. Acad. Sci. USA. 2007;104:17400–17405. doi: 10.1073/pnas.0705605104. [DOI] [PMC free article] [PubMed] [Google Scholar]
- 19.Best R, Merchant K, Gopich IV, Schuler B, Bax A, Eaton WA. Proc. Natl. Acad. Sci. USA. 2007;104:18964–18969. doi: 10.1073/pnas.0709567104. [DOI] [PMC free article] [PubMed] [Google Scholar]
- 20.Gopich IV, Szabo A. J. Phys. Chem. B. 2009;113:10965–10973. doi: 10.1021/jp903671p. [DOI] [PMC free article] [PubMed] [Google Scholar]
- 21.Merchant KA, Best RB, Louis JM, Gopich IV, Eaton WA. Proc. Natl. Acad. Sci. USA. 2007;104:1528–1533. doi: 10.1073/pnas.0607097104. [DOI] [PMC free article] [PubMed] [Google Scholar]
- 22.Gopich IV, Szabo A. J. Chem. Phys. 2005;122:1–18. doi: 10.1063/1.1812746. [DOI] [PubMed] [Google Scholar]
- 23.Gopich IV, Szabo A. J. Phys. Chem. B. 2007;111:12925–12932. doi: 10.1021/jp075255e. [DOI] [PubMed] [Google Scholar]
- 24.Gopich IV, Szabo A. In: Theory and Evaluation of Single-Molecule Signals. Barkai E, Brown FLH, Orrit M, Yang H, editors. World Scientific Pub. Co.; Singapore: 2009. pp. 1–64. [Google Scholar]
- 25.Nir E, Michalet X, Hamadani KM, Laurence TA, Neuhauser D, Kovchegov Y, Weiss S. J. Phys. Chem. B. 2006;110:22103–22124. doi: 10.1021/jp063483n. [DOI] [PMC free article] [PubMed] [Google Scholar]
- 26.Antonik M, Felekyan S, Gaiduk A, Seidel CAM. J. Phys. Chem. B. 2006;110:6970–6978. doi: 10.1021/jp057257+. [DOI] [PubMed] [Google Scholar]
- 27.Jeener J, Meier BH, Bachmann P, Ernst RR. J Chem Phys. 1979;71:4546–4553. [Google Scholar]
- 28.Rasnik I, McKinney SA, Ha T. Nat. Methods. 2006;3:891–893. doi: 10.1038/nmeth934. [DOI] [PubMed] [Google Scholar]
- 29.Vogelsang J, Kasper R, Steinhauer C, Person B, Heilemann M, Sauer M, Tinnefeld P. Angew. Chem. Int. Ed. Engl. 2008;47:5465–5469. doi: 10.1002/anie.200801518. [DOI] [PubMed] [Google Scholar]
- 30.Chung HS, Louis JM, Eaton WA. Proc. Natl. Acad. Sci. USA. 2009;106:11837–11844. doi: 10.1073/pnas.0901178106. [DOI] [PMC free article] [PubMed] [Google Scholar]
- 31.Rösgen J, Pettitt BM, Bolen DW. Biophys. J. 2005;89:2988–2997. doi: 10.1529/biophysj.105.067330. [DOI] [PMC free article] [PubMed] [Google Scholar]
- 32.Chen Y, Muller JD, So PT, Gratton E. Biophys. J. 1999;77:553–567. doi: 10.1016/S0006-3495(99)76912-2. [DOI] [PMC free article] [PubMed] [Google Scholar]
- 33.Kask P, Palo K, Ullmann D, Gall K. Proc. Natl. Acad. Sci. USA. 1999;96:13756–13761. doi: 10.1073/pnas.96.24.13756. [DOI] [PMC free article] [PubMed] [Google Scholar]
- 34.Scott KA, Batey S, Hooton KA, Clarke J. J Mol Biol. 2004;344:195–205. doi: 10.1016/j.jmb.2004.09.037. [DOI] [PubMed] [Google Scholar]
- 35.Wensley BG, Batey S, Bone FAC, Chan ZM, Tumelty NR, Steward A, Kwa LG, Borgia A, Clarke J. Nature. 2010;463:685–U122. doi: 10.1038/nature08743. [DOI] [PMC free article] [PubMed] [Google Scholar]
- 36.Myers JK, Oas TG. Nat. Struct. Biol. 2001;8:552–558. doi: 10.1038/88626. [DOI] [PubMed] [Google Scholar]
- 37.Dimitriadis G, Drysdale A, Myers JK, Arora P, Radford SE, Oas TG, Smith DA. Proc. Natl. Acad. Sci. USA. 2004;101:3809–3814. doi: 10.1073/pnas.0306433101. [DOI] [PMC free article] [PubMed] [Google Scholar]
- 38.Kiefhaber T, Kohler HH, Schmid FX. J. Mol. Biol. 1992;224:217–229. doi: 10.1016/0022-2836(92)90585-8. issn: 0022-2836. [DOI] [PubMed] [Google Scholar]
- 39.Eggeling C, Berger S, Brand L, Fries JR, Schaffer J, Volkmer A, Seidel CA. J. Biotechnol. 2001;86:163–180. doi: 10.1016/s0168-1656(00)00412-0. [DOI] [PubMed] [Google Scholar]
- 40.Lipman EA, Schuler B, Bakajin O, Eaton WA. Science. 2003;301:1233–1235. doi: 10.1126/science.1085399. [DOI] [PubMed] [Google Scholar]
- 41.Pfeil SH, Wickersham CE, Hoffmann A, Lipman EA. Rev. Sci. Instrum. 2009;80:055105. doi: 10.1063/1.3125643. [DOI] [PubMed] [Google Scholar]
- 42.Hamadani KM, Weiss S. Biophys. J. 2008;95:352–365. doi: 10.1529/biophysj.107.127431. [DOI] [PMC free article] [PubMed] [Google Scholar]
- 43.Nettels D, Gopich IV, Hoffmann A, Schuler B. Proc. Natl. Acad. Sci. USA. 2007;104:2655–2660. doi: 10.1073/pnas.0611093104. [DOI] [PMC free article] [PubMed] [Google Scholar]
- 44.Gopich IV, Nettels D, Schuler B, Szabo A. J. Chem. Phys. 2009;131:095102. doi: 10.1063/1.3212597. [DOI] [PMC free article] [PubMed] [Google Scholar]
- 45.Neuweiler H, Schulz A, Bohmer M, Enderlein J, Sauer M. J. Am. Chem. Soc. 2003;125:5324–5330. doi: 10.1021/ja034040p. [DOI] [PubMed] [Google Scholar]
- 46.Widengren J, Chmyrov A, Eggeling C, Lofdahl PA, Seidel CAM. J. Phys. Chem. A. 2007;111:429–440. doi: 10.1021/jp0646325. [DOI] [PubMed] [Google Scholar]
- 47.Hofmann H, Hillger F, Pfeil SH, Hoffmann A, Streich D, Haenni D, Nettels D, Lipman EA, Schuler B. Proc Natl Acad Sci U S A. 2010;107:11793–11798. doi: 10.1073/pnas.1002356107. [DOI] [PMC free article] [PubMed] [Google Scholar]
Associated Data
This section collects any data citations, data availability statements, or supplementary materials included in this article.


