

Abstract
Improved understanding of the sources of air pollution that are most harmful could aid in developing more effective measures for protecting human health. The Denver Aerosol Sources and Health (DASH) study was designed to identify the sources of ambient fine particulate matter (PM2.5) that are most responsible for the adverse health effects of short-term exposure to PM 2.5. Daily 24-hour PM2.5 sampling began in July 2002 at a residential monitoring site in Denver, Colorado, using both Teflon and quartz filter samplers. Sampling is planned to continue through 2008. Chemical speciation is being carried out for mass, inorganic ionic compounds (sulfate, nitrate and ammonium), and carbonaceous components, including elemental carbon, organic carbon, temperature-resolved organic carbon fractions and a large array of organic compounds. In addition, water soluble metals were measured daily for 12 months in 2003. A receptor-based source apportionment approach utilizing positive matrix factorization (PMF) will be used to identify PM 2.5 source contributions for each 24-hour period. Based on a preliminary assessment using synthetic data, the proposed source apportionment should be able to identify many important sources on a daily basis, including secondary ammonium nitrate and ammonium sulfate, diesel vehicle exhaust, road dust, wood combustion and vegetative debris. Meat cooking, gasoline vehicle exhaust and natural gas combustion were more challenging for PMF to accurately identify due to high detection limits for certain organic molecular marker compounds. Measurements of these compounds are being improved and supplemented with additional organic molecular marker compounds. The health study will investigate associations between daily source contributions and an array of health endpoints, including daily mortality and hospitalizations and measures of asthma control in asthmatic children. Findings from the DASH study, in addition to being of interest to policymakers, by identifying harmful PM2.5 sources may provide insights into mechanisms of PM effect.
Keywords: air pollution, particulate matter, health effects, mortality, source apportionment
1. Introduction
Findings from observational epidemiology studies on the adverse health effects of ambient particulate matter (PM) and other pollutants indicate effects of short-term concentration changes on mortality and morbidity (Dominici et al., 2003; Pope and Dockery, 2006). As a surrogate for exposure, these studies have primarily relied on outdoor PM mass concentrations measured at one or more monitoring sites distributed over large urban areas. An important finding in recent observational studies is that there appears to be heterogeneity between urban areas in the magnitude of the observed acute effect of particulate air pollution (Samet et al., 2000; Dominici et al., 2003). The causes of this heterogeneity are not known. The PM contribution from various sources, and hence the chemical composition of PM, varies by location (US-EPA, 2004). If PM toxicity is dependent on its chemical composition, variability of PM source contributions could be one explanation for the heterogeneity of effects. Evaluating associations between source contributions and health effects may thus provide insight into the heterogeneity between urban areas.
The National Research Council has stressed the need to understand the comparative toxicity of PM from different sources and recommended the use of source apportionment methods (NRC, 2004). To date, a limited number of air pollution health studies have used source apportionment to investigate mortality effects (Laden et al., 2000; Mar et al., 2000, 2006; Tsai, Apte and Daisey, 2000; Ito et al., 2006), as well as effects on hospitalizations (Anderson et al., 2007) and emergency room visits (Schreuder et al., 2006; Sarnat et al., 2008). The Denver Aerosol Sources and Health (DASH) study is designed to investigate effects of exposure to sources of fine particulate matter (PM2.5) on an array of health endpoints by incorporating detailed daily PM2.5 chemical speciation data and state-of-the-art source apportionment into a health study.
Several options are available to identify the role of time-varying pollutant sources in the context of a health study. Concentrations of specific source markers have been used for this purpose (Laden et al., 2000), but valid markers for many sources of interest are not available. Deterministic air quality models can estimate contributions of sources at specific locations at 4 km or finer grid resolution (Held et al., 2005), but their ability to reproduce short-term variations is limited, due in part to the lack of temporally resolved emissions information (Marmur et al., 2006). Receptor-based source apportionment approaches use PM component concentrations measured at a monitoring site to estimate site-specific source contributions to PM concentrations. Receptor models have been used to help identify PM sources in numerous geographical regions (Maykut et al., 2003; Hopke et al., 2003; Schauer et al., 1996; Long et al., 2005; Lewis et al., 2003). These models either use a chemical mass balance (CMB) approach, which requires detailed information about the chemical composition of sources in a region, or use multivariate factor analysis methods, for example, positive matrix factorization (PMF) or UNMIX, to identify sources based on the temporal patterns among chemical components measured at the receptor(s). These multivariate approaches have the advantage of not requiring prior information on static source profiles, although source profile information is still needed to identify factors extracted from multivariate methods and unambiguous factor identification is not always possible. An important objective of the DASH study is to evaluate the utility of PMF for identifying short-term pollution source contributions to the ambient PM2.5 in a large urban area.
This paper provides an overview and introduction to the DASH study, focusing on the PM2.5 characterization methods used and the source apportionment techniques being employed. Interim 4.5-year PM2.5 species concentrations are also presented. In addition, model validation efforts using synthetic data are presented and discussed. Model uncertainty will be explored using a novel method based on a bootstrap approach and neural networks (Hemann et al., 2008). Companion papers describe in more detail the PM2.5 monitoring and chemical analysis protocols, as well as the methodology for point-wise uncertainty estimation (Dutton et al., 2008a, 2008b). Subsequent papers will detail results of PM2.5 species trends, source apportionment and epidemiological analyses.
2. Methods
2.1 PM2.5 Collection and Characterization
2.1.1 Core Receptor Site Monitoring
A residential site on the roof of Palmer Elementary School located 5.3 km east of downtown Denver was selected as the receptor site for detailed PM2.5 chemical speciation (Figure 1). This site was selected for its central location in a large residential community and for its distance from point and mobile sources. The school is 5.2 km from the closest large highway and at least 0.6 km from the closest commuter street. Collection of daily 24-hour PM2.5 samples from this site has been ongoing since July 1, 2002.
Figure 1.

Shown is a map of the Denver metropolitan area, including the five counties included in the DASH study and the locations of the residential monitoring site (star) and the STN site in Commerce City (circle).
PM2.5 samples were collected daily from midnight to midnight on both Teflon and quartz fiber filters with sampling equipment that has been used extensively in air quality studies in the past (Lough, Schauer and Lawson, 2006; Christoforou et al., 2000). The sampling protocol and the bulk chemical analysis methods briefly described below are presented in more detail in Dutton et al., (2008a). A list of all species being analyzed is contained in Table S1 in the online supplementary data.
2.1.2 Bulk Chemical Analyses
Bulk chemical speciation of all samples includes the quantification of PM2.5 mass, inorganic ionic compounds (sulfate, nitrate, and ammonium), elemental carbon (EC) and organic carbon (OC). Gravitational mass measurements are made using a microbalance housed in a temperature and humidity controlled chamber with filter weighing methods patterned after those approved by the EPA for PM2.5 mass determination (US-EPA, 1998). Inorganic ionic compounds (sulfate, nitrate and ammonium) are quantified using an ion chromatograph following traditional methodology for airborne particulate matter (Mueller et al., 1978). Bulk EC and OC concentrations are determined by NIOSH Method 5040; a 1.5 cm2 punch is taken from each quartz fiber filter and sent to the Wisconsin State Laboratory of Hygiene for analysis.
2.1.3 Organic Compound Chemical Analysis
Methods for the detailed organic chemical analysis of quartz fiber filter samples using solvent extraction and gas chromatography/mass spectrometry (GC/MS) have been developed previously (Mazurek et al., 1987; Fraser et al., 1996; Schauer et al., 1998; Hannigan et al., 1998) and similar methods were used in this study. High volume injection (50 μl) was incorporated by way of a programmable temperature vaporization inlet, thereby improving detection limits for trace level organic compounds (Crimmins and Baker, 2006). Detailed description of the organic speciation methods is included in Dutton et al. (2008b).
2.1.4 Quality Control and Uncertainty Estimation
Proper quality assurance and quality control are essential for prevention of contamination and for ensuring consistent chemical quantification. Consistency is especially important for a time series study. To assess contamination, weekly field blank filters are collected, extracted, and analyzed following the same procedures used for the daily sample filters. The field blanks were used to detect contamination coming from the filter substrates, handling or contaminated solvents and supplies and were used to perform blank subtraction on the daily measurements to adjust for these and other sampling artifacts.
To assure consistent and robust chemical quantification and to assist in uncertainty estimation, bi-weekly duplicate samples were collected on collocated samplers. These duplicate samples were analyzed in parallel with the main samples allowing for a direct comparison of duplicated measurements over all chemical analyses performed. Consistent and robust chemical quantification also involves instrument and equipment calibration, which is achieved by routinely calibrating all chemical analysis equipment with authentic standards. Complete details on quality control and uncertainty estimation are presented in Dutton et al. (2008a).
2.1.5 Supplemental Monitoring Data
Speciation for trace metals was done for one year on the 2003 filters. Water soluble trace metal chemical analysis was performed using an Inductively-Coupled Plasma Mass Spectrometer (ICP/MS) housed in a dedicated laboratory at the Wisconsin State Laboratory of Hygiene. Analytical details and results from this supplemental analysis will be presented elsewhere.
In addition to the data collected at the DASH core receptor site, the Air Pollution Control Division of the Colorado Department of Public Health and Environment (CDPHE) operates and maintains a network of ambient pollutant monitoring stations for the Denver metropolitan region. The network in this region consists of 14 community monitoring stations providing hourly measurements of the following: PM10 at 3 sites, PM2.5 at 4 sites, ozone at 9 sites, carbon monoxide at 6 sites, sulfur dioxide at 2 sites, nitrogen oxides at 2 sites, and meteorology at 11 sites. In addition to the hourly monitors, there are 7 PM10 and 6 PM2.5 sites collecting 24-hour samples and one Speciation Trends Network (STN) site providing speciated PM2.5 measurements every 6th day for inorganic ions, total elemental and organic carbon and trace metals. These data will be utilized in the PMF modeling effort.
2.2 PM2.5 Source Apportionment Model
PMF multivariate receptor modeling was chosen to evaluate the source contributions of the time series of receptor samples. PMF incorporates uncertainty estimates of the data to solve matrix factorization of a linear model as a constrained, weighted least-squares problem. For this study, point-wise uncertainty estimates incorporating sampling uncertainty, detection limits, missing data observations, and outliers are used to weight each data point. The least-squares approach used in PMF also permits the inclusion of additional constraints as a key part of the analysis, such as nonnegativity constraints.
2.2.1 The PMF Model
In the context of air quality source apportionment, PMF attempts to apportion a matrix of observations, X, composed of individual observations xij (i=1…n, j=1…m) into p distinct factors according to the model:
| Equation 1 |
In Equation 1, gik represents the absolute contribution (μg/m3) of factor k to sample i, fkj represents the relative fraction (μg/μg) of species j in factor k, and εij is the residual of the model. The xij consist of measurements of m chemical components in n different samples. PMF solves Equation 1 by minimizing Q, the sum of the squared, scaled residuals, defined by:
| Equation 2 |
where sij is an estimate of the uncertainty in the measurement xij. A positivity constraint is applied to gik and fkj, thus providing a more physically interpretable result. Written in matrix notation, Equation 1 simplifies to:
| Equation 3 |
where G is subsequently referred to as the factor contribution matrix and F the factor profile matrix.
With some prior knowledge and experience, the PMF factors can often be linked to pollution sources. Because source emissions are spatially and temporally variable, the factor profiles should be interpreted as a qualitative guide to the types of sources to which people are exposed and are qualitatively related to profiles published in the literature. The inclusion of molecular markers unique to specific source types assists in identifying the association between factor and source type.
2.2.2 PMF Model Validation
Similar to the PM2.5 characterization efforts, there is substantial investment in exploring the quality and validity of the PMF results. One approach to exploring the performance of a source apportionment model is to use synthetic data (Miller et al., 2002; Brinkman et al., 2006). A synthetic data set was developed to represent the PM2.5 data that were being gathered at the receptor site in Denver and analyzed using the PMF2 algorithm (Paatero et al., 1997). The creation of the synthetic data set was based on the methods employed in Brinkman et al. (2006); differences are highlighted. Briefly, synthetic estimates of factor contributions (Gsyn) and factor profiles (Fsyn) for several PM2.5 sources were created and combined into a synthetic observation matrix Xsyn=GsynFsyn. One year of daily observations were simulated, comprised of 39 chemical species from nine predefined sources (secondary ammonium nitrate and sulfate, gasoline and diesel vehicle exhaust, road dust, wood combustion, meat cooking, natural gas combustion and vegetative debris). These sources were chosen based on their importance for the region as identified by the 1996–1997 Northern Front Range Air Quality Study (NFRAQS) (Watson et al., 1998). Source profiles containing bulk species and organic molecular markers were obtained from the literature as cited in Brinkman et al. (2006). Limitations on the number of species included in the synthetic data set were imposed by source profile availability; Table S2 in the online supplementary data identifies the 39 species included in the synthetic data exercise. Temporal patterns such as seasonality and weekday/weekend differences were accounted for in the factor contributions. To incorporate temporal correlations between the synthetic source contributions resulting from meteorology, the source contributions representing secondary ammonium nitrate and ammonium sulfate, wood combustion and natural gas combustion were scaled by temperature. Further correlations between sources arose from the hypothesized temporal patterns (e.g., gasoline and diesel powered motor vehicles, paved road dust, wood combustion and meat cooking all contained a weekday/weekend dependence). Table S3 in the online supplementary data shows the correlations between the synthetic source contributions. Finally, the source contributions were scaled such that their daily sum added up to the actual daily PM2.5 mass measured during 2003. Normally distributed random noise was added to the synthetic observations xij based on measurement uncertainty, detection limits and detection limit uncertainty associated with the analytical techniques typically used to speciate PM2.5 filter samples (Brinkman et al., 2006). The synthetic observations and estimated measurement uncertainties were input into PMF, which in turn provided modeled estimates of the factor contributions and profiles (Gpmf and Fpmf, respectively). These were compared (see Results) with the known synthetic input matrices, Gsyn and Fsyn, to evaluate the performance of the PMF model with this synthetic dataset.
2.2.3 PMF Model Uncertainty
There are several sources of uncertainty in a PMF model solution that can affect the validity of the source estimates. One source of uncertainty results from measurement error and random sampling error in the data. Uncertainty can also come from the PMF model itself due to rotational ambiguity in the solutions. In addition, solutions can vary depending on the values selected for model parameters including the number of factors and the parameters used to control rotations and down-weighting of outliers. As part of this study, Hemann et al. (2008) developed a novel method to estimate daily factor contribution uncertainties that are due to random sampling error. A balanced bootstrap technique will be used to create replicate datasets from the PM2.5 time series, each of which will be modeled independently using PMF. Neural networks will be trained to classify the replicate factors based upon chemical profiles so factor orderings can be aligned across results associated with the replicate datasets. Factor contribution uncertainty will be assessed from the distribution of contributions associated with each factor.
2.3 Health Endpoints
Only a brief overview of the health endpoints that will be included in the initial DASH health analyses will be presented here. Endpoints include counts of daily mortality and daily hospitalizations, and measures of asthma control in a panel of asthmatic school children. Daily total and cause-specific mortality counts for 5-county metropolitan Denver are obtained from the Colorado Health Information Dataset compiled by the CDPHE. Medicare data on daily non-elective (i.e., emergency and urgent) hospitalizations for the population age 65 years and older are obtained from the Medicare Provider Analysis and Review (MedPAR) file and purchased from the Centers for Medicare and Medicaid Services (CMS; formerly Hospital Care Financing Administration [HCFA]). Specific admission diagnoses of interest will be respiratory hospitalization, including the subcategories of asthma and chronic obstructive pulmonary disease, and cardiovascular hospitalization, including the subcategories of myocardial infarction and congestive heart failure
An ongoing panel study of grade school children with asthma in Denver is used to provide daily asthma health endpoint data (Rabinovitch et al., 2004; Rabinovitch, Strand and Gelfand, 2006). Children aged 6–13 who attended the Kunsberg School at the National Jewish Medical and Research Center (NJMRC) and had physician-diagnosed asthma were studied over 3 consecutive winters. In the first winter (2002–2003), 57 schoolchildren participated, 43 participated the next year and 45 children participated in the final year. Endpoint measures include recording of daily asthma medication use and daily measurement of level of lung function.
3. Results
3.1 PM2.5 Characterization
Data on PM2.5 mass concentration and an abbreviated set of speciated components from the start of monitoring in July 2002 through December 2006 are available at this time. Table 1 shows descriptive data on 24-hour average concentrations of PM2.5, inorganic ions and bulk carbon. These data, together with the 2003 supplemental metals data, were used to generate the annual average PM2.5 chemical composition chart shown in Figure 2. In this figure, OC has been converted to organic carbon mass by multiplying by a factor of 1.41 required for mass closure. This factor agrees well with the 1.2 – 1.4 range frequently reported in the literature, originally proposed by White and Roberts (1977) and is within the range of 1.6 ± 0.2 reported for urban fresh aerosols (Turpin and Lim, 2001; Pang, Turpin and Gundel, 2006).
Table 1.
Descriptive data on PM2.5 and PM2.5 component mass concentrations, July 1, 2002 – December 31, 2006.
| N | Mean | SD | Minimum | Percentile
|
Maximum | |||
|---|---|---|---|---|---|---|---|---|
| 25th | 50th | 75th | ||||||
| PM2.5 (μg/m3) | 1628 | 7.81 | 4.93 | −1.17 | 4.79 | 6.78 | 9.24 | 40.53 |
| sulfate (μg/m3) | 1628 | 1.10 | 0.97 | 0.02 | 0.54 | 0.90 | 1.33 | 11.04 |
| nitrate (μg/m3) | 1628 | 0.98 | 1.80 | 0.00 | 0.12 | 0.22 | 0.93 | 16.48 |
| EC (μg/m3)1 | 1586 | 0.55 | 0.37 | 0.00 | 0.30 | 0.46 | 0.69 | 3.13 |
| OC (μg/m3)1 | 1586 | 3.06 | 1.39 | 0.23 | 2.13 | 2.86 | 3.76 | 12.65 |
EC = elemental carbon; OC = organic carbon
Figure 2.
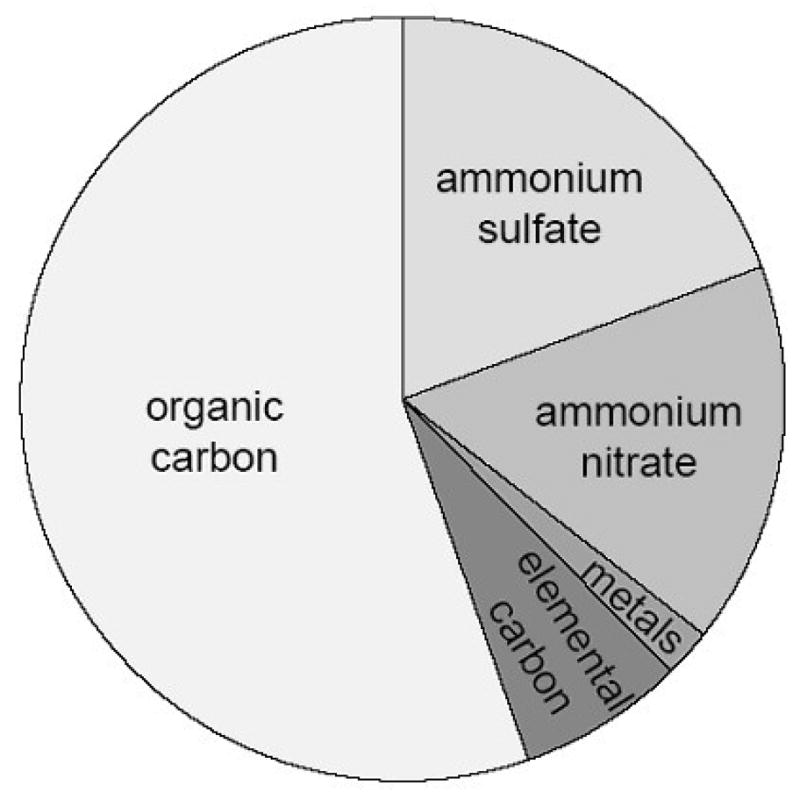
Average composition of PM2.5 incorporating 4.5 years of speciated measurements at the DASH residential monitoring site. Organic carbon has been converted to organic carbon mass by multiplying by a factor of 1.41 required for mass closure.
To assess the adequacy of our residential monitoring site in reflecting temporal patterns in PM2.5 components across the Denver metropolitan area, PM2.5 component time series data were examined from the only other site in Denver in which at least a subset of these data is currently available. This monitoring site is an EPA Speciation Trends Network (STN) site and is located in the most heavily-industrialized area in Denver (the Commerce City area in northeast Denver) which also has a dense network of interstate highways. Of any area in Denver, temporal variability in PM components in Commerce City might be anticipated to be most different from that at our residential monitoring site. Because the STN analysis uses a different ECOC analysis method than the DASH core site analysis, and these have well documented differences (Chow et al., 2004, 2005), conclusions regarding comparisons between the two sites must be made guardedly. While correlations between PM components over time at the Commerce City site and our residential site were relatively good (lowest r=0.70), concentrations of all components were generally higher in Commerce City, especially so for EC and OC (Figures 3 and 4). Also, the absolute differences in concentrations for some components varied over time. For example, EC concentrations were dramatically higher in the winter in Commerce City compared to those at our residential site, but only modestly higher in other seasons (Figure 4).
Figure 3.

Correlation (r=Pearson correlation coefficient) between daily PM2.5 mass and component concentrations at the northeast Denver STN site in Commerce City and the DASH residential site on Palmer Elementary School from 07/01/02 through 12/31/05.
Figure 4.


Daily 24-hour average PM2.5 mass and component concentrations (μg/m3) at the northeast Denver STN site in Commerce City (red circles) and the corresponding concentrations at the DASH residential site on Palmer Elementary School (black triangles). The smooth curves are loess smooths with windows widths of 0.1.
3.2 Source Apportionment Model Assessment
To evaluate the performance of the PMF model using the synthetic data set, PMF modeled estimates of factor contributions and profiles (Gpmf and Fpmf, respectively) were compared with the known synthetic matrices, Gsyn and Fsyn. In all the model runs, PMF2 was run in robust mode. Different numbers of factors and values of the rotational factor (called FPEAK) were investigated to obtain an optimal solution based on inspection of the scaled residuals and the rotational uncertainty matrix (ROTMAT) output by PMF. This approach is described further in Brinkman et al. (2006). The optimum model was able to discern all nine of the original input factors and was relatively insensitive to selection of FPEAK values ranging from 0.0 to 0.4.
Table 2 lists the coefficient of determination (R2) between the synthetic and modeled factor contributions, Gsyn and Gpmf, for a nine factor solution with an FPEAK value of zero. The PMF source contributions correlated well for six of the nine sources, all with R2 values greater than 0.79. The correlation was best for ammonium nitrate, wood combustion and vegetative debris (all with R2 greater than 0.98). The worst correlation was for meat cooking (R2 = 0.14). This is a result of a relatively high detection limit for cholesterol, the primary organic marker for meat cooking. Gasoline exhaust and natural gas combustion only correlated marginally well with R2 around 0.5. Table 2 also lists the normalized mean bias (NMB) for the contributions of each of the k sources defined by:
| Equation 7 |
Table 2.
Assessment of the modeled factor contributions in predicting synthetic factors.
| Factor | Source | R2 | Normalized Mean Bias (%)* |
|---|---|---|---|
| 1 | ammonium nitrate | 1.00 | −54 |
| 2 | ammonium sulfate | 0.79 | 6 |
| 3 | gasoline exhaust | 0.52 | 76 |
| 4 | diesel exhaust | 0.82 | −22 |
| 5 | road dust | 0.89 | 34 |
| 6 | wood combustion | 0.98 | −143 |
| 7 | meat cooking | 0.14 | −101 |
| 8 | natural gas combustion | 0.49 | −57 |
| 9 | vegetative debris | 0.99 | −78 |
see text Equation 7
In Equation 7, gsyn and gpmf are the individual components of factor contribution matrices Gsyn and Gpmf defined above.
Source contributions estimated by PMF matched those used to develop the synthetic data for paved road dust, ammonium sulfate and diesel exhaust. PMF overestimated source contributions for ammonium nitrate, natural gas combustion, vegetative debris, wood combustion, and meat cooking, and underestimated source contributions for gasoline vehicle exhaust.
4. Discussion
The DASH study was designed primarily to allow investigation of the effect of short-term variation in ambient source contributions of PM2.5 on several health endpoints. To this end, daily concentrations of an array of PM2.5 components are being measured at a centrally located residential site chosen to be distant from large emission sources. A concerted effort is made to measure a large number of organic components, with a commensurate lesser effort made to measure trace metal components. This detailed PM2.5 characterization provides the raw data for source apportionment and should provide sufficient information to resolve multiple source types. A multivariate, receptor-based approach (PMF) was chosen for the daily source apportionment and a novel method was developed to estimate uncertainties based on a bootstrap approach (Hemann et al., 2008).
The ability to identify PM2.5 source contributions depends critically on the PM2.5 components that make up the daily multivariate measurement. The characterization of PM2.5 in this study is more detailed than has previously been carried out for this purpose. The more fully PM2.5 is characterized (i.e., the more source tracer compounds that are quantified), the more likely PMF will be able to identify unique factors that are interpretable as individual pollution sources. The synthetic data exercise demonstrated that PMF could discern the sources of interest using realistic estimates of source variability and profiles, though not all source contributions were accurately estimated. The sources exhibiting the most bias (based on the normalized mean bias estimates in Table 2) suffered from either poor detection limits for important tracer species (e.g., meat cooking identified by the fatty acids listed in Table S2) or highly correlated source contributions (e.g., ammonium nitrate and wood combustion, R=0.82). This exercise motivated us to improve detection limits and incorporate more organic molecular marker compounds, thereby providing additional information to assist PMF in distinguishing different, highly correlated sources. Table S1 in the online supplementary data includes the expanded list of species currently being quantified.
The synthetic data exercise also allowed us to compare our chemical speciation scenario which included organic markers with other scenarios that lacked these compounds. Replacing the organic markers with trace metals did not provide sufficient information for PMF to successfully pick out all nine of the original factors, often combining several of the important sources into one factor. The STN typically generates speciated PM2.5 data for only one out of every three or six days and includes trace metals, but no organic markers. Data from the DASH study therefore have distinct advantages over existing STN data for longitudinal studies of daily health endpoints, both in regards to the frequency of PM2.5 speciation measurements and the array of species identified.
Because source apportionment models are complex and subject to user discretion, critical evaluation of the results is important. Each of the PMF model source contributions will be scrutinized to be sure they match hypothesized temporal and spatial expectations. For example, we expect a diesel vehicle source contribution on average to drop on Saturday and Sunday relative to the rest of the week reflecting the reduced vehicle miles traveled on weekends (Chinkin et al., 2003; Dreher and Harley, 1998). We also expect a wood combustion source contribution to increase during the winter months from residential wood burning and possibly to reveal episodic spikes in the warmer months due to wildfire activity and prescribed burns. Finally, simple wind trajectory analyses using meteorological data from a nearby monitoring station will be helpful in validating potential point sources identified by PMF.
The time series of PM2.5 source concentrations at our residential monitoring site needs to be correlated with time series of population exposures to these emission sources. The ability of a single monitoring site to adequately reflect the time series of PM2.5 components and sources for the Denver population might be questioned. Based on limited data on PM2.5 mass concentrations from monitoring sites in Denver available at the planning stage of the study, it appeared that the PM2.5 time series were reasonably homogeneous over space in Denver. Recent findings from studies in other cities in which PM components have been measured at multiple sites over time have indicated that this may not be true for PM2.5 components (Marmur et al., 2006; Ito, Xue and Thurston, 2004; Kim et al., 2005). Also, examination of more recent concurrent PM2.5 component time series data from the only other speciation site in Denver in which at least a subset of components is available indicates that there may be substantial spatial-temporal variability in PM2.5 components.
It is possible that spatial variability in PM2.5 component time series will bias the health effect estimates. A simple offset of concentration level from site to site, with differences in concentrations remaining constant over time and the shape of the time series preserved over space, does not result in bias in time series health effect estimates (Zeger et al., 2000). However, a difference in the shape of the time series can result in bias. In the final year of the study, we are planning a limited and focused PM2.5 monitoring campaign in the Denver area to allow an assessment of spatial-temporal variability of short-term concentrations of the PM2.5 components and the source concentrations. Simulation studies are also planned to provide insight into the degree of bias in the health effect estimates likely to be produced by such variability.
Identifying adverse health impacts of specific emission sources has potential advantages over identifying impacts associated with other measures of PM2.5, such as mass or component concentrations. Emission sources are a main determinant of chemical composition and other features of PM2.5. If these features in turn determine toxicity, then the toxicity of the PM2.5 mix in a given setting is in large part determined by the relative contribution of individual emission sources. Policies aimed at reducing exposure to specific sources could then be considered as more focused and efficient alternatives to ameliorating the adverse public health impacts of PM2.5 exposure than existing approaches that focus on other PM2.5 metrics. Identifying especially toxic sources of PM2.5 may also provide insight into features that confer toxicity. Caution should be exercised, however, given the potential for bias in the source estimates generated from the factor analysis. The synthetic data exercise carried out in this paper suggests that bias can be large if sources do not have well characterized marker species or are highly correlated with other sources.
Another advantage of taking a source-oriented approach to specifying exposure to air pollution is that specific source effects might in fact be generalizable. Many pollution sources present in Denver, such as diesel, gasoline and natural gas combustion, residential wood burning, and food cooking are common to many urban areas. While there is clearly heterogeneity in single pollutant effects from city to city when using the traditional air pollutant concentration approach to studying air pollution effects, as well as limited generalizability of single city findings, it is not known whether such heterogeneity will be present in estimated effects of pollution sources. Because a given urban area under study does not experience pollution from all potential sources does not seriously undermine this approach. Of course, if effects are due to synergistic interactions of source emissions, only limited generalizations across cities would be possible. For this reason, it could be valuable to incorporate several cities into a unified sources-effects analysis. The lack of the needed detailed daily monitoring data, such as those being obtained in this study, currently limits the feasibility of a multi-city approach.
The initial array of health endpoints being examined in the DASH study should provide insight into the range of health effects associated with PM2.5 source exposures. Many other possible endpoints could be coupled with the existing source exposure characterization to greatly enhance the value of the original study. The air monitoring, chemical speciation and source apportionment carried out in DASH can therefore be a valuable resource for further epidemiological investigation into health effects of PM2.5 source emissions.
Supplementary Material
Acknowledgments
Supported by NIEHS research grant RO1 ES010197. We would like to acknowledge the contributions of Sheila Burns, Pat McGraw and Bradley Rink (CDPHE) for their help with STN data retrieval, Joni Rix (Denver Public School District) and Palmer Elementary School faculty and staff for their assistance with the sampling site, and Greg Brinkman, Gary Vance, Josh Hemann, Ingrid Ulbrich, and Jose Jimenez for their support of the synthetic data source apportionment modeling efforts.
Footnotes
Publisher's Disclaimer: This is a PDF file of an unedited manuscript that has been accepted for publication. As a service to our customers we are providing this early version of the manuscript. The manuscript will undergo copyediting, typesetting, and review of the resulting proof before it is published in its final citable form. Please note that during the production process errors may be discovered which could affect the content, and all legal disclaimers that apply to the journal pertain.
Literature Cited
- Anderson ZJ, Whalin P, Raaschou-Nielsen O, Scheike T, Loft S. Ambient particle source apportionment and daily hospital admissions among children and elderly in Copenhagen. Journal of Exposure Science and Environmental Epidemiology. 2007;17:625–636. doi: 10.1038/sj.jes.7500546. [DOI] [PubMed] [Google Scholar]
- Brinkman G, Vance G, Hannigan MP, Milford JB. Use of synthetic data to evaluate positive matrix factorization as a source apportionment tool for PM2.5 exposure data. Environmental Science and Technology. 2006;40:1892–1901. doi: 10.1021/es051712y. [DOI] [PubMed] [Google Scholar]
- Chinkin LR, Coe DL, Funk TH, Hafner HR, Roberts PT, Ryan PA, Lawson DR. Weekday versus weekend activity patterns for ozone precursor emissions in California’s South Coast Air Basin. Journal of the Air & Waste Management Association. 2003;53:829–843. doi: 10.1080/10473289.2003.10466223. [DOI] [PubMed] [Google Scholar]
- Chow JC, Watson JG, Chen LWA, Arnott WP, Moosmuller H. Equivalence of elemental carbon by thermal/optical reflectance and transmittance with different temperature protocols. Environmental Science and Technology. 2004;38:4414–4422. doi: 10.1021/es034936u. [DOI] [PubMed] [Google Scholar]
- Chow JC, Watson JG, Chen LWA, Paredes-Miranda G, Chang MCO, Trimble D, Fung KK, Zhang H, Yu JZ. Refining temperature measures in thermal/optical carbon analysis. Atmospheric Chemistry and Physics. 2005;5:2961–2972. [Google Scholar]
- Christoforou CS, Salmon LG, Hannigan MP, Solomon PA, Cass GR. Trends in fine particulate concentration and chemical composition in Southern California. Journal of the Air and Waste Management Association. 2000;50:43–53. doi: 10.1080/10473289.2000.10463985. [DOI] [PubMed] [Google Scholar]
- Crimmins BS, Baker JE. Improved GC/MS methods for measuring hourly PAH and nitro-PAH concentrations in urban particulate matter. Atmospheric Environment. 2006;40:6764–6779. [Google Scholar]
- Dominici F, McDermott A, Daniels M, Zeger SL, Samet JM. Revised analyses of time-series studies of air pollution and health. Health Effects Institute Special Report; Boston, MA: 2003. Mortality among residents of 90 cities; pp. 9–24. [Google Scholar]
- Dreher DB, Harley RA. A fuel-based inventory for heavy-duty diesel truck emissions. Journal of the Air & Waste Management Association. 1998;48:352–358. [Google Scholar]
- Dutton SJ, Schauer JJ, Vedal S, Hannigan MP. PM2.5 characterization for time series studies: pointwise uncertainty estimation and bulk speciation methods applied in Denver. Atmospheric Environment. 2008a doi: 10.1016/j.atmosenv.2008.10.003. in press. [DOI] [PMC free article] [PubMed] [Google Scholar]
- Dutton SJ, Williams DE, Garcia JK, Vedal S, Hannigan MP. PM2.5 characterization for time series studies: organic molecular marker speciation methods and observations from daily measurements in Denver. 2008b doi: 10.1016/j.atmosenv.2009.01.003. submitted. [DOI] [PMC free article] [PubMed] [Google Scholar]
- Fraser MP, Grosjean D, Grosjean E, Rasmussen RA, Cass GR. Air quality model evaluation data for organics. 1. Bulk chemical composition and gas/particle distribution factors. Environmental Science and Technology. 1996;30:1731–1743. [Google Scholar]
- Hannigan MP, Cass GR, Penman B, et al. Bioassay-directed chemical analysis of Los Angeles airborne particulate matter using a human cell mutagenicity assay. Environmental Science and Technology. 1998;32:3502–3514. [Google Scholar]
- Held T, Yinga Q, Kleeman MJ, Schauer J, Fraser MP. A comparison of the UCD/CIT air quality model and the CMB source–receptor model for primary airborne particulate matter. Atmospheric Environment. 2005;39:2281–2297. [Google Scholar]
- Hemann JG, Brinkman GL, Dutton SJ, Hannigan MP, Milford JB, Miller SL. Assessing positive matrix factorization model fit: a new method to estimate uncertainty and bias in factor contributions at the daily time scale. Atmospheric Chemistry and Physics. 2008 in press. [Google Scholar]
- Hopke PK, Ramadan Z, Paatero P, Norris GA, Landis MS, Williams RW, Lewis CW. Receptor modeling of ambient and personal exposure samples: 1998 Baltimore particulate matter epidemiology-exposure study. Atmospheric Environment. 2003;37:4595–4595. [Google Scholar]
- Ito K, Christensen WF, Eatough DJ, et al. PM source apportionment and health effects: 2.An investigation of inter-method variability in associations between source-apportioned fine particle mass and daily mortality in Washington, DC. Journal of Exposure Science and Environmental Epidemiology. 2006;16:300–310. doi: 10.1038/sj.jea.7500464. [DOI] [PubMed] [Google Scholar]
- Ito K, Xue N, Thurston G. Spatial variation of PM2.5 chemical species and source-apportioned mass concentrations in New York City. Atmospheric Environment. 2004;38:5269–5282. [Google Scholar]
- Kim E, Hopke PK, Pinto JP, Wilson WE. Spatial variability of fine particle mass, components, and source contributions during the Regional Air Pollution Study in St. Louis. Environmental Science and Technology. 2005;39:4172–4179. doi: 10.1021/es049824x. [DOI] [PubMed] [Google Scholar]
- Koken PJM, Piver WT, Ye F, Elixhauser A, Olsen LM, Portier CJ. Temperature, air pollution, and hospitalization for cardiovascular diseases among elderly people in Denver. Environmental Health Perspectives. 2003;111(10):1312–1317. doi: 10.1289/ehp.5957. [DOI] [PMC free article] [PubMed] [Google Scholar]
- Laden F, Neas LM, Dockery DW, Schwartz J. Association of fine particulate matter from different sources with daily mortality in six U.S. cities. Environmental Health Perspectives. 2000;108:941–947. doi: 10.1289/ehp.00108941. [DOI] [PMC free article] [PubMed] [Google Scholar]
- Lewis CW, Norris GA, Conner TL, Henry RC. Source apportionment of Phoenix PM2.5 aerosol with the Unmix receptor model. Journal of the Air & Waste Management Association. 2003;53:325–338. doi: 10.1080/10473289.2003.10466155. [DOI] [PubMed] [Google Scholar]
- Long RW, Modey WK, Smith PS, Smith R, Merrill C, Pratt J, Stubbs A, Eatough NL, Eatough DJ, Malm WC, Wilson WE. One- and three-hour PM2.5 characterization, speciation, and source apportionment using continuous and integrated samplers. Aerosol Science and Technology. 2005;39:238–248. [Google Scholar]
- Lough GC, Schauer JJ, Lawson DR. Day-of-week trends in carbonaceous aerosol composition in the urban atmosphere. Atmospheric Environment. 2006;40:4137–4149. [Google Scholar]
- Mar TF, Ito K, Koenig JQ, et al. PM source apportionment and health effects. 3. Investigation of inter-method variations in associations between estimated source contributions of PM2.5 and daily mortality in Phoenix, AZ. Journal of Exposure Science and Environmental Epidemiology. 2006;16:311–320. doi: 10.1038/sj.jea.7500465. [DOI] [PubMed] [Google Scholar]
- Mar TF, Norris GA, Koenig JQ, Larson TV. Associations between air pollution and mortality in Phoenix, 1995–1997. Environmental Health Perspectives. 2000;108:347–353. doi: 10.1289/ehp.00108347. [DOI] [PMC free article] [PubMed] [Google Scholar]
- Marmur A, Park SK, Mulholland JA, Tolbert PE, Russell AG. Source apportionment of PM2.5 in the southeastern United States using receptor and emissions-based models: Conceptual differences and implications for time-series health studies. Atmospheric Environment. 2006;40:2533–2551. [Google Scholar]
- Maykut NN, Lewtas J, Kim E, Larson TV. Source apportionment of PM2.5 at an urban IMPROVE site in Seattle, Washington. Environmental Science and Technology. 2003;37:5135–5142. doi: 10.1021/es030370y. [DOI] [PubMed] [Google Scholar]
- Mazurek MA, Simoneit BRT, Cass GR, Gray HA. Quantitative high-resolution gas chromatography and high-resolution gas chromatography-mass spectrometry analyses of carbonaceous fine aerosol-particles. International Journal of Environmental Analytic Chemistry. 1987;29:119–139. [Google Scholar]
- Miller SL, Anderson MJ, Daly EP, Milford JB. Source apportionment of exposures to volatile organic compounds. I. Evaluation of receptor models using simulated exposure data. Atmospheric Environment. 2002;36:3629–3641. [Google Scholar]
- Mueller PK, Mendoza BV, Collins JC, Wilgus EA. Application of ion chromatography to the analysis of anions extracted from airborne particulate matter. In: Sawicki E, Mulik JD, Wittgenstein E, editors. Ion Chromatographic Analysis of Environmental Pollutants. Ann Arbor Science; Ann Arbor, Michigan: 1978. pp. 77–86. [Google Scholar]
- NRC. Research priorities for airborne particulate matter: IV. Continuing research progress. Washington, D.C: National Academy Press; 2004. National Research Council (NRC) and Committee on Research Priorities for Airborne Particulate Matter. [Google Scholar]
- Paatero P. Least squares formulation of robust nonnegative factor analysis. Chemometrics and Intelligent Laboratory Systems. 1997;37:23–35. [Google Scholar]
- Pang Y, Turpin BJ, Gundel LA. On the importance of organic oxygen for understanding organic aerosol particles. Aerosol Science and Technology. 2006;40:128–133. [Google Scholar]
- Pope CA, Dockery DW. Health effects of fine particulate air pollution: lines that connect. Journal of the Air and Waste Management Association. 2006;56(6):709–742. doi: 10.1080/10473289.2006.10464485. [DOI] [PubMed] [Google Scholar]
- Rabinovitch N, Strand M, Gelfand EW. Particulate levels are associated with early asthma worsening in children with persistent disease. American Journal of Respiratory and Critical Care Medicine. 2006;173:1098–1105. doi: 10.1164/rccm.200509-1393OC. [DOI] [PubMed] [Google Scholar]
- Rabinovitch N, Zhang L, Murphy JR, Vedal S, Dutton SJ, Gelfand EW. Effects of wintertime ambient air pollutants on asthma exacerbations in urban minority children with moderate to severe disease. Journal of Allergy and Clinical Immunology. 2004;114:1131–1137. doi: 10.1016/j.jaci.2004.08.026. [DOI] [PubMed] [Google Scholar]
- Samet JM, Dominici F, Zeger SL, Schwartz J, Dockery DW. Health Effects Institute Research Report No. Pt 1. Vol. 94. Cambridge, MA: 2000. The National Morbidity, Mortality, and Air Pollution Study. Part I: Methods and methodologic issues. [PubMed] [Google Scholar]
- Sarnat JA, Marmur A, Klein M, Kim E, Russell AG, Sarnat SE, Mulholland JA, Hopke PK, Tolbert PE. Fine particle sources and cardiorespiratory morbidity: an application of chemical mass balance and factor analytical source-apportionment methods. Environmental Health Perspectives. 2008;116:459–466. doi: 10.1289/ehp.10873. [DOI] [PMC free article] [PubMed] [Google Scholar]
- Schauer JJ, Kleeman MJ, Cass GR, Simoneit BRT. Characterization and control of organic compounds emitted from air pollution sources. Final Report to California Air Resources Board, Contract 93–329 1998 [Google Scholar]
- Schauer JJ, Rogge WF, Hildemann LM, et al. Source apportionment of airborne particulate matter using organic compounds as tracers. Atmospheric Environment. 1996;30:3837–3855. [Google Scholar]
- Schreuder AB, Larson TV, Sheppard L, Claiborn CS. Ambient woodsmoke and associated respiratory emergency department visits in Spokane, Washington. International Jounral of Occupational and Environmental Health. 2006;12(2):147–153. doi: 10.1179/oeh.2006.12.2.147. [DOI] [PubMed] [Google Scholar]
- Tsai FC, Apte MG, Daisey JM. An exploratory analysis of the relationship between mortality and the chemical composition of airborne particulate matter. Inhalation Toxicology. 2000;12 (suppl 2):121–135. doi: 10.1080/08958378.2000.11463204. [DOI] [PubMed] [Google Scholar]
- Turpin BJ, Lim H. Species contributions to PM2.5 mass concentrations: revisiting common assumptions for estimating organic mass. Aerosol Science and Technology. 2001;35:602–610. [Google Scholar]
- US-EPA. Quality Assurance Guidance Document 2.12: Monitoring PM2.5 in ambient air using designated reference or class I equivalent methods. Human Exposure and Atmospheric Sciences Division, National Exposure Research Laboratory, U.S. Environmental Protection Agency; Research Triangle Park, NC: 1998. [Google Scholar]
- US-EPA. Air quality criteria for particulate matter. Office of Research and Development, U.S. Environmental Protection Agency; Research Triangle Park, NC: 2004. report no. EPA/600/P-99/022aF and bF. [Google Scholar]
- Watson JG, Fujita E, Chow J, Zielinska B, Richards LW, Neff W, Dietrich D. Northern Front Range Air Quality Study Final Report. Fort Collins, CO: Desert Research Institute; 1998. [Google Scholar]
- White WH, Roberts PT. On the nature and origins of visibility- reducing aerosols in the Los Angeles air basin. Atmospheric Environment. 1977;11:803–812. [Google Scholar]
- Zeger S, Thomas D, Dominici F, Samet JM, Schwartz J, Dockery D, Cohen A. Exposure measurement error in time-series studies of air pollution: concepts and consequences. Environmental Health Perspectives. 2000;108:419–426. doi: 10.1289/ehp.00108419. [DOI] [PMC free article] [PubMed] [Google Scholar]
Associated Data
This section collects any data citations, data availability statements, or supplementary materials included in this article.