Abstract
Urea functions as a key osmolyte in the urinary concentrating mechanism of the inner medulla. The urea transporter UT-A1 is upregulated by antidiuretic hormone, facilitating faster equilibration of urea between the lumen and interstitium of the inner medullary collecting duct, resulting in the formation of more highly concentrated urine. New methods in dynamic nuclear polarization, providing ∼50,000-fold enhancement of nuclear magnetic resonance signals in the liquid state, offer a novel means to monitor this process in vivo using magnetic resonance imaging. In this study, we detected significant signal differences in the rat kidney between acute diuretic and antidiuretic states, using dynamic 13C magnetic resonance imaging following a bolus infusion of hyperpolarized [13C]urea. More rapid medullary enhancement was observed under antidiuresis, consistent with known upregulation of UT-A1.
Keywords: dynamic nuclear polarization, diuresis, urinary concentrating mechanism, UT-A1
urea plays a vital role in the urinary concentrating mechanism by functioning as a key osmolyte (19). While sodium chloride is the dominant solute in the outer medullary interstitium, urea is important in the inner medulla. In the inner medullary collecting duct (IMCD), facilitated transporters UT-A1 and UT-A3 allow specific reabsorption of urea from the luminal fluid, followed by reabsorption of water down the resulting osmotic gradient via aquaporins. A knockout mouse lacking UT-A1 and UT-A3 has been shown to have a urinary concentrating defect (4). Transport is required since urea is a highly polar molecule with subsequently low diffusivity across lipid bilayers. Activity of UT-A1 is acutely sensitive to antidiuretic hormone (or vasopressin) (11, 22), facilitating faster equilibration in the concentration of urea between luminal and interstitial spaces of the inner medulla, resulting in the formation of more highly concentrated urine.
Dynamic nuclear polarization (DNP) with recently developed rapid dissolution technology has enabled ∼50,000-fold enhancement of nuclear magnetic resonance (NMR) signals in the liquid state (1). Hyperpolarization persists for a limited time according to the longitudinal T1 relaxation time of the nucleus (on the order of 1 min for 13C nuclei of interest). By overcoming the limitation of poor sensitivity that hampered previous studies with 13C-labeled compounds, this development has introduced a new set of 13C-labeled contrast agents for magnetic resonance imaging (MRI), such as [1-13C]pyruvate, whose distribution and enzymatic conversion to lactate may be monitored in vivo (8). A current clinical trial using hyperpolarized [1-13C]pyruvate as a MRI contrast agent in prostate cancer patients demonstrates the feasibility of this approach to investigate human disease (14). Urea, which as an end product is not metabolized by mammals, has been hyperpolarized by these methods previously (1), and initial preclinical applications as a contrast agent for angiography (7) and perfusion imaging (21) have been demonstrated.
This study is to our knowledge the first to investigate hyperpolarized [13C]urea as a functional marker in renal imaging. We monitored signal intensity changes localized to the medulla in dynamic imaging of infused hyperpolarized [13C]urea in rats in acute antidiuretic and diuretic states, and thereby attempted to measure differential activity of urea transporter UT-A1.
METHODS
Preparation of hyperpolarized material.
One gram of [13C]urea isotopically enriched to 99% (Sigma, St. Louis, MO) was dissolved in glycerol to a concentration of 6.4 M, along with 23 mM trityl radical OX063 (Oxford Instruments, Abingdon, UK), and 1.5 mM Dotarem (Guerbet, Roissy, France). Solvation in glycerol results in formation of an amorphous solid at the low temperatures used for DNP. For each experiment, a 125-mg sample of the mixture was weighed and loaded into a HyperSense DNP polarizer (Oxford Instruments). Inside the polarizer, the sample was cooled to 1.3 K in a magnetic field of 3.35 T and irradiated by microwaves with frequency 94.104 GHz (power = 25 mW) for a period of 1 h. The sample was then rapidly dissolved in a heated solution of 4.25 ml phosphate-buffered saline, resulting in a room temperature 150 mM solution of hyperpolarized [13C]urea (pH ∼7.3). This polarized solution was drawn into a syringe and quickly transported to the bore of the MRI scanner for injection into the animal.
Animal experiments.
Four male Sprague-Dawley rats were each scanned in both antidiuretic and diuretic states on the same day. To induce antidiuresis, rats were deprived of food and water for an overnight period of 16 h before imaging (10). For the first imaging experiment in the morning, rats were injected with a 1.5-ml bolus of 150 mM hyperpolarized [13C]urea through a tail vein catheter over 6 s. To induce diuresis, rats were awakened and allowed free access to 10% (wt/wt) glucose water (distilled) for a period of 8 h. Their consumption ranged from 30 to 55 ml. The hyperpolarized MRI experiment was repeated at the end of this interval. Before each experiment, the rat was anesthetized with isoflurane and positioned on a heated water pad inside the scanner. This protocol induces large changes in urine production. Urine output by three additional rats put on the protocol was as follows: antidiuresis phase: 4.0 ml, 3.5 ml, 1.3 ml, diuresis phase: 39.5 ml, 37.0 ml, 16.0 ml, respectively. All animal studies were conducted in accordance with a protocol approved by the Institutional Review Board (IRB).
Image acquisition.
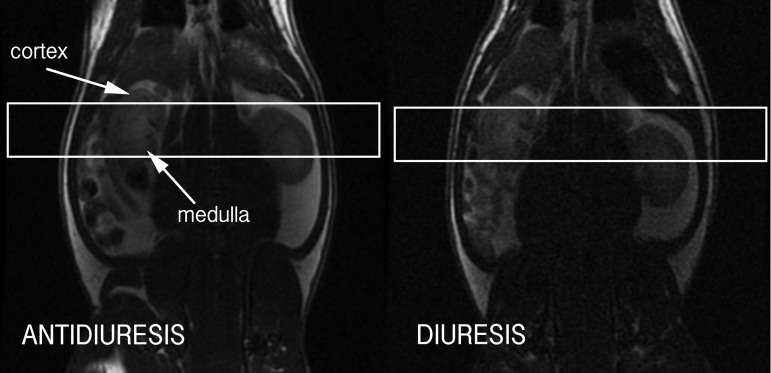
Rats were scanned in a GE 3-T human MRI scanner (GE Healthcare, Waukesha, WI), inside a custom cylindrical dual-tuned 13C/1H transceiver radiofrequency coil. Hyperpolarized signal undergoes rapid and irreversible exponential decay with rate constant given by the T1 relaxation time, which demands rapid and efficient image acquisition using specially designed pulse sequences. For urea, T1 = 47 s in solution at 3 T. A single axial two-dimensional slice (thickness = 15 mm) centered on the rat right kidney (Fig. 1) was repeatedly imaged every 3 s over 1 min, 57 s (40 frames), initiated at the start of injection. A pulse sequence employing balanced steady-state free precession (bSSFP) was used (21). The key acquisition parameters were as follows: image matrix size = 32 × 32, field-of-view = 8 cm, spatial resolution = 2.5 mm × 2.5 mm, flip angle (α) = ±15°, with α/2 catalyzation (7, 21), echo time = 5.75 ms, repetition time = 11.5 ms, readout bandwidth = ±10 kHz. Each image was acquired in 276 ms. The position of the acquired slice was graphically defined on coronal scout 1H images. Axial and coronal anatomic T2-weighted 1H fast spin echo images were also acquired for detailed anatomic reference and for overlay of the hyperpolarized image data.
Fig. 1.
Coronal T2-weighted 1H fast spin echo magnetic resonance imaging (MRI) image through rat kidneys in antidiuresis (left) and diuresis (right), showing graphical prescription of axial scan slices through middle of rat right kidney for imaging of hyperpolarized [13C]urea.
Data postprocessing and analysis.
Images of [13C]urea were interpolated and overlaid in color on grayscale anatomic 1H images, using National Institutes of Health ImageJ (18). The dynamic 13C image frames were corrected to eliminate the temporal filter resulting from T1 signal decay, through division of each image by e−t/T1. Each image set was normalized for the level of polarization attained. Regions of interest corresponding to the right renal medulla and cortex were manually defined in the image space using homebuilt software. Dynamic signal curves corresponding to these regions were plotted for comparison. The intrinsic signal-to-noise ratio of the raw images was calculated based on established methods for MRI (9) and used to estimate error bounds for the dynamic data. The concept of a “normalized moment of inertia” was applied to measure the spatial centralization of the urea signal over time. In physics, the moment of inertia is a measure of a rigid body's resistance to a change to its angular velocity, determined by how far its mass is distributed from the rotational axis. It is computed as a summation of each differential subunit of its mass times the square of its distance from the rotational axis. In analogy, we computed the summation of each image voxel's signal intensity times the square of its distance to the center of the kidney.
RESULTS
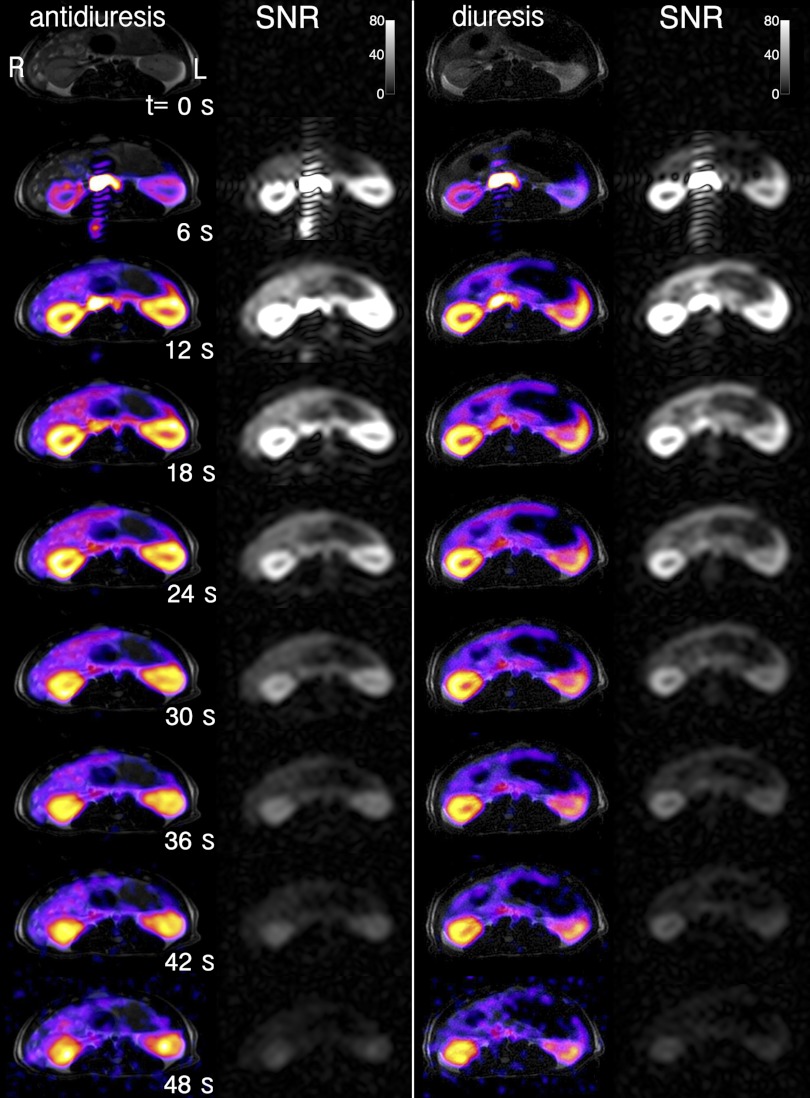
Dynamic axial MR images of hyperpolarized [13C]urea through rat right kidney in both diuretic and antidiuretic states are shown in Fig. 2, overlaid on conventional 1H T2-weighted anatomic images. More rapid inner medullary enhancement is evident in the case of antidiuresis compared with diuresis. Since the medulla is anatomically located radially inward from the cortex, this is seen as a more rapid centralization of the urea signal. Differentiation between the two states was detected 30–50 s postinjection. Some of the later time frames are noisier due to noise inflation by an exponential filter applied to correct the images for signal decay due to longitudinal T1 relaxation, depending on the initial level of polarization (∼15%, compared with ∼0.0003% for thermally polarized nuclear spins in a clinical MRI magnet).
Fig. 2.
Axial dynamic renal imaging of hyperpolarized [13C]urea (color) in antidiuretic (left) and diuretic (right) states, demonstrating differential medullary signal, overlaid on anatomic T2-weighted fast spin echo images (gray). The raw 13C images, not corrected for T1 decay, are shown in grayscale in neighboring columns to the right, with the data signal-to-noise ratio (SNR) level indicated by the color bar. Rat right kidney is shown at image left, as labeled, consistent with radiologic convention.
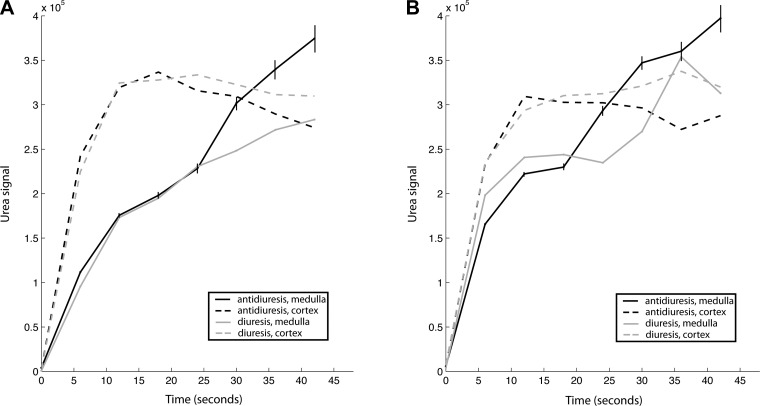
Dynamic signal curves from cortex and medulla (Fig. 3) showed similar results. While the cortical signal was relatively consistent between the two states, the medullary signal varied more substantially. In the case of the rat in Fig. 1, clear separation of 36% occurred by 45 s (Fig. 3A). Some of the dynamic curves exhibited spurious fluctuations due either to noise, signal bleed due to Gibbs ringing near sharp anatomic transitions, or the inability to precisely delineate the margins of the cortex vs. medulla due to the limited spatial resolution (Fig. 3B). Variable polarization may also affect the result, if the correction for the level of polarization is inaccurate.
Fig. 3.
Dynamic signal plots of hyperpolarized [13C]urea in rat cortex and medulla in antidiuretic and diuretic states. Examples of both clear (A) and relatively noisy (B) data are shown. Estimated error bounds (±SD) derived from intrinsic SNR of the data are shown for times ≥12 s for the medullary antidiuresis curves, increasing with time due to noise inflation by the T1 correction.
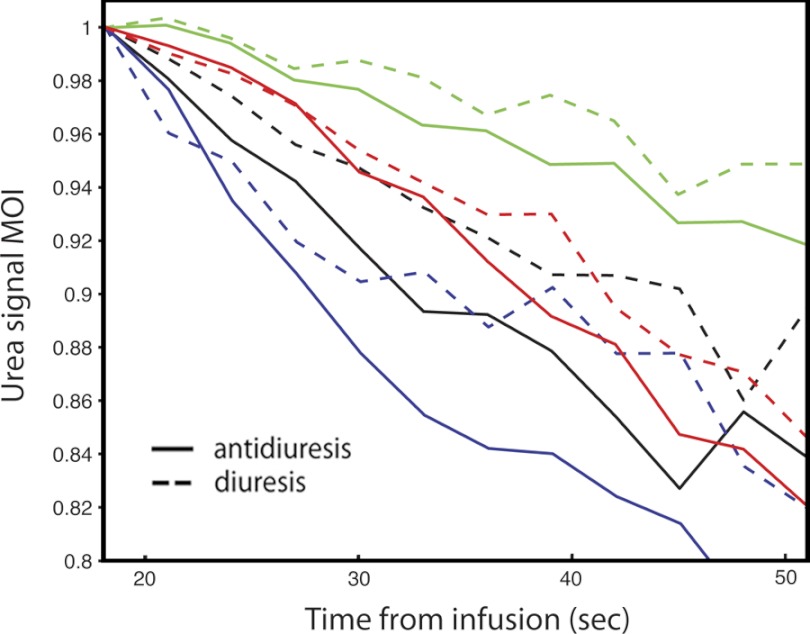
A normalized “moment of inertia” of urea signal about the kidney center (or integrated product of signal times the squared distance from kidney center) provides an alternate means to interpret the urea imaging data (Fig. 4). As a direct measure of the centralization of urea signal, this metric relates directly to the visual differences apparent in Fig. 2. Being normalized to total kidney urea signal, it also eliminates the potentially confounding effect of variable polarization. For each animal, the curve takes on a general shape based on anatomy, with consistent variation induced in the two states. The moment is inversely related to the rate of urea transport. Overall, the antidiuresis curve was statistically lower than the diuresis curve at any given time point (P = 0.0004, single-sided sign test). The mean maximum difference between the curves among the four rats was 6.5 ± 3.1% (P = 0.012, paired single-tailed t-test).
Fig. 4.
Plotted normalized “moment of inertia” of urea image intensity about the center of rat right kidney for 4 rats (colors) in antidiuretic (solid) and diuretic (dotted) states. Black lines correspond to rat depicted in Fig. 2.
DISCUSSION
Using dynamic 13C MR imaging following an infused bolus of hyperpolarized [13C]urea, we detected increased activity of urea transporter UT-A1 in antidiuresis in vivo. Faster equilibration between IMCD lumen and interstitial space results in a larger effective space for the urea to enter, and thus faster medullary enhancement. The claim of measuring the activity of UT-A1 rests on the assumption of delivery of intravenous urea to the IMCD within the time scale of the experiment. Prior evidence obtained using other tracers indicates that this assumption is reasonable. Contrast enhanced images from a previous MRI study suggested that the collecting ducts had high concentrations of Gd-DTPA 40–70 s after intravenous infusion in a normal rat (6). Multiple previous studies have used the dye lissamine green for visual measurement of renal transit times. In one study, the dye was 90% cleared from the distal tubules by 54 s after intravenous infusion in a normal rat (20), and another study produced similar results (5). Using positron emission tomography, accumulation of [18F]fluorohippurate was detected in the bladder within 2 min of intravenous infusion in a normal rat (2). Furthermore, we also suspect that the smaller molecular size of urea may result in faster transit than these other tracers.
Glomerular filtration rate (GFR) is not expected to vary significantly between the two states, although a small change in GFR cannot be excluded as it was not measured. A small change in GFR is unlikely to affect the validity of our findings. Each rat received a very small, presumably negligible dose of glycerol with each infusion, which is required as a glassing agent for urea in the process of hyperpolarization. High doses of glycerol (e.g., 10 ml/kg 50% glycerol water) are known to induce renal failure in rats (17). However, that dose is in excess of 80 times the doses given in this study (∼20 mg/infusion). Therefore, we believe that the glycerol had little to no effect on our results.
The ability to monitor urea transport in vivo with minimal invasiveness is exciting because of new possibilities for investigating its role in disease states such as lithium-induced diabetes insipidus (3, 12) and for monitoring of novel diuretic drugs that inhibit urea transporters (15). Moreover, aside from a potential role as a functional probe in the kidney, hyperpolarized [13C]urea may have an important clinical role as a contrast agent for angiography or perfusion imaging throughout the body, amid growing concern over the risks associated with the use of iodinated radiographic agents (16), and paramagnetic Gadolinium chelates (13), in patients with impaired renal function.
GRANTS
We gratefully acknowledge the National Institutes of Health (NIH) Grant P41EB013598. J. M. Sands was supported by NIH Grant R01DK41707.
DISCLOSURES
No conflicts of interest, financial or otherwise, are declared by the author(s).
AUTHOR CONTRIBUTIONS
Author contributions: C.v.M., R.A.B., J.M.S., J.K., and D.B.V. conception and design of research; C.v.M. and R.A.B. performed experiments; C.v.M. analyzed data; C.v.M. and J.M.S. interpreted results of experiments; C.v.M. prepared figures; C.v.M. drafted manuscript; C.v.M., R.A.B., J.M.S., and D.B.V. edited and revised manuscript; C.v.M., R.A.B., J.M.S., J.K., and D.B.V. approved final version of manuscript.
ACKNOWLEDGMENTS
We acknowledge the assistance of Lucas Carvajal, Mark Van Criekinge, Galen Reed, and Christine Leon with experiments in this study.
REFERENCES
- 1.Ardenkjaer-Larsen JH, Fridlund B, Gram A, Hansson G, Hansson L, Lerche MH, Servin R, Thaning M, Golman K. Increase in signal-to-noise ratio of >10,000 times in liquid-state NMR. Proc Natl Acad Sci USA 100: 10158–10163, 2003 [DOI] [PMC free article] [PubMed] [Google Scholar]
- 2.Awasthi V, Pathuri G, Agashe HB, Gali H. Synthesis and in vivo evaluation of p-18F-Fluorohippurate as a new radiopharmaceutical for assessment of renal function by PET. J Nucl Med 52: 147–153, 2011 [DOI] [PubMed] [Google Scholar]
- 3.Blount MA, Sim JH, Zhou R, Martin CF, Lu W, Sands JM, Klein JD. Expression of transporters involved in urine concentration recovers differently after cessation of lithium treatment. Am J Physiol Renal Physiol 298: F601–F608, 2010 [DOI] [PMC free article] [PubMed] [Google Scholar]
- 4.Fenton RA, Chou CL, Stewart GS, Smith CP, Knepper MA. Urinary concentrating defect in mice with selective deletion of phloretin-sensitive urea transporters in the renal collecting duct. Proc Natl Acad Sci USA 101: 7469–7474, 2004 [DOI] [PMC free article] [PubMed] [Google Scholar]
- 5.Finberg JP, Peart WS. Renal tubular flow dynamics during angiotensin diuresis in the rat. Br J Pharmacol 39: 357–372, 1970 [DOI] [PMC free article] [PubMed] [Google Scholar]
- 6.Fransen R, Muller HJ, Boer WH, Nicolay K, Koomans HA. Contrast-enhanced dynamic magnetic resonance imaging of the rat kidney. J Am Soc Nephrol 7: 424–430, 1996 [DOI] [PubMed] [Google Scholar]
- 7.Golman K, Ardenkjaer-Larsen JH, Petersson JS, Mansson S, Leunbach I. Molecular imaging with endogenous substances. Proc Natl Acad Sci USA 100: 10435–10439, 2003 [DOI] [PMC free article] [PubMed] [Google Scholar]
- 8.Golman K, in't Zandt R, Thaning M. Real-time metabolic imaging. Proc Natl Acad Sci USA 103: 11270–11275, 2006 [DOI] [PMC free article] [PubMed] [Google Scholar]
- 9.Haacke EM, Brown RW, Thompson MR, Venkatesan R. Magnetic resonance imaging: physical principles and sequence design. New York: Wiley, 1999, p. 876 [Google Scholar]
- 10.Kato A, Sands JM. Urea transport processes are induced in rat IMCD subsegments when urine concentrating ability is reduced. Am J Physiol Renal Physiol 276: F62–F71, 1999 [DOI] [PubMed] [Google Scholar]
- 11.Klein JD, Frohlich O, Blount MA, Martin CF, Smith TD, Sands JM. Vasopressin increases plasma membrane accumulation of urea transporter UT-A1 in rat inner medullary collecting ducts. J Am Soc Nephrol 17: 2680–2686, 2006 [DOI] [PubMed] [Google Scholar]
- 12.Klein JD, Gunn RB, Roberts BR, Sands JM. Downregulation of urea transporters in the renal inner medulla of lithium-fed rats. Kidney Int 61: 995–1002, 2002 [DOI] [PubMed] [Google Scholar]
- 13.Kuo PH, Kanal E, Abu-Alfa AK, Cowper SE. Gadolinium-based MR contrast agents and nephrogenic systemic fibrosis. Radiology 242: 647–649, 2007 [DOI] [PubMed] [Google Scholar]
- 14.Kurhanewicz J, Vigneron DB, Brindle K, Chekmenev EY, Comment A, Cunningham CH, Deberardinis RJ, Green GG, Leach MO, Rajan SS, Rizi RR, Ross BD, Warren WS, Malloy CR. Analysis of cancer metabolism by imaging hyperpolarized nuclei: prospects for translation to clinical research. Neoplasia 13: 81–97, 2011 [DOI] [PMC free article] [PubMed] [Google Scholar]
- 15.Levin MH, de la Fuente R, Verkman AS. Urearetics: a small molecule screen yields nanomolar potency inhibitors of urea transporter UT-B. FASEB J 21: 551–563, 2007 [DOI] [PubMed] [Google Scholar]
- 16.McCullough PA, Stacul F, Becker CR, Adam A, Lameire N, Tumlin JA, Davidson CJ. Contrast-Induced Nephropathy (CIN) Consensus Working Panel: executive summary. Rev Cardiovasc Med 7: 177–197, 2006 [PubMed] [Google Scholar]
- 17.Oken DE, Arce ML, Wilson DR. Glycerol-induced hemoglobinuric acute renal failure in the rat. I. Micropuncture study of the development of oliguria. J Clin Invest 45: 724–735, 1966 [DOI] [PMC free article] [PubMed] [Google Scholar]
- 18.Rasband WS. ImageJ, U.S. National Institutes of Health, Bethesda, Maryland, USA, http://rsb.info.nih.gov/ij/, 1997–2005 [Google Scholar]
- 19.Sands JM, Layton HE. The physiology of urinary concentration: an update. Semin Nephrol 29: 178–195, 2009 [DOI] [PMC free article] [PubMed] [Google Scholar]
- 20.Steinhausen M, Hill E, Parekh N. Intravital microscopical studies of the tubular urine flow in the conscious rat. Pflügers Arch 362: 261–264, 1976 [DOI] [PubMed] [Google Scholar]
- 21.von Morze C, Larson PE, Hu S, Keshari K, Wilson DM, Ardenkjaer-Larsen JH, Goga A, Bok R, Kurhanewicz J, Vigneron DB. Imaging of blood flow using hyperpolarized [13C]urea in preclinical cancer models. J Magn Reson Imaging 33: 692–697, 2011 [DOI] [PMC free article] [PubMed] [Google Scholar]
- 22.Zhang C, Sands JM, Klein JD. Vasopressin rapidly increases phosphorylation of UT-A1 urea transporter in rat IMCDs through PKA. Am J Physiol Renal Physiol 282: F85–F90, 2002 [DOI] [PubMed] [Google Scholar]


