Abstract
Although the two-kidney, one-clip (2K1C) model is widely used as a model of human renovascular hypertension, mechanisms leading to the development of fibrosis and atrophy in the cuffed kidney and compensatory hyperplasia in the contralateral kidney have not been defined. Based on the well-established role of the transforming growth factor (TGF)-β signaling pathway in renal fibrosis, we tested the hypothesis that abrogation of TGF-β/Smad3 signaling would prevent fibrosis in the cuffed kidney. Renal artery stenosis (RAS) was established in mice with a targeted disruption of exon 2 of the Smad3 gene (Smad3 KO) and wild-type (WT) controls by placement of a polytetrafluoroethylene cuff on the right renal artery. Serial pulse-wave Doppler ultrasound assessments verified that blood flow through the cuffed renal artery was decreased to a similar extent in Smad3 KO and WT mice. Two weeks after surgery, systolic blood pressure and plasma renin activity were significantly elevated in both the Smad3 KO and WT mice. The cuffed kidney of WT mice developed renal atrophy (50% reduction in weight after 6 wk, P < 0.0001), which was associated with the development of interstitial fibrosis, tubular atrophy, and interstitial inflammation. Remarkably, despite a similar reduction of renal blood flow, the cuffed kidney of the Smad3 KO mice showed minimal atrophy (9% reduction in weight, P = not significant), with no significant histopathological alterations (interstitial fibrosis, tubular atrophy, and interstitial inflammation). We conclude that abrogation of TGF-β/Smad3 signaling confers protection against the development of fibrosis and atrophy in RAS.
Keywords: renal artery stenosis, TGF-β signaling
atherosclerotic renal artery stenosis (RAS) is an important cause of renovascular hypertension (RVH) and ischemic nephropathy (21). Renal artery atherosclerosis affects 7% of the elderly and nearly half of patients with coronary artery disease or aortoiliac disease (25, 27, 45, 55). RAS of >60% is associated with the development of renal atrophy (47). Mechanisms responsible for the development of renal atrophy have not been established, as blood and oxygen delivery exceeds metabolic requirements in normal kidneys and markers of renal ischemia are not frequently observed in underperfused kidneys (53). Furthermore, in a recent study of humans with atherosclerotic RAS (mean stenosis 71%), renal vein oxygen levels were actually increased, reflecting decreased oxygen consumption and preservation of deep medullary and cortical oxygenation, despite a reduction in renal blood flow and development of renal atrophy (22).
Based on these considerations, optimal management of patients with atherosclerotic RAS is a matter of considerable controversy. In a swine model of atherosclerotic RAS, revascularization failed to restore renal blood flow, microvascular density, or reduce tubulointerstitial injury (16). In humans, surgical approaches to restore blood flow improve renal function or blood pressure control in only about half of patients, with approximately one-quarter showing no significant changes, and up to one-quarter of patients developing progressive deterioration of renal function (51, 52, 54, 56). Clearly, in the setting of RAS, progressive renal injury in the stenotic kidney is not simply due to tissue ischemia. Therapeutic strategies that will effectively retard the progression of chronic kidney disease in patients with severe RAS necessitate an understanding of the basic mechanisms underlying the development of interstitial fibrosis, tubular atrophy, and interstitial inflammation, i.e., morphological characteristics of the atrophic kidney in RVH (30, 58).
Extensive studies of other experimental and human renal diseases have shown that the transforming growth factor (TGF)-β signaling pathway may be involved in the development of chronic renal disease in patients with RVH. This pleiotropic cytokine plays a key role in regulation of the cell cycle, the inflammatory response to tissue injury, and the deposition of extracellular matrix (6, 9, 10, 24, 36, 37). TGF-β signals through a set of transmembrane receptor serine/threonine kinases unique to the larger superfamily of TGF-β-related proteins. The active heterometric receptor complex is formed by binding of ligand to a type II receptor, recruitment and activation of the type I receptor kinase, and phosphorylation of intracellular target proteins (2, 40, 41). Target proteins include the Smad family of proteins (13). Smad2 and Smad3 are directly phosphorylated by the type I receptor kinase, after which they partner with Smad4 and translocate to the nucleus where they act as transcriptional regulators of target genes, including those essential for apoptosis, inflammation, differentiation, and growth inhibition (2, 13, 43). Mice with inactivating mutations of Smad3 have been employed to underscore a critical role for the TGF-β/Smad3 pathway in tissue injury. For example, mice with inactivating mutation of Smad3 have accelerated healing in wound models and reduced fibrosis in a ureteral obstruction model of chronic renal injury (1, 28, 48).
There is evidence that the TGF-β/Smad signaling pathway may play a role in the development of hypertension (7, 50, 61). In patients with hypertensive renal disease, plasma levels of TGF-β correlate with urine albumin excretion and cardiac wall thickness, suggesting that TGF-β may be a marker of severe and progressive hypertensive renal disease (49). Using the widely studied two-kidney, 1-clip (2K1C) model of RVH in C57BL/6 mice, we found that renal atrophy in the stenotic kidney was associated with a marked and persistent induction of TGF-β and Smad3 expression, whereas compensatory hyperplasia of the contralateral kidney was associated with a transient upregulation of TGF-β1 and Smad3 expression (11). There is correlative evidence that statins reduce TGF-β1 expression in patients with severe RVH (30) and may reduce fibrosis in pigs fed a high-fat diet and subjected to RAS (8). Finally, TGF-β-neutralizing antibodies have demonstrated a protective effect in rat models of hypertension (12, 33).
Based on these considerations, we sought to test the hypothesis that abrogation of signaling through Smad3 will prevent the development of renal fibrosis in the stenotic kidney in the murine 2K1C model of RVH.
MATERIALS AND METHODS
Animals.
129-Smad3tm1Par/J breeder pairs were obtained from The Jackson Laboratory (Bar Harbor, ME). These mice, donated by Parada, were generated by targeted disruption of exon 2 of the Smad3 gene (62). A colony was established and maintained by heterozygous breeding. Genotyping was done by PCR amplification of wild-type (WT) and mutant Smad3 alleles in genomic DNA obtained from tail samples using primers designed by The Jackson Laboratory. Studies were conducted using male and female littermate Smad3 KO and WT mice at ∼15–20 wk of age. We have recently employed these mutant mice in studies of ischemic acute kidney injury (44). All animal procedures were performed in accordance with National Institutes of Health Guide for the Care and Use of Laboratory Animals and approved by the Mayo Clinic Institutional Animal Care and Use Committee. Animals were maintained in a USDA/AAALAC approved environment with access to standard chow and water ad libitum.
Surgical procedures.
RAS surgery was performed on mice anesthetized with ketamine and xylazine (100 mg/kg and 10 mg/kg ip, respectively). The kidney was exposed through a small flank incision, the renal artery was isolated, and a small segment was dissected free of the renal vein. RAS was initiated in 29 WT mice and 27 Smad3 KO mice by placement of a 0.5-mm length of 0.36-mm (external diameter) × 0.20 mm (internal diameter) polytetrafluoroethylene tubing (Braintree Scientific, Braintree, MA), cut open lengthwise, around the right main renal artery approximately equidistant between the aorta and renal bifurcation. The cuff was closed and held in place by two 10-0 nylon circumferential sutures (Surgical Specialties, Reading, PA). Sham surgeries involving a flank incision and isolation of the renal artery without placement of a cuff were performed on 14 WT mice and 23 Smad3 KO mice. Renal artery diameter in all mice was determined at the time of surgery. Once the renal artery was exposed, the area in which the cuff was placed was imaged with a Leica MZ 12.5 dissecting microscope (Leica Microsystems, Wetzlar, Germany). Renal artery diameter was then measured using the Leica integrated software live measurement module (Leica Application Suite, Leica Microsystems). To verify a reduction in renal perfusion in WT and Smad3 KO mice subjected to RAS, ultrasonography was serially performed in groups of five anesthetized mice (1.5% isoflurane) before surgery, and 3 days, 2 wk, and 4 wk following surgery. Renal artery blood flow volumes were determined by pulse-wave Doppler ultrasound using the Vevo 770 (Visualsonics, Toronto, Canada) equipped with an RMV-704 40-MHz scan head with focal depth of 5.5–6.5 mm. Scans were made ∼0.5–1.5 mm distal the renal artery bifurcation at a frequency of 30 MHz using Doppler angles of <50°. Heart rates were maintained between 300 and 400 beats/min. Doppler flow velocities were used to calculate flow volumes from the equation (velocity time interval × πr2 × heart rate).
Blood pressure was noninvasively measured by determining the tail blood volume with a volume pressure recording (VPR) sensor and an occlusion tail cuff (CODA System, Kent Scientific, Torrington, CT) (17). Measurements were taken in conscious mice before surgery and 2, 4, and 6 wk following RAS or sham surgery. Experiments were terminated after 6 wk, at which point final body weights were recorded, mice were anesthetized with ketamine/xylazine, and a terminal blood sample was collected from the inferior vena cava (IVC) for assessment of renin activity. The kidneys and heart were excised, weighed, and portions of kidney were fixed for histopathological analysis or snap frozen in liquid nitrogen for Western and PCR analyses.
Plasma renin activity assay.
Blood from the IVC was collected in EDTA Vacutainer tubes on ice. The plasma fraction was separated by centrifugation and stored at −80°C until assay. Renin activity in plasma was measured via production of angiotensin I from angiotensinogen using a commercially available GammaCoat Plasma Renin Activity 125I RIA kit (DiaSorin, Stillwater, MN) according to the manufacturer's instructions. Porcine angiotensinogen (A2283, Sigma-Aldrich, St. Louis, MO) substrate was used for the assay.
Histology and immunohistochemistry.
Renal tissue from sham, stenotic, and contralateral kidneys of 6-wk RAS and sham-operated WT and Smad3 KO mice was fixed in 10% neutral buffered formalin, dehydrated, and embedded in paraffin using standard techniques. Histological sections, 5 μm thick, were prepared. Representative sections were stained with hematoxylin-eosin (H&E) or Masson's Trichrome. Immunostaining for collagen 4 was performed using a rabbit polyclonal primary antibody from Acris Antibodies, (San Diego, CA). A Vectastain ABC kit (Vector Laboratories, Burlingame, CA) was used for blocking, secondary antibody, and amplification steps. NovaRed (Vector) was used for color development.
Assessment of histopathological features.
Sections were analyzed in a blinded and random fashion using a Leica DMLB microscope (Leica Microsystems), a Micropublisher 3.3 RTV camera (Q-Imaging, Surrey, BC), and the MetaVue Imaging System (V.6.3r2, Universal Imaging, Downington, PA). The number of kidneys showing atrophy involving >5% of the cortical surface area was assessed on H&E-stained slides. Glomerular planar surface area and interstitial fibrosis measurements were determined on trichrome-stained slides. Glomeruli were visualized using a ×20/0.50 objective, and the area was measured using MetaVue's Trace Region function to map out the capillary loop. Only glomeruli with a vascular pole were taken into account.
Quantitative analysis of trichrome-positive extracellular matrix and collagen 4 deposition (as assessed on histological sections of renal parenchyma immunostained for collagen 4) was performed with the MetaVue Imaging System, as previously described (14). In brief, the entire cortex was systematically analyzed as a series of consecutive fields. For each field, a region of interest containing tubules and interstitium, but excluding glomeruli and large vessels, was defined. The total area of each region of interest was calculated as the percentage of positively staining material relative to the area of the entire region of interest. Results for each region of interest, obtained over the entire renal cortex, were averaged to provide a percentage of total cortical tubulointerstitial area.
Quantitative real-time PCR.
Total RNA was extracted from the renal cortex from sham, stenotic, and contralateral kidneys of 6-wk RAS and sham-operated WT and Smad3 KO mice using an RNeasy Mini Plus kit (Qiagen, Valencia, CA) according to the manufacturer's protocol. Total RNA was quantified using spectrophotometry (Nanodrop; NanoDrop Technologies, Wilmington, DE). The quality of the RNA, expressed as the RNA integrity number (RIN), was measured by Agilent 2100 Bioanalyzers (Agilent Technologies, Santa Clara, CA) and ranged from 7.4 to 10. First-strand cDNA was prepared from 1 μg total RNA using an iScript cDNA synthesis Kit (Bio-Rad, Hercules, CA). PCR amplification reactions were performed in a total volume of 20 μl using SYBR Green ER qPCR SuperMix (Invitrogen, Carlsbad, CA) on a Bio-Rad iQ5 real-time PCR detection system or an ABI 7900HT (Applied Biosystems Technology, Foster City, CA). Cycling conditions were composed of 2 min at 50°C, 10 min at 95°C, and 40 cycles of 10 s at 95°C and 30 s at 60°C, followed by a dissociation curve analysis from 55°C to 95°C. Validated primer pairs used for each target gene [renin, TGF-β1, TGF-β2, TGF-β3, TGF-β receptor (R) 1, TGF-βR2, collagens COL1A1, COL3A1, and COL4A1] were obtained from SA Biosciences (Frederick, MD). mRNA expression, relative to reference genes, was calculated using the comparative Cq method (2−ΔΔCq). For each gene of interest, data are presented proportional to WT sham expression.
Statistical analysis.
Data are presented as means ± SE. Pairwise comparisons were evaluated using the Mann-Whitney test for nonparametric data. Comparisons involving more than two groups were performed using one-way ANOVA followed by pairwise testing using the Tukey-Kramer honestly significant differences test. P values <0.05 were considered significant.
RESULTS
Baseline characteristics of WT and Smad3 KO mice.
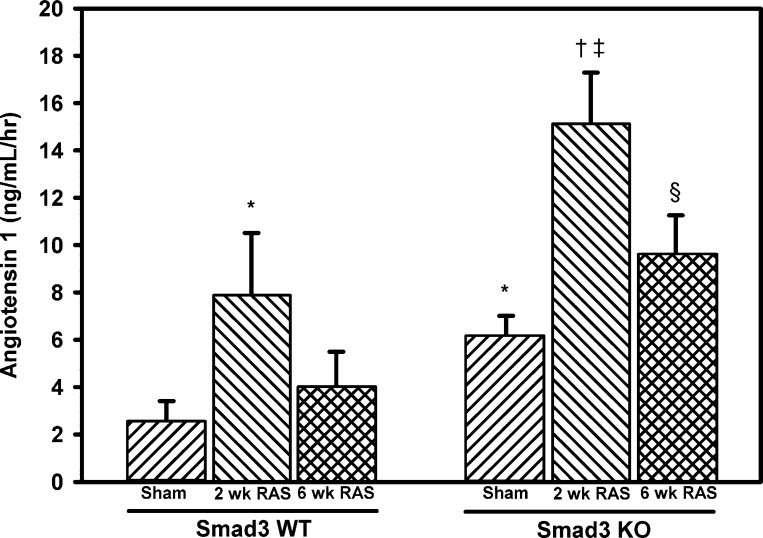
Sham surgeries were performed on 14 WT mice and 23 Smad3 KO mice. The mean age at death was 21.7 ± 0.8 wk for the WT mice and 20.6 ± 0.5 wk for the Smad3 KO mice (P = NS). The mean body weight of the Smad3 KO mice was 14% less than that of WT mice (P < 0.05; Table 1). No differences were observed in mean systolic blood pressure between sham-operated WT and Smad3 KO mice. However, basal plasma renin activity, as assessed by angiotensin I production in sham-operated mice, was significantly greater in the Smad3 KO mice than WT mice (6.09 ± 0.92 vs. 2.56 ± 0.85 ng·ml−1·h−1, P = 0.0045; Fig. 1).
Table 1.
Characteristics of WT and Smad3 KO mice 6 wk following RAS
| Smad3 WT |
Smad3 KO |
|||
|---|---|---|---|---|
| Sham (n = 14) | RAS (n = 29) | Sham (n = 23) | RAS (n = 27) | |
| Body weight, g | 25.1 ± 1.1 | 23.2 ± 0.3 | 21.6 ± 0.8* | 22.1 ± 0.6 |
| Heart weight, mg | 129 ± 6 | 154 ± 5* | 133 ± 8 | 208 ± 11†‡ |
| Kidney weight, mg | ||||
| Sham or cuffed kidney | 167 ± 9 | 83 ± 9* | 139 ± 7* | 126 ± 8‡ |
| Contralateral kidney | 164 ± 9 | 181 ± 6* | 135 ± 7* | 162 ± 7†‡ |
| Glomerular area, μm2 | ||||
| Sham or cuffed kidney | 5,042 ± 157 | 4,795 ± 230 | 5,185 ± 149 | 4,868 ± 229 |
| Contralateral kidney | 5,014 ± 170 | 6,089 ± 202* | 5,277 ± 136 | 5,538 ± 196 |
| RAS cuffed kidneys with atrophy | 0/14 | 22/29 | 0/23 | 3/27 |
Values are means ± SE. WT, wild-type; KO, knockout; sham, sham-operated; RAS, renal artery stenosis.
P < 0.05 vs. WT sham.
P < 0.05 vs. KO sham.
P < 0.05 vs. WT RAS.
Fig. 1.
Plasma renin activity is greater in Smad3-deficient (KO) than wild-type (WT) mice and is induced by renal artery stenosis (RAS) in both KO and WT animals. At 2 and 6 wk following RAS or sham surgery, renin activity in EDTA plasma was assessed via production of angiotensin I from exogenously added angiotensinogen substrate using a GammaCoat Renin Activity 125I RIA (DiaSorin, Stillwater, MN). Values are means ± SE of ≥10 mice/group. *P < 0.05 vs. WT sham. †P < 0.05 vs. KO sham. ‡P < 0.05 vs. WT 2 wk RAS. §P < 0.05 vs. WT 6 wk RAS.
There was no difference in mean heart weight between sham-operated Smad3 KO and WT mice (Table 1). Although the Smad3 KO kidneys were 16.7% smaller than WT kidneys (P ≤ 0.05), there was no difference in renal artery diameter between the Smad3 KO and WT mice (0.2509 ± 0.0014 vs. 0.2502 ± 0.0013 mm, n = 57 for each). Renal morphology was normal in both the Smad3 KO and WT mice; there was no interstitial fibrosis, tubular atrophy, interstitial inflammation, or vascular sclerosis in either group. Mean glomerular area was similar in Smad3 KO and WT mice (Table 1).
RAS reduces renal blood flow and promotes hypertension and cardiac hypertrophy in both Smad3 KO and WT mice.
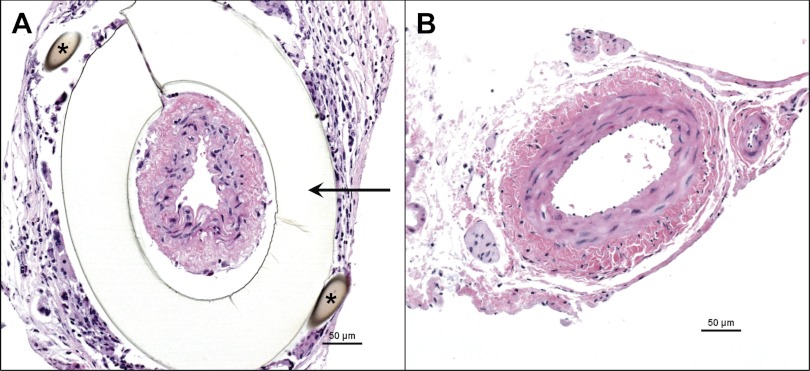
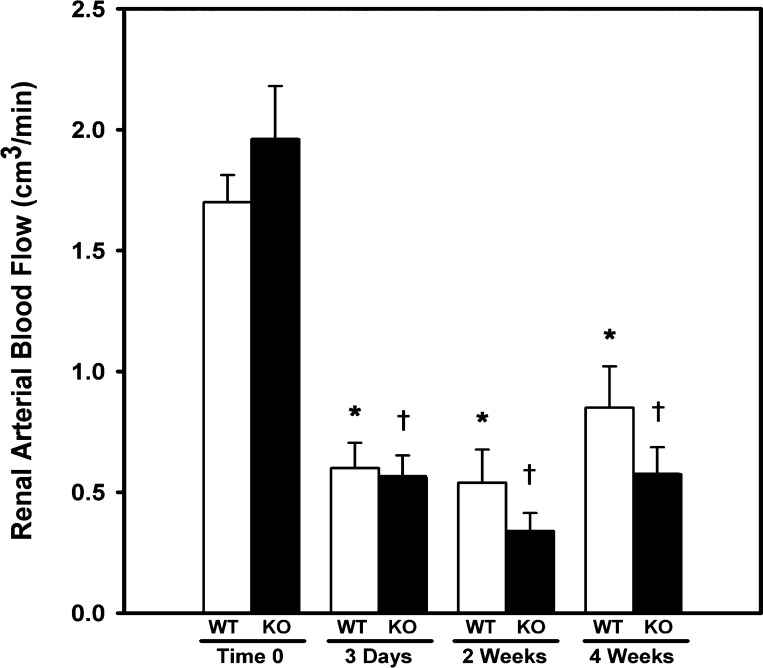
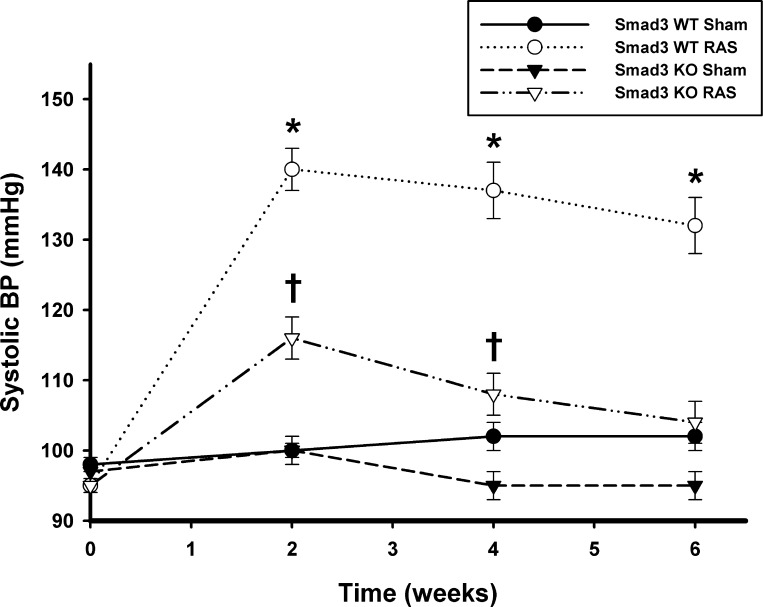
WT (n = 29) and Smad3 KO (n = 27) mice underwent RAS surgery; no gender-related differences in response to RAS were observed in WT or Smad3 KO mice. Representative histological sections of the right (cuffed) and left (contralateral) renal arteries of a Smad3 KO mouse 6 wk after placement of the cuff are shown in Fig. 2. To confirm that placement of a cuff on the right renal artery reduced renal blood flow to a similar extent in the Smad3 KO and WT mice, serial ultrasound measurements of renal blood flow were obtained in Smad3 KO and WT mice (n = 5/group) before surgery, and 3 days, 2 wk, and 4 wk after surgery. Before placement of the cuff, there was no difference in blood flow through the right renal artery between WT (1.70 cm3/min) and Smad3 KO (1.96 cm3/min) mice [P = not significant (NS), ANOVA; Fig. 3]. Blood flow through the right renal artery of Smad3 KO mice was reduced by 69.2% at 3 days, 83.2% at 2 wk, and 67.2% at 4 wk following placement of the cuff (P < 0.001 for all vs. time 0; ANOVA). In WT mice, renal blood flow was reduced by 61.8% at 3 days, 68.6% at 2 wk, and 50.6% at 4 wk following cuff placement (P < 0.001 for all vs. time 0; ANOVA). The reduction in renal arterial blood flow was similar in Smad3 KO and WT mice at all time points (P = NS.; ANOVA). Systolic blood pressure became elevated in both WT and Smad3 KO RAS mice, increasing from a baseline of 95 ± 1 mmHg for both to 140 ± 3 in the WT mice and 116 ± 3 mmHg in the Smad3 KO mice by 2 wk after surgery (P < 0.0001 for both, Fig. 4). The extent of blood pressure elevation in WT mice following RAS was significantly greater than in Smad3 KO mice (P < 0.0001 for all time points) and was sustained throughout the 6-wk study. In Smad3 KO RAS mice, however, blood pressure levels returned almost to baseline levels by the end of the study (Fig. 4).
Fig. 2.
Surgical cuff placement on right renal artery produces RAS. Representative histological sections (hematoxylin and eosin stain) of cuffed and contralateral renal arteries obtained from a Smad3 KO mouse 6 wk after placement of polytetrafluoroethylene cuff (indicated by arrow). Suture (*) is surrounded by a localized foreign body reaction.
Fig. 3.
Blood flow through the cuffed renal artery is reduced to the same extent in both WT and Smad3 KO mice. Repeated measurements of renal arterial blood flow were obtained by pulse-wave Doppler ultrasonography preoperatively and 3 days, 2 wk, and 4 wk following 2 kidney, 1 clip (2K1C) surgery. Values are means ± SE of ≥5 mice/group. *P < 0.05 vs. WT time 0. †P < 0.05 vs. KO time 0.
Fig. 4.
Systolic blood pressure (BP) in both WT and Smad3 KO mice becomes elevated following RAS. Measurements were taken in conscious mice before surgery and 2, 4, and 6 wk after surgery by the tail-cuff method (CODA System). Values are mean ± SE of ≥10 mice/group. *P < 0.05 vs. WT sham (Sh). †P < 0.05 vs. KO Sh.
Plasma renin activity is increased in both WT and Smad3 KO mice subjected to RAS surgery.
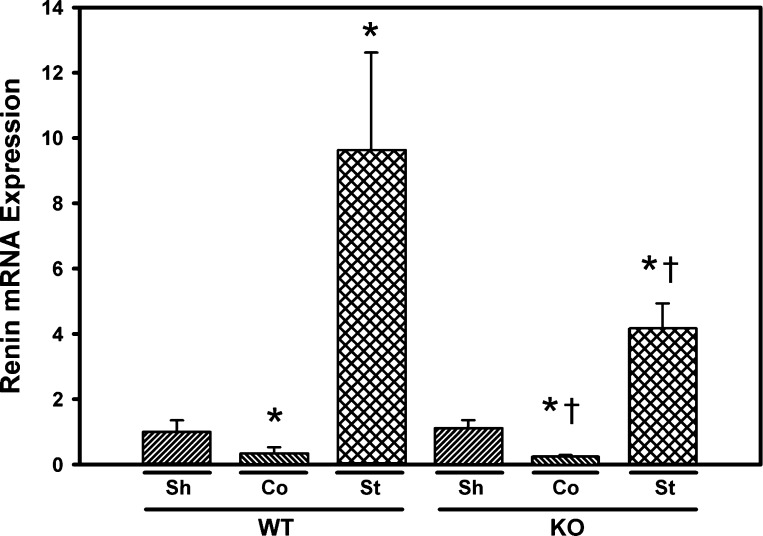
Plasma renin activity, as assessed by angiotensin I content, was transiently elevated in both the Smad3 KO and WT mice (Fig. 1). Two weeks following surgery, plasma renin activity increased from a baseline of 2.56 ± 0.85 to 7.92 ± 2.60 ng·ml−1·h−1 in the WT mice (P < 0.05) and from a baseline of 6.09 ± 0.92 to 15.04 ± 2.24 ng·ml−1·h−1 in the Smad3 KO mice (P < 0.05). After 6 wk, renin activity decreased in both the Smad3 KO mice and WT mice to levels not significantly different from baseline values (Fig. 1). Basal renin mRNA expression in renal cortex was similar in WT and Smad3 KO mice (Fig. 5). At 6 wk following RAS surgery, renin mRNA expression was significantly increased in the stenotic kidneys of both WT and Smad3 KO mice. Expression of renin mRNA was significantly decreased in the contralateral kidneys of both WT and Smad3 KO mice subjected to RAS (Fig. 5). Cardiac hypertrophy, as assessed by mean heart weight in 6-wk RAS mice compared with sham controls, was observed in both Smad3 KO and WT mice (55 ± 9%, P < 0.0001, and 20 ± 4%, P = 0.0044, respectively). However, the extent of cardiac hypertrophy in Smad3 KO RAS mice was significantly greater than that observed in WT RAS mice (P < 0.0001; Table 1).
Fig. 5.
Renin mRNA expression is increased in the cuffed (stenotic; St) kidneys of both WT and Smad3 KO mice. Gene expression was measured by real-time PCR analysis of total RNA obtained from renal cortex of WT and Smad3 KO mice 6 wk after surgery. Fold-differences were calculated by the 2−ΔΔCq method, relative to reference genes. Co, RAS contralateral kidney; St, RAS stenotic kidney. Values are means ± SE, expressed proportional to WT sham. *P < 0.05 vs. WT Sh. †P < 0.05 vs. KO Sh.
The cuffed kidney of Smad3 KO mice does not develop renal atrophy, despite reduced blood flow.
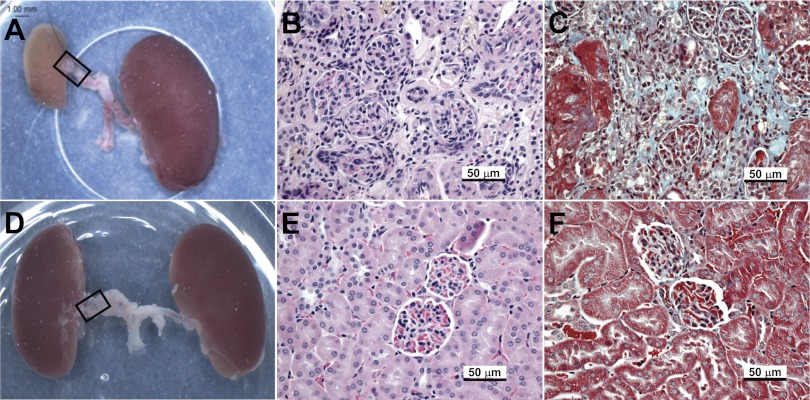
Mean kidney and body weight of mice killed 6 wk after induction of RAS are shown in Table 1. In WT mice, the cuffed kidney developed atrophy, with a 50% reduction in weight compared with sham control (P < 0.05); the contralateral kidney increased in weight by 10% (P = NS). In the Smad3 KO mice, the cuffed kidney did not change in weight (−9%, P = NS), although the contralateral kidney increased in weight by 20% (P < 0.05, Table 1). Representative gross images of cuffed and contralateral kidneys from WT and Smad3 KO mice 6 wk after RAS are shown in Fig. 6, A and D.
Fig. 6.
The cuffed (stenotic) kidney of Smad3 KO mice does not develop atrophy, despite reduced blood flow. Representative images of gross and microscopic changes in WT (A–C) and Smad3 KO (D–F) kidneys 6 wk after RAS cuff surgery are shown. Gross images (A and D) were captured at time of death; RAS tubing cuff is outlined by a black rectangle. Histological sections were stained with hematoxylin and eosin (B and E) or Masson's Trichrome (C and F).
Histopathological findings in stenotic and contralateral kidneys of RAS mice.
In WT mice, the decrease in kidney weight in the stenotic kidney was associated with the development of tubular atrophy, as evidenced by decreased glomerular spacing. Multifocal tubular atrophy, characterized by flattening and simplification of tubular epithelium and thickening of tubular basement membranes, was noted in the stenotic kidney in 22 of 29 WT RAS mice (Fig. 6B). Tubular atrophy was associated with a generalized increase in interstitial deposition of extracellular matrix. Focal mononuclear inflammatory infiltrates were identified within the interstitium. Small- and medium-size arteries showed medial hypertrophy and focal intimal sclerosis. The contralateral kidney showed minimal histopathological alterations, i.e., no significant glomerular sclerosis, interstitial fibrosis, tubular atrophy, or interstitial inflammation. These findings are similar to those described in our previous study of RAS in C57BL/6 mice (11). The stenotic kidneys of the Smad3 KO mice, on the other hand, showed only isolated foci of interstitial fibrosis and tubular atrophy (3 of 27 mice). No significant interstitial inflammation was noted in any of the Smad3 KO kidneys (Fig. 6E). As in the WT mice, the contralateral kidney of the Smad3 KO mice showed minimal histopathological alterations.
The mean glomerular planar surface area was increased by 21% in the contralateral kidneys of WT mice subjected to RAS (P = 0.0015; Table 1). The mean glomerular planar surface area of the contralateral kidneys of Smad3 KO mice did not significantly change (+5%, P = NS). By semiquantitative histopathological analysis, the extent of tubular atrophy in the cuffed kidney of WT mice (48 ± 8%) was significantly greater than that of Smad3 KO mice (10 ± 5%, P = 0.0002). By quantitative histopathological analysis of trichrome-stained slides using the MetaVue Imaging System, the percentage of extracellular matrix compared with total tubulointerstitial area was 0.07 ± 0.02 for the WT sham kidneys and 0.05 ± 0.02 for the KO sham kidneys (P = NS). In WT mice, extracellular matrix deposition was significantly increased in the cuffed (8.63 ± 0.97%, P <0.05, Fig. 6C), but not contralateral (0.16 ± 0.04%) kidneys. In the KO mice, there was no significant increase in extracellular matrix deposition in either the cuffed (0.05 ± 0.01%, Fig. 6F) or contralateral (0.03 ± 0.01%) kidneys.
TGF-β1, -2, and -3 are induced to a greater extent in the stenotic kidney of WT mice than Smad3 KO mice.
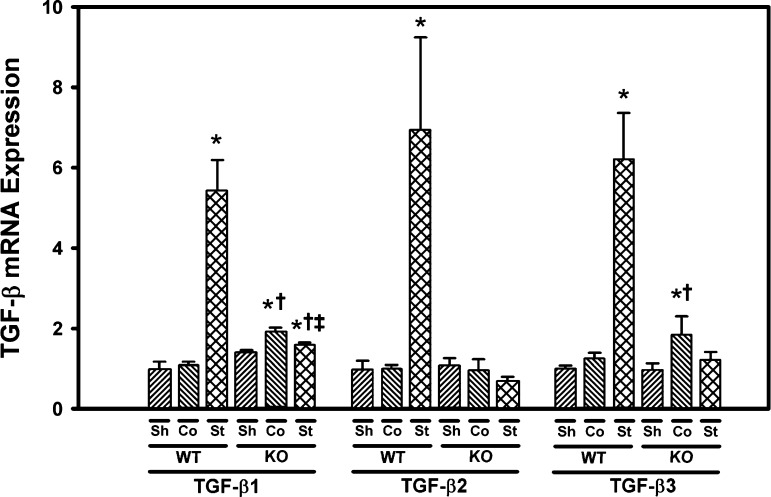
Expression of TGF-β1, -2, and -3 mRNA in the renal cortex was assessed by real-time PCR. Basal expression of TGF-β1, -2, and -3 was similar in the renal cortex isolated from sham control WT mice and Smad3 KO mice. TGF-β1, -2, and -3 were all significantly induced in the stenotic, but not contralateral, kidneys of WT mice subjected to RAS. In Smad3 KO mice, TGF-β1 mRNA expression increased by 13% in the stenotic kidney compared with sham control (P = 0.02). However, this induction was significantly less than that observed in the stenotic kidney of WT mice subjected to RAS (P = 0.0004, Fig. 7). TGF-β2 and -3 expression was not significantly increased in the stenotic kidneys of Smad3 KO mice subjected to RAS. TGF-β1 and TGF-β3 were induced in the contralateral kidneys of Smad3 KO mice subjected to RAS (Fig. 7).
Fig. 7.
Transforming growth factor (TGF)-β expression is increased in the cuffed (stenotic) kidneys of WT, but not Smad3 KO mice. Gene expression was measured by real-time PCR analysis of total RNA obtained from the renal cortex of WT and Smad3 KO mice 6 wk after surgery. Fold-differences were calculated by the 2−ΔΔCq method, relative to reference genes. Values are means ± SE, expressed proportional to WT sham. *P < 0.05 vs. WT Sh. †P < 0.05 vs. KO Sh. ‡P < 0.05 vs. WT St.
TGF-βR1 and -2 expression is induced in the stenotic kidney of WT, but not Smad3 KO mice.
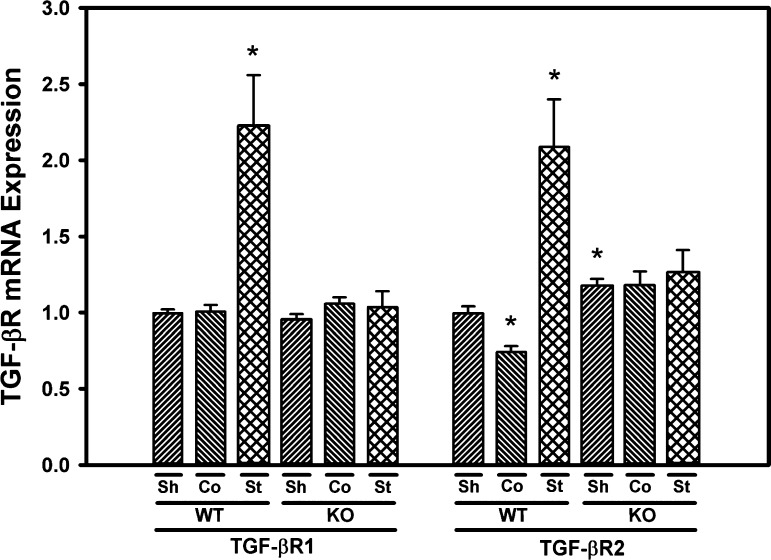
Basal expression of TGF-βR1 was similar in the renal cortex of WT and Smad3 KO mice. Expression of TGF-βR1 was significantly induced in the stenotic, but not contralateral, kidneys of WT mice subjected to RAS. No significant induction of TGF-βR1 was observed in the stenotic or contralateral kidneys of Smad3 KO mice subjected to RAS. Basal expression of TGF-βR2 was 18% higher in Smad3 KO sham control mice compared with WT mice (P = 0.009). TGF-βR2 expression was significantly increased in the stenotic kidney and decreased in the contralateral kidney of WT mice subjected to RAS, whereas no significant change in TGF-βR2 expression was observed in the stenotic or contralateral kidneys of Smad3 KO mice subjected to RAS (Fig. 8).
Fig. 8.
Expression of TGF-β receptors (TGF-βR1 and TGF-βR2) is upregulated in the cuffed (stenotic) kidneys of WT, but not Smad3 KO mice. Gene expression was measured by real-time PCR analysis of total RNA obtained from the renal cortex of WT and Smad3 KO mice 6 wk after surgery. Fold-differences were calculated by the 2−ΔΔCq method, relative to reference genes. Values are means ± SE, expressed proportional to WT sham. *P < 0.05 vs. WT Sh.
Collagen 1, -3, and -4 expression is induced in the stenotic kidney of WT, but not Smad3 KO mice.
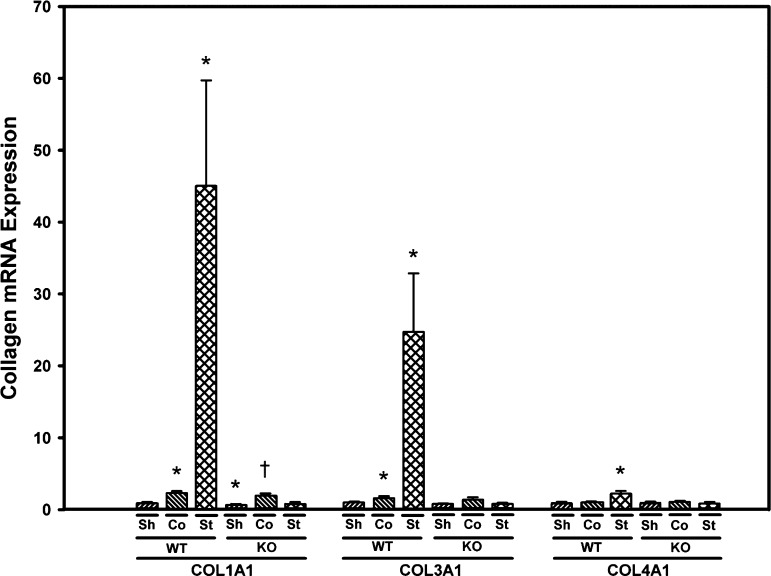
Basal expression of COL1A1 was 30% lower in Smad3 KO mice compared with WT mice (P = 0.04); basal expression of COL3A1 and COL4A1 was similar in WT and Smad3 KO mice (Fig. 9). Expression of COL1A1, COL3A1, and COL4A1 were all significantly induced in the stenotic kidney of WT, but not Smad3 KO mice subjected to RAS. COL1A1 expression was increased by about twofold in the contralateral kidneys of both WT and Smad3 KO mice subjected to RAS (Fig. 9). Immunohistochemical staining for collagen 4 confirmed the qPCR results: a significant increase in collagen 4 deposition in the stenotic, but not contralateral kidneys of WT mice. Collagen 4 deposition was increased in the stenotic kidneys of Smad3 KO mice subjected to RAS, although the extent of induction was significantly less than that observed in the stenotic kidney of WT mice subjected to RAS (Fig. 10). Patterns of collagen 3 deposition in WT and Smad3 KO mice subjected to RAS were similar to those observed for collagen 4 (data not shown).
Fig. 9.
Collagen expression is increased in the cuffed (stenotic) kidneys of WT, but not Smad3 KO mice. Gene expression was measured by real-time PCR analysis of total RNA obtained from renal cortex of WT and Smad3 KO mice 6 wk after surgery. Fold-differences were calculated by the 2−ΔΔCq method, relative to reference genes. Values are means ± SE, expressed proportional to WT sham. *P < 0.05 vs. WT Sh. †P < 0.05 vs. KO Sh.
Fig. 10.
Interstitial collagen 4 deposition is increased in the stenotic kidney of WT, compared with Smad3 KO mice. Collagen 4 immunostaining of renal cortex from WT (A–C) and Smad3 KO (D–F) mice 6 wk following surgery is shown. A and D: sham control kidneys. B and E: RAS contralateral kidneys. C and F: RAS stenotic kidneys. Graph values are means ± SE. *P < 0.05 vs. WT Sh. †P < 0.05 vs. KO Sh. ‡P < 0.05 vs. WT St.
DISCUSSION
Our studies demonstrate that creation of experimental RAS produces a rise in renin activity, elevation in blood pressure, cardiac hypertrophy, and reduced blood flow to the kidney in both WT and Smad3 KO mice. We have previously shown that Smad3 is induced in the stenotic kidney following RAS (11). We now report that genetic deficiency of Smad3 is associated with far less parenchymal injury in the cuffed kidney. Based on these findings, we conclude that TGF-β signaling through Smad3 directly contributes to the interstitial fibrosis, tubular atrophy, and interstitial inflammation observed in the cuffed kidney in the 2K1C model of RVH, suggesting that this pathway may provide a novel therapeutic target for preventing chronic renal disease in patients with RAS and subsequent RVH.
Unlike mice with homozygous deletion of the TGF-β gene, which have a high rate of embryonic lethality with surviving mice developing systemic inflammation leading to death within 2–4 wk (4, 31, 32, 34, 39), the Smad3 KO mice are viable well into adulthood. We did not observe any significant morphological abnormalities of the kidneys or cardiovascular system at baseline. There were no significant differences in baseline blood pressure between Smad3 KO and WT mice. However, Smad3 KO mice had significantly higher baseline plasma renin activity than WT mice. The kidneys of the sham-operated WT and Smad3 KO mice showed no significant morphological abnormalities; in particular, there was no significant interstitial fibrosis, tubular atrophy, or glomerular sclerosis.
In accordance with observations made by other investigators (62), we found that the body weight of Smad3 KO mice was 14% lower than that of age-matched WT mice. Importantly, we found no difference in external renal artery diameter between Smad3 KO and WT mice, as assessed by quantitative analysis of renal arteries viewed, in situ, with a dissecting microscope. To ensure that we were establishing a uniform and reproducible degree of RAS in all animals, we employed a 0.2-mm polytetrafluoroethylene cuff around the renal artery, fixed by two sutures, rather than the silver clips employed in previous studies (11, 57). Pulse-wave Doppler ultrasound analysis verified that blood flow through the cuffed renal artery was decreased to a similar extent in the Smad3 KO and WT mice.
Although blood pressures rose in both the Smad3 KO and WT mice within 1 wk after surgery, at all time points the extent of blood pressure elevation was greater in the WT mice than the Smad3 KO mice. Plasma renin activity at 2 wk after surgery was higher in the Smad3 KO mice than WT mice. We propose that the partial abrogation of hypertension observed in the Smad3 KO mice reflects a decrease in TGF-β signaling due to Smad3 deficiency, as TGF-β-neutralizing antibodies have been shown to reduce blood pressure in rat models of hypertension (12, 33). Furthermore, cardiac hypertrophy, as assessed by mean heart weight, was significantly greater in the Smad3 KO mice than WT mice. Based on these considerations, we conclude that cuff placement produced a hemodynamically significant stenosis of the renal artery, with systemic increases in plasma renin activity and cardiac hypertrophy, in both Smad3 KO and, to a lesser extent, WT mice.
In a recent study of Smad3 KO mice, angiotensin II infusion produced similar elevation of blood pressure in Smad3 KO and WT mice. However, the Smad3 KO mice developed less cardiac hypertrophy, fibrosis, inflammation, and dysfunction than WT mice (26). Our findings, which reflect significant cardiac hypertrophy with less elevation of blood pressure in Smad3 KO mice compared with WT mice, may reflect differences in background strain (C57BL/6 mice vs. the 129/Sv strain used in the studies reported here). It is also possible that the route of angiotensin II administration (exogenous angiotensin II infusion vs. endogenous activation of the renin-angiotensin II system in the RAS model employed here) might have differential effects on the heart. Cardiac hypertrophy has been reported in Smad3 KO mice subjected to transaortic constriction (15); mice expressing a dominant negative mutation of the TGF-β type II receptor and subjected to transverse aortic constriction develop left ventricular dilation and dysfunction (38). These intriguing differences in cardiac response observed between these different models in mice with abrogation of the TGF-β-Smad3 pathway certainly merit further investigation.
In accordance with our previous observations, the cuffed kidney of WT mice developed severe renal atrophy, with multifocal tubular atrophy, interstitial fibrosis, and chronic interstitial inflammation (11). These features are similar to those observed in humans with severe RAS (30). By contrast, the cuffed kidneys of Smad3 KO mice did not undergo significant atrophy, as assessed by kidney weight. There was striking preservation of renal architecture in the cuffed kidney of Smad3 KO mice, showing only isolated foci of interstitial fibrosis and tubular atrophy, with minimal interstitial inflammation. The striking preservation of renal architecture in the cuffed kidney of Smad3 KO mice is particularly notable in that it occurred despite other manifestations of renovascular occlusion, including elevation of plasma renin activity, development of systemic hypertension, and cardiac hypertrophy. These observations underscore the pivotal role of interstitial fibrosis as a major determinant of renal atrophy.
As described in our previous study, in WT mice, the development of renal atrophy in the cuffed kidney was associated with a persistent induction of TGF-β1 expression, and the development of compensatory hyperplasia in the contralateral kidney was associated with a transient induction of TGF-β1 (11). We now demonstrate that the pattern of TGF-β2 and TGF-β3 expression paralleled that of TGF-β1 in kidneys of WT mice subjected to RAS. Induction of TGF-β1, -2, and -3 in the stenotic kidney of Smad3 KO mice was significantly less than that observed in the stenotic kidneys of WT mice, providing evidence that induction of TGF-β in RVH requires an intact Smad3 signaling pathway. Interestingly, expression of TGF-β1, -2, and -3 was similar in sham control Smad3 KO and WT mice, indicating that Smad3 is not required for basal expression of TGF-β.
The blunted TGF-β1 response in the stenotic kidney of Smad3 KO mice is consistent with our recent studies demonstrating that the induction of TGF-β1 following acute occlusive ischemia to the kidney is blunted in Smad3 KO mice (44). Thus, in the stressed kidney, but not the unstressed kidney, there is a positive feedback loop between Smad3 and TGF-β1, the basis for which may reside in the presence of Smad3 binding sites in the TGF-β1 gene promoter. Similarly, expression of TGF-βR1 and -2 was significantly induced in the renal cortex of WT mice, but not of Smad3 KO mice, subjected to RAS.
Based on the well-established role of TGF-β1 as a predominant mediator of fibrosis (23, 24), we sought to determine whether expression of collagen 1, 3, or 4 was altered in Smad3 KO vs. WT mice subjected to RAS. In accordance with our previous study, the development of atrophy in WT mice subjected to RAS was associated with a striking and persistent induction of collagen 1, 3, and 4 (11) mRNA expression. Expression of collagen 1, 3, and 4 in the renal cortex was not significantly induced in Smad3 KO mice subjected to RAS. Basal expression of collagen 3 and 4 was similar in Smad3 KO and WT mice, indicating that Smad3 does not regulate basal collagen expression but is an essential mediator of collagen production following tissue injury.
Our results extend prior findings demonstrating that fibrosis is decreased in Smad3 KO mice subjected to other chronic injury models (3, 5, 18–20, 35). These observations underscore a critical role for Smad3 in fibrosis (42, 60). Wound repair in Smad3 KO mice is characterized by accelerated epithelial cell proliferation, decreased local inflammation, and decreased matrix deposition (1, 29). Smad3 deficiency may be maladaptive in vascular injury models, due to accelerated neointimal hyperplasia (49). However, our results were striking for the near complete protection conferred by Smad3 deficiency against interstitial fibrosis and tubular atrophy of the cuffed kidney in the RAS model. Furthermore, the remarkable renoprotective impact of Smad3 deficiency in the stenotic kidney might have also resulted from attenuated angiotensin II signaling, which activates Smad3 independently of TGF-β (46, 59). The blunted negative feedback on angiotensin II levels could also account for the increase in plasma renin content accompanied by decreased arterial pressure detected in Smad3 KO mice, as observed during blockade of the renin-angiotensin system. Nevertheless, this approach should be applied cautiously, because the increase in heart weight in these mice suggests that the increase in circulating levels of angiotensin II might impose deleterious effects that are not mediated through the defunct Smad3 protein.
In summary, to the best of our knowledge, we provide the first demonstration that signaling through Smad3 is essential for the development of renal atrophy in the stenotic kidney of the 2K1C model of RVH. Although Smad3 is not necessary to support expression of collagen 3 and collagen 4 in the healthy, unstressed kidney, its expression appears to be required for a maladaptive response in RVH that leads to interstitial fibrosis and tubular atrophy in the cuffed kidney. We propose that Smad3 may provide a novel therapeutic target for preserving renal function in patients with severe RVH due to atherosclerotic RAS.
GRANTS
These studies were supported by National Institutes of Health (NIH) Grants P01 HL85307 and NCRR CTSA UL1 RR024150. Its contents are solely the responsibility of the authors and do not necessarily represent the official views of the NIH.
DISCLOSURES
No conflicts of interest, financial or otherwise, are declared by the authors.
AUTHOR CONTRIBUTIONS
Author contributions: G.M.W., J.C., B.E.K., C.E.G., A.D., and J.E.J. performed experiments; G.M.W., J.C., B.E.K., C.E.G., A.D., J.E.J., and J.P.G. analyzed data; G.M.W., J.C., B.E.K., C.E.G., A.D., J.E.J., and J.P.G. interpreted results of experiments; G.M.W., J.C., B.E.K., C.E.G., A.D., and J.E.J. prepared figures; G.M.W., J.C., B.E.K., C.E.G., A.D., J.E.J., and J.P.G. edited and revised manuscript; G.M.W., J.C., B.E.K., C.E.G., A.D., J.E.J., L.O.L., S.C.T., K.A.N., and J.P.G. approved final version of manuscript; L.O.L., S.C.T., K.A.N., and J.P.G. provided conception and design of research; J.P.G. drafted manuscript.
ACKNOWLEDGMENTS
We thank Cherish Grabau for excellent secretarial assistance.
Present address for A. Deibel: Paracelsus Medizinische Privatuniversitat, Salzburg, Austria (e-mail: ansgar.deibel@pmu.ac.at).
REFERENCES
- 1. Ashcroft GS, Yang X, Glick AB, Weinstein M, Letterio JL, Mizel DE, Anzano M, Greenwell-Wild T, Wahl SM, Deng C, Roberts AB. Mice lacking Smad3 show accelerated wound healing and an impaired local inflammatory response. Nat Cell Biol 1: 260–266, 1999 [DOI] [PubMed] [Google Scholar]
- 2. Attisano L, Lee-Hoeflich ST. The Smads. Genome Biol 2: REVIEWS3010, 2001 [DOI] [PMC free article] [PubMed] [Google Scholar]
- 3. Banh A, Deschamps PA, Gauldie J, Overbeek PA, Sivak JG, West-Mays J. Lens-specific expression of TGF-beta induces anterior subcapsular cataract formation in the absence of Smad3. Invest Ophthalmol Vis Sci 47: 3450–3460, 2006 [DOI] [PMC free article] [PubMed] [Google Scholar]
- 4. Boivin GP, O'Toole BA, Orsmby IE, Diebold RJ, Eis MJ, Doetschman T, Kier AB. Onset and progression of pathological lesions in transforming growth factor-beta 1-deficient mice. Am J Pathol 146: 276–288, 1995 [PMC free article] [PubMed] [Google Scholar]
- 5. Bonniaud P, Margetts PJ, Ask K, Flanders K, Gauldie J, Kolb M. TGF-beta and Smad3 signaling link inflammation to chronic fibrogenesis. J Immunol 175: 5390–5395, 2005 [DOI] [PubMed] [Google Scholar]
- 6. Bottinger EP, Bitzer M. TGF-beta signaling in renal disease. J Am Soc Nephrol 13: 2600–2610, 2002 [DOI] [PubMed] [Google Scholar]
- 7. Cambien F, Ricard S, Troesch A, Mallet C, Generenaz L, Evans A, Arveiler D, Luc G, Ruidavets JB, Poirier O. Polymorphisms of the transforming growth factor-beta 1 gene in relation to myocardial infarction and blood pressure. The Etude Cas-Temoin de l'Infarctus du Myocarde (ECTIM) Study. Hypertension 28: 881–887, 1996 [DOI] [PubMed] [Google Scholar]
- 8. Chade AR, Zhu XY, Grande JP, Krier JD, Lerman A, Lerman LO. Simvastatin abates development of renal fibrosis in experimental renovascular disease. J Hypertens 26: 1651–1660, 2008 [DOI] [PubMed] [Google Scholar]
- 9. Cheng J, Grande JP. Transforming growth factor-beta and kidney dysfunction. J Organ Dysfunct 5: 182–192, 2009. [Google Scholar]
- 10. Cheng J, Grande JP. Transforming growth factor-beta signal transduction and progressive renal disease. Exp Biol Med (Maywood) 227: 943–956, 2002 [DOI] [PubMed] [Google Scholar]
- 11. Cheng J, Zhou W, Warner GM, Knudsen BE, Garovic VD, Gray CE, Lerman LO, Platt JL, Romero JC, Textor SC, Nath KA, Grande JP. Temporal analysis of signaling pathways activated in a murine model of 2-kidney, 1-clip hypertension. Am J Physiol Renal Physiol 297: F1055–F1068, 2009 [DOI] [PMC free article] [PubMed] [Google Scholar]
- 12. Dahly AJ, Hoagland KM, Flasch AK, Jha S, Ledbetter SR, Roman RJ. Antihypertensive effects of chronic anti-TGF-β antibody therapy in Dahl S rats. Am J Physiol Regul Integr Comp Physiol 283: R757–R767, 2002 [DOI] [PubMed] [Google Scholar]
- 13. Derynck R, Zhang Y, Feng XH. Smads: transcriptional activators of TGF-beta responses. Cell 95: 737–740, 1998 [DOI] [PubMed] [Google Scholar]
- 14. Diaz Encarnacion M, Griffin M, Slezak J, Bergstralh E, Stegall M, Velosa J, Grande J. Correlation of quantitative digital image analysis with glomerular filtration rate in CAN. Am J Transplant 4: 248–256, 2004 [DOI] [PubMed] [Google Scholar]
- 15. Divakaran V, Adrogue J, Ishiyama M, Entman ML, Haudek S, Sivasubramanian N, Mann DL. Adaptive and maladaptive effects of SMAD3 signaling in the adult heart after hemodynamic pressure overloading. Circ Heart Fail 2: 633–642, 2009 [DOI] [PMC free article] [PubMed] [Google Scholar]
- 16. Favreau F, Zhu XY, Krier JD, Lin J, Warner L, Textor SC, Lerman LO. Revascularization of swine renal artery stenosis improves renal function but not the changes in vascular structure. Kidney Int 78: 1110–1118, 2010 [DOI] [PMC free article] [PubMed] [Google Scholar]
- 17. Feng M, Whitesall S, Zhang Y, Beibel M, D'Alecy L, DiPetrillo K. Validation of volume-pressure recording tail-cuff blood pressure measurements. Am J Hypertens 21: 1288–1291, 2008 [DOI] [PubMed] [Google Scholar]
- 18. Flanders KC. Smad3 as a mediator of the fibrotic response. Int J Exp Pathol 85: 47–64, 2004 [DOI] [PMC free article] [PubMed] [Google Scholar]
- 19. Flanders KC, Major CD, Arabshahi A, Aburime EE, Okada MH, Fujii M, Blalock TD, Schultz GS, Sowers A, Anzano MA, Mitchell JB, Russo A, Roberts AB. Interference with transforming growth factor-beta/ Smad3 signaling results in accelerated healing of wounds in previously irradiated skin. Am J Pathol 163: 2247–2257, 2003 [DOI] [PMC free article] [PubMed] [Google Scholar]
- 20. Fujimoto M, Maezawa Y, Yokote K, Joh K, Kobayashi K, Kawamura H, Nishimura M, Roberts AB, Saito Y, Mori S. Mice lacking Smad3 are protected against streptozotocin-induced diabetic glomerulopathy. Biochem Biophys Res Commun 305: 1002–1007, 2003 [DOI] [PubMed] [Google Scholar]
- 21. Garovic VD, Textor SC. Renovascular hypertension and ischemic nephropathy. Circulation 112: 1362–1374, 2005 [DOI] [PubMed] [Google Scholar]
- 22. Gloviczki ML, Glockner JF, Lerman LO, McKusick MA, Misra S, Grande JP, Textor SC. Preserved oxygenation despite reduced blood flow in poststenotic kidneys in human atherosclerotic renal artery stenosis. Hypertension 55: 961–966, 2010 [DOI] [PMC free article] [PubMed] [Google Scholar]
- 23. Grande JP, Melder DC, Zinsmeister AR. Modulation of collagen gene expression by cytokines: stimulatory effect of transforming growth factor-beta1, with divergent effects of epidermal growth factor and tumor necrosis factor-alpha on collagen type I and collagen type IV. J Lab Clin Med 130: 476–486, 1997 [DOI] [PubMed] [Google Scholar]
- 24. Grande JP, Warner GM, Walker HJ, Yusufi AN, Cheng J, Gray CE, Kopp JB, Nath KA. TGF-beta1 is an autocrine mediator of renal tubular epithelial cell growth and collagen IV production. Exp Biol Med (Maywood) 227: 171–181, 2002 [DOI] [PubMed] [Google Scholar]
- 25. Hansen KJ, Edwards MS, Craven TE, Cherr GS, Jackson SA, Appel RG, Burke GL, Dean RH. Prevalence of renovascular disease in the elderly: a population-based study. J Vasc Surg 36: 443–451, 2002 [DOI] [PubMed] [Google Scholar]
- 26. Huang XR, Chung AC, Yang F, Yue W, Deng C, Lau CP, Tse HF, Lan HY. Smad3 mediates cardiac inflammation and fibrosis in angiotensin II-induced hypertensive cardiac remodeling. Hypertension 55: 1165–1171, 2010 [DOI] [PubMed] [Google Scholar]
- 27. Iglesias JI, Hamburger RJ, Feldman L, Kaufman JS. The natural history of incidental renal artery stenosis in patients with aortoiliac vascular disease. Am J Med 109: 642–647, 2000 [DOI] [PubMed] [Google Scholar]
- 28. Inazaki K, Kanamaru Y, Kojima Y, Sueyoshi N, Okumura K, Kaneko K, Yamashiro Y, Ogawa H, Nakao A. Smad3 deficiency attenuates renal fibrosis, inflammation, and apoptosis after unilateral ureteral obstruction. Kidney Int 66: 597–604, 2004 [DOI] [PubMed] [Google Scholar]
- 29. Jinno K, Takahashi T, Tsuchida K, Tanaka E, Moriyama K. Acceleration of palatal wound healing in Smad3-deficient mice. J Dent Res 88: 757–761, 2009 [DOI] [PubMed] [Google Scholar]
- 30. Keddis MT, Garovic VD, Bailey KR, Wood CM, Raissian Y, Grande JP. Ischaemic nephropathy secondary to atherosclerotic renal artery stenosis: clinical and histopathological correlates. Nephrol Dial Transplant 25: 3615–3622, 2010 [DOI] [PMC free article] [PubMed] [Google Scholar]
- 31. Kulkarni AB, Huh CG, Becker D, Geiser A, Lyght M, Flanders KC, Roberts AB, Sporn MB, Ward JM, Karlsson S. Transforming growth factor beta 1 null mutation in mice causes excessive inflammatory response and early death. Proc Natl Acad Sci USA 90: 770–774, 1993 [DOI] [PMC free article] [PubMed] [Google Scholar]
- 32. Kulkarni AB, Karlsson S. Transforming growth factor-beta 1 knockout mice. A mutation in one cytokine gene causes a dramatic inflammatory disease. Am J Pathol 143: 3–9, 1993 [PMC free article] [PubMed] [Google Scholar]
- 33. Lavoie P, Robitaille G, Agharazii M, Ledbetter S, Lebel M, Lariviere R. Neutralization of transforming growth factor-beta attenuates hypertension and prevents renal injury in uremic rats. J Hypertens 23: 1895–1903, 2005 [DOI] [PubMed] [Google Scholar]
- 34. Letterio JJ, Geiser AG, Kulkarni AB, Roche NS, Sporn MB, Roberts AB. Maternal rescue of transforming growth factor-beta 1 null mice. Science 264: 1936–1938, 1994 [DOI] [PubMed] [Google Scholar]
- 35. Lin HM, Lee JH, Yadav H, Kamaraju AK, Liu E, Zhigang D, Vieira A, Kim SJ, Collins H, Matschinsky F, Harlan DM, Roberts AB, Rane SG. Transforming growth factor-beta/Smad3 signaling regulates insulin gene transcription and pancreatic islet beta-cell function. J Biol Chem 284: 12246–12257, 2009 [DOI] [PMC free article] [PubMed] [Google Scholar]
- 36. Liu Y. Epithelial to mesenchymal transition in renal fibrogenesis: pathologic significance, molecular mechanism, and therapeutic intervention. J Am Soc Nephrol 15: 1–12, 2004 [DOI] [PubMed] [Google Scholar]
- 37. Liu Y. Renal fibrosis: new insights into the pathogenesis and therapeutics. Kidney Int 69: 213–217, 2006 [DOI] [PubMed] [Google Scholar]
- 38. Lucas JA, Zhang Y, Li P, Gong K, Miller AP, Hassan E, Hage F, Xing D, Wells B, Oparil S, Chen YF. Inhibition of transforming growth factor-β signaling induces left ventricular dilation and dysfunction in the pressure-overloaded heart. Am J Physiol Heart Circ Physiol 298: H424–H432, 2010 [DOI] [PMC free article] [PubMed] [Google Scholar]
- 39. Martin JS, Dickson MC, Cousins FM, Kulkarni AB, Karlsson S, Akhurst RJ. Analysis of homozygous TGF beta 1 null mouse embryos demonstrates defects in yolk sac vasculogenesis and hematopoiesis. Ann NY Acad Sci 752: 300–308, 1995 [DOI] [PubMed] [Google Scholar]
- 40. Massague J. Receptors for the TGF-beta family. Cell 69: 1067–1070, 1992 [DOI] [PubMed] [Google Scholar]
- 41. Massague J. TGF-beta signal transduction. Annu Rev Biochem 67: 753–791, 1998 [DOI] [PubMed] [Google Scholar]
- 42. Massague J, Seoane J, Wotton D. Smad transcription factors. Genes Dev 19: 2783–2810, 2005 [DOI] [PubMed] [Google Scholar]
- 43. Massague J, Wotton D. Transcriptional control by the TGF-beta/Smad signaling system. EMBO J 19: 1745–1754, 2000 [DOI] [PMC free article] [PubMed] [Google Scholar]
- 44. Nath KA, Croatt AJ, Warner GM, Grande JP. Genetic deficiency of Smad3 protects against murine ischemic acute kidney injury. Am J Physiol Renal Physiol 301: F436–F442, 2011 [DOI] [PMC free article] [PubMed] [Google Scholar]
- 45. Rihal CS, Textor SC, Breen JF, McKusick MA, Grill DE, Hallett JW, Holmes DR., Jr Incidental renal artery stenosis among a prospective cohort of hypertensive patients undergoing coronary angiography. Mayo Clin Proc 77: 309–316, 2002 [DOI] [PubMed] [Google Scholar]
- 46. Rodriguez-Vita J, Sanchez-Lopez E, Esteban V, Ruperez M, Egido J, Ruiz-Ortega M. Angiotensin II activates the Smad pathway in vascular smooth muscle cells by a transforming growth factor-beta-independent mechanism. Circulation 111: 2509–2517, 2005 [DOI] [PubMed] [Google Scholar]
- 47. Safian RD, Textor SC. Renal-artery stenosis. N Engl J Med 344: 431–442, 2001 [DOI] [PubMed] [Google Scholar]
- 48. Sato M, Muragaki Y, Saika S, Roberts AB, Ooshima A. Targeted disruption of TGF-beta1/Smad3 signaling protects against renal tubulointerstitial fibrosis induced by unilateral ureteral obstruction. J Clin Invest 112: 1486–1494, 2003 [DOI] [PMC free article] [PubMed] [Google Scholar]
- 49. Scaglione R, Argano C, Parrinello G, Colomba D, Di Chiara T, Ferrante A, Di Garbo V, Avellone G, Licata G. Relationship between transforming growth factor beta1 and progression of hypertensive renal disease. J Hum Hypertens 16: 641–645, 2002 [DOI] [PubMed] [Google Scholar]
- 50. Suthanthiran M, Li B, Song JO, Ding R, Sharma VK, Schwartz JE, August P. Transforming growth factor-beta 1 hyperexpression in African-American hypertensives: a novel mediator of hypertension and/or target organ damage. Proc Natl Acad Sci USA 97: 3479–3484, 2000 [DOI] [PMC free article] [PubMed] [Google Scholar]
- 51. Textor SC. Ischemic nephropathy: where are we now? J Am Soc Nephrol 15: 1974–1982, 2004 [DOI] [PubMed] [Google Scholar]
- 52. Textor SC. Managing renal arterial disease and hypertension. Curr Opin Cardiol 18: 260–267, 2003 [DOI] [PubMed] [Google Scholar]
- 53. Textor SC. Pathophysiology of renal failure in renovascular disease. Am J Kidney Dis 24: 642–651, 1994 [DOI] [PubMed] [Google Scholar]
- 54. Textor SC, Wilcox CS. Renal artery stenosis: a common, treatable cause of renal failure? Annu Rev Med 52: 421–442, 2001 [DOI] [PubMed] [Google Scholar]
- 55. Weber-Mzell D, Kotanko P, Schumacher M, Klein W, Skrabal F. Coronary anatomy predicts presence or absence of renal artery stenosis. A prospective study in patients undergoing cardiac catheterization for suspected coronary artery disease. Eur Heart J 23: 1684–1691, 2002 [DOI] [PubMed] [Google Scholar]
- 56. Wheatley K, Ives N, Gray R, Kalra PA, Moss JG, Baigent C, Carr S, Chalmers N, Eadington D, Hamilton G, Lipkin G, Nicholson A, Scoble J. Revascularization versus medical therapy for renal-artery stenosis. N Engl J Med 361: 1953–1962, 2009 [DOI] [PubMed] [Google Scholar]
- 57. Wiesel P, Mazzolai L, Nussberger J, Pedrazzini T. Two-kidney, one clip and one-kidney, one clip hypertension in mice. Hypertension 29: 1025–1030, 1997 [DOI] [PubMed] [Google Scholar]
- 58. Wright JR, Duggal A, Thomas R, Reeve R, Roberts IS, Kalra PA. Clinicopathological correlation in biopsy-proven atherosclerotic nephropathy: implications for renal functional outcome in atherosclerotic renovascular disease. Nephrol Dial Transplant 16: 765–770, 2001 [DOI] [PubMed] [Google Scholar]
- 59. Yang F, Chung AC, Huang XR, Lan HY. Angiotensin II induces connective tissue growth factor and collagen I expression via transforming growth factor-beta-dependent and -independent Smad pathways: the role of Smad3. Hypertension 54: 877–884, 2009 [DOI] [PubMed] [Google Scholar]
- 60. Yang YC, Piek E, Zavadil J, Liang D, Xie D, Heyer J, Pavlidis P, Kucherlapati R, Roberts AB, Bottinger EP. Hierarchical model of gene regulation by transforming growth factor beta. Proc Natl Acad Sci USA 100: 10269–10274, 2003 [DOI] [PMC free article] [PubMed] [Google Scholar]
- 61. Zacchigna L, Vecchione C, Notte A, Cordenonsi M, Dupont S, Maretto S, Cifelli G, Ferrari A, Maffei A, Fabbro C, Braghetta P, Marino G, Selvetella G, Aretini A, Colonnese C, Bettarini U, Russo G, Soligo S, Adorno M, Bonaldo P, Volpin D, Piccolo S, Lembo G, Bressan GM. Emilin1 links TGF-beta maturation to blood pressure homeostasis. Cell 124: 929–942, 2006 [DOI] [PubMed] [Google Scholar]
- 62. Zhu Y, Richardson JA, Parada LF, Graff JM. Smad3 mutant mice develop metastatic colorectal cancer. Cell 94: 703–714, 1998 [DOI] [PubMed] [Google Scholar]


