

Abstract
Renal artery stenosis (RAS) promotes microvascular rarefaction and fibrogenesis, which may eventuate in irreversible kidney injury. We have shown that percutaneous transluminal renal angioplasty (PTRA) or endothelial progenitor cells (EPC) improve renal cortical hemodynamics and function in the poststenotic kidney. The renal medulla is particularly sensitive to hypoxia, yet little is known about reversibility of medullary injury on restoration of renal blood flow. This study was designed to test the hypothesis that PTRA, with or without adjunct EPC delivery to the stenotic kidney, may improve medullary remodeling and tubular function. RAS was induced in 21 pigs using implantation of irritant coils, while another group served as normal controls (n = 7 each). Two RAS groups were then treated 6 wk later with PTRA or both PTRA and EPC. Four weeks later, medullary hemodynamics, microvascular architecture, and oxygen-dependent tubular function of the stenotic kidneys were examined using multidetector computed tomography, microcomputed tomography, and blood oxygenation level-dependent MRI, respectively. Medullary protein expression of vascular endothelial growth factor, endothelial nitric oxide synthase, hypoxia-inducible factor-1α, and NAD(P)H oxidase p47 were determined. All RAS groups showed decreased medullary vascular density and blood flow. However, in RAS+PTRA+EPC animals, EPC were engrafted in tubular structures, oxygen-dependent tubular function was normalized, and fibrosis attenuated, despite elevated expression of hypoxia-inducible factor-1α and sustained downregulation of vascular endothelial growth factor. In conclusion, EPC delivery, in addition to PTRA, restores medullary oxygen-dependent tubular function, despite impaired medullary blood and oxygen supply. These results support further development of cell-based therapy as an adjunct to revascularization of RAS.
Keywords: blood oxygenation level-dependent magnetic resonance imaging, percutaneous transluminal renal angioplasty
renovascular diseases are common causes of hypertension and loss of renal function (10, 24). Renal injury induced by renal artery stenosis (RAS) is associated with reduction in blood flow and, ultimately, loss of capillaries and microvessels (3, 13). Impaired blood supply may decrease parenchymal oxygen tension and eventually induce hypoxia in renal tissue, which promotes fibrogenesis (12, 18, 19). In turn, glomerulosclerosis and tubulointerstitial fibrosis aggravate microvascular damage and peritubular capillary loss (19).
Restoration of blood flow to the stenotic kidney by percutaneous transluminal renal angioplasty (PTRA) and stenting sometimes improves renal function and slows the progression of the injury (1, 25). Our laboratory has previously shown that PTRA can partially restore glomerular filtration rate (GFR), blood pressure, and microvascular density in the cortex, whereas renal blood flow (RBF) and cortical fibrosis were not changed (9). In clinical studies, most patients show little recovery of function or continue to lose GFR over time (20). This suggests that additional measures are required to restore microvascular integrity and function in the stenotic kidney undergoing PTRA.
Our laboratory has also previously shown that intrarenal delivery of endothelial progenitor cells (EPCs) can repair renal injury in RAS (4), as EPCs elicited increased blood flow and GFR, and reduced cortical fibrosis. Furthermore, EPCs alone did not restore medullary volume or decrease blood pressure levels and might, therefore, be useful as an adjunct to PTRA.
Most studies on reversibility of renal injury in RAS address the whole kidney. Importantly, the renal medulla can be regulated independently from the cortex and plays a central role in solute transport and concentration of urine. Due to its lower blood supply and high rates of oxygen consumption, the medulla is particularly susceptible to hypoxia and changes in renal oxygen tension (2). However, the ability of vascular interventions to restore medullary function and structure remains unclear. Therefore, this study was designed to test the hypothesis that PTRA, with or without EPC, would improve medullary structure and function in swine RAS.
MATERIALS AND METHODS
All animal procedures followed the Guide for the Care and Use of Laboratory Animals (National Research Council, National Academy Press, Washington, DC, 1996) and were approved by the Institutional Animal Care and Use Committee. Twenty-one female domestic pigs (47.6 ± 1.3 kg) were studied for 10 wk after unilateral RAS induced by placing an irritant coil in main renal artery (15). To continuously monitor and record mean arterial pressure, a PhysioTel telemetry device (Data Science International, Ardden Hills, MN) was also implanted in the femoral artery on that day.
Six weeks later, RAS animals were randomized in three groups (n = 7 each), and the degree of stenosis determined using renal angiography. One group (RAS) underwent a sham procedure, another group (RAS+PTRA) underwent PTRA and stenting, and the third group (RAS+PTRA+EPC) also received intrarenal EPC after PTRA. For stenting, under fluoroscopic guidance, a balloon carrying a mounted stent was directed proximal to the stenotic region and then inflated. Balloon expansion dilated the stenosis and implanted the stent into the wall of the renal artery, and the balloon was then deflated and removed. RAS+PTRA+EPC also received an intrarenal infusion of EPCs (106 cells/ml suspended in 10 ml of saline) over 5 min after PTRA. A fourth group of pigs underwent only sham procedures (angiography, saline infusion) and served as normal controls (n = 7).
Four weeks after treatment or sham, animals underwent blood oxygenation level-dependent (BOLD) magnetic resonance imaging (MRI). The BOLD response, ΔR2*, was used as a measure of oxygen-dependent tubular function (8, 27). Before each in vivo study, animals were anesthetized (Telazol 5 mg/kg and xylazine 2 mg/kg in saline), and anesthesia maintained with intravenous ketamine (0.2 mg·kg−1·min−1) and xylazine (0.03 mg·kg−1·min−1) [for computed tomography (CT)], or inhaled 1–2% isoflurane (for MRI) throughout the course of imaging. BOLD images were collected before and 15 min after furosemide (0.5 mg/kg) injection through an ear vein catheter, to inhibit Na/K/Cl reabsorption in the thick ascending limb of Henle's Loop.
Renal function was evaluated 3–4 days later in anesthetized pigs using contrast-aided multidetector computed tomography (MDCT), to calculate cortical and medullary volumes, regional renal perfusion, GFR, and RBF (7, 14).
Pigs were eventually euthanized with a lethal intravenous dose of pentobarbital sodium (100 mg/kg) several days after completion of in vivo studies, to allow recovery and contrast agent washout. Then the kidneys were removed and immersed in saline solution containing heparin. A lobe of tissue was perfused and prepared for micro-CT, and the other lobe was shock-frozen in liquid nitrogen and stored at −80°C or preserved in formalin for histology (4).
EPC preparation.
Late and early outgrowth EPCs were collected as previously described (4, 5). Late cells were cultured from mononuclear cells collected 3 wk before the injection and early EPCs 1 wk before injection. Before delivery, cells were labeled with fluorescent beads and membrane dye (CM-DiI, 5 μl/ml). The final blend of a similar number of early and late cells (total 107) was delivered into the renal artery of the stenotic kidney.
BOLD imaging.
BOLD scans were performed on a 3T (GE Medical Systems, Milwaukee, WI) scanner using fast gradient echo with multiple echo times. Axial BOLD images were collected in oblique planes using 16 echoes. Imaging parameters were set to repetition time, echo time, flip angle, field of view, slice thickness, and matrix = 100 ms, 2.1–27 ms, 40°, 32 cm, 7 mm, and 256 × 256, respectively. All acquisitions were performed during suspended respiration.
MDCT imaging.
A pigtail catheter was advanced through the left jugular vein sheath and placed in the superior vena cava for contrast injections, and the pigs were then transferred to the MDCT gantry (Somatom Sensation 64; Siemens Medical Solutions, Forchheim, Germany). All tomographic levels containing both kidneys were determined with pilot scans, a bolus of iopamidol (0.5 ml/kg over 2 s) was injected, and 140 consecutive scans were acquired 3 s after the bolus injection. The first 70 scans were collected at the higher rate (1 scan/0.6 s) to sample rapid intravascular density changes, whereas the last 70 images were acquired at a lower rate (2-s intervals) to follow intratubular density changes (7, 14). Total scanning times were ∼3 min. Animals were in suspended respiration during the first 70 scans and ventilated during the last 70 scans.
In contrast-aided volumetric images, the initiation of acquisition was set to trigger near the peak of the aorta intensity signal, such that the duration of acquisition time encompasses the vascular phase (maximal intensity) of contrast through the cortex of both kidneys. Axial images were acquired at helical acquisition with thickness of 0.6 mm and resolution of 512 × 512, and reconstructed at 5-mm thickness. Blood pressure was monitored throughout the experiment.
Micro-CT for imaging microvascular architecture.
After euthanasia, a segmental renal artery perfusing a kidney lobe was cannulated ex vivo and infused with heparin-saline (10 U/ml) followed by radioopaque silicon polymer (Microfil, FlowTech, Carver, MA) at the rate of 0.8 ml/min. Then tissue was cut into small cubes and prepared for scanning, performed at 20-μm-voxel resolution (29).
All analyses were performed in Analyze (Biomedical Imaging Resource, Mayo Clinic, MN) and MATLAB (MathWork, Natick, MA).
BOLD analysis.
R2* values were estimated from medullary regions of interest defined based on their anatomical location and contrast from cortex in T2*-weighted magnetic resonance images by manually tracing the entire visible medullary areas. The logarithms of the decaying magnetic resonance signal were drawn against the corresponding echo times, and the curve then fitted to a linear model to estimate R2*. Estimated R2* values were averaged over the entire regions of interest to calculate mean medullary R2*. The difference between the pre- and postintervention mean R2* values was used to estimate the BOLD response to furosemide, ΔR2*.
MDCT analysis.
Cortical and medullary volumes were estimated after calculating and summing the areas of each compartment on tomographic images and multiplying them by the thickness in 5-mm-thick cross-sectional images. Perfusion was calculated by fitting the signal attenuation vs. time curve to an extended Γ-variate model (14). Blood flow in cortex and medulla was estimated by multiplying the perfusion by the corresponding volumes and were added to assess RBF. GFR was evaluated using the cortical curve and the slope of the proximal tubular curves.
Micro-CT analysis.
Micro-CT images were displayed as three-dimensional volume presentations of the medullary microvasculature. Using Analyze, cross-sectional slabs of medullary regions were selected below the level of the arcuate arteries that were observed in several planes. Mean diameter, tortuosity, as well as microvascular density (<40 μm, 40–100 μm and >100μm) were calculated, as described previously (4, 9).
EPC localization.
EPCs were localized by tracking (CM-DiI) labeled EPCs in frozen 5-μm-thick cross-sectional slices of the tissue, with 4,6-diamidino-2-phenylindole (nuclear stain) and cytokeratin (tubular marker) stains used to confirm location. EPCs were counted in both the cortex and medulla in low-power fields, and the engraftment relative to the number of injected cells was calculated.
Kidney tissue studies.
Standard Western blotting protocols were performed by pulverizing and homogenizing separately medullary and cortical tissue in chilled protein extraction buffer. The lysate was used for immunoblotting against swine-specific antibodies for vascular endothelial growth factor (VEGF), endothelial nitric oxide synthase (eNOS), hypoxia-inducible factor-1α (HIF-1α), NAD(P)H oxidase p47, and TNF-α (Santa Cruz, dilution 1:200) to investigate mechanisms involved in renal neovascularization and tubular oxygen consumption.
Renal fibrosis and inflammation were quantified in 5-μm trichrome and inducible NOS (iNOS)-stained slides, respectively. Because capillaries are below the resolution of our micro-CT technique, medullary capillary density was determined at ×1,000 magnification in H&E-stained slides using an ApoTome microscope (Carl ZEISS SMT, Oberkochen, Germany). Capillaries were identified by the presence of lumen, red blood cells, and/or an endothelial cell lining (26).
Statistical analysis.
Results are presented in mean ± SE format. Paired Student t-test was used for comparisons within groups, and ANOVA for comparison among groups, followed by an unpaired Student t-test with Bonferroni correction. For P values < 0.05, differences were considered significant.
RESULTS
An average of 16.3 ± 2.0% of the total injected EPCs were detected in the stenotic kidney. In each slice, ∼76.1% of the cells were located in the cortex and observed in the vascular and tubular structures, whereas, in the medulla, the remaining cells were observed in the interstitium or engrafted in tubules (Fig. 1A).
Fig. 1.

A: CM-DiI-labeled endothelial progenitor cells (EPC) engrafted in medullary tubular structure (red), shown with 4,6-diamidino-2-phenylindole (nuclear stain, blue) and cytokeratin (tubular marker, green) costains. B: change in medullary blood oxygenation index, R2*, in response to furosemide. BOLD, blood oxygenation level dependent; RAS, renal artery stenosis; PTRA, percutaneous transluminal renal angioplasty. Values are means ± SE. P < 0.05 vs. *sham, †RAS+PTRA+EPC, and #RAS+PTRA.
Hemodynamics.
The RAS, RAS+PTRA, and RAS+PTRA+EPC groups all developed significant and similar RAS by 6 wk after implantation of the irritant coil (76 ± 6, 73 ± 6, and 71 ± 3%, respectively). Subsequent PTRA in 14 pigs was technically successful (residual stenosis <10%) and induced reduction in mean arterial pressure (−11 ± 10 and −16 ± 4 mmHg in RAS+PTRA and RAS+PTRA+EPC, respectively), which remained unchanged in RAS (−2 ± 7 mmHg).
Four weeks after intervention or sham, cortical volume remained smaller in RAS and RAS+PTRA compared with normal, but was restored to normal size in RAS+PTRA+EPC (Table 1). Medullary volumes in RAS and RAS+PTRA+EPC tended to be lower (P = 0.09 and P = 0.06, respectively), and in RAS+PTRA were significantly smaller, than in the control group. RBF, cortical blood flow, and GFR were lower in RAS animals compared with the control. In RAS+PTRA, cortical blood flow and GFR were not different than normal shams. Furthermore, in RAS+PTRA+EPC, both were fully restored. Medullary blood flow in RAS, RAS+PTRA, and RAS+PTRA+EPC all tended to remain reduced (P = 0.06, P = 0.06, and P = 0.09 vs. normal, respectively).
Table 1.
Single kidney function and volume after 10 wk of renal artery stenosis, 4 wk after intervention, or sham
| Shame | RAS | RAS-PTRA | RAS-PTRA-EPC | |
|---|---|---|---|---|
| Blood pressure, mmHg | 91 ± 6 | 116 ± 9* | 105 ± 8 | 103 ± 6 |
| Volume, ml | ||||
| Medulla | 19.1 ± 1.9 | 15.0 ± 2.6 | 12.8 ± 2.6* | 15.6 ± 1.9 |
| Cortex | 113.9 ± 3.8 | 69.0 ± 8.1* | 98.3 ± 6.7*† | 109.4 ± 6.9† |
| Blood flow, ml/min | ||||
| Medulla | 71.7 ± 14.2 | 43.3 ± 11.4 | 45.1 ± 7.6 | 52.1 ± 10.4 |
| Cortex | 537.3 ± 24.1 | 303.9 ± 50.6* | 443.9 ± 33.7† | 527.1 ± 30.4† |
| Renal blood flow, ml/min | 609.0 ± 30.3 | 353.1 ± 59.3* | 489.0 ± 35.1*† | 573.8 ± 38.2† |
| Glomerular filtration rate, ml/min | 83.6 ± 9.1 | 52.4 ± 7.0* | 70.3 ± 6.2 | 77.2 ± 8.4 |
| Medullary R2*, s−1 | ||||
| Baseline | 22.2 ± 1.4 | 24.3 ± 1.0 | 22.0 ± 0.9 | 24.2 ± 1.5 |
| Postfurosemide | 17.3 ± 1.2 | 23.9 ± 1.3* | 19.4 ± 0.4† | 19.3 ± 1.6† |
| Urinary protein, μg/ml | 17.8 ± 3.1 | 25.1 ± 8.6 | 16.5 ± 4.7 | 28.6 ± 5.5 |
Values are means ± SE. RAS, renal artery stenosis PTRA, percutaneous transluminal renal angioplasty, EPC, endothelial progenitor cells; R2*, blood oxygenation index.
P < 0.05 vs. sham.
P < 0.05 vs. RAS.
Medullary tubular oxygen-dependent function.
Basal medullary R2* values were slightly (but not significantly) elevated in RAS and RAS+PTRA+EPC compared with shams (Table 1). The change in R2* after furosemide primarily reflects the change in deoxyhemoglobin related to inhibition of active tubular chloride transport and is, therefore, considered a surrogate marker for this aspect of tubular function (27). After furosemide, medullary R2* declined in all groups, except for RAS. The degree of change in the BOLD index in response to furosemide, %ΔR2*, was attenuated in RAS and RAS+PTRA (P < 0.05 vs. normal), but was preserved in RAS+PTRA+EPC (Fig. 1B).
A weak but significant correlation was observed between GFR and medullary BOLD response (R2 = 0.2, P < 0.05) and between cortical blood flow and the medullary perfusion (R2 = 0.2, P < 0.05).
Microvasculature.
Significant loss of medullary microvessels with diameter smaller than 100 μm was observed in RAS, RAS+PTRA, and RAS+PTRA+EPC kidneys (Figs. 2, A and B). Histology revealed that the medullary capillary densities were significantly lower in all three groups compared with the shams (Fig. 2C).
Fig. 2.

A: microcomputed tomography images of renal microvessels in sham, RAS, RAS+PTRA, and RAS+PTRA+EPC. The vascular density was estimated in outer strip of medulla (highlighted) in all groups. Medullary densities of vessels with diameters smaller than 100 μm were decreased in all groups compared with sham (B), as was capillary density estimated from histology (C). Values are means ± SE. *P < 0.05 vs. sham.
Tissue studies.
Expression of VEGF in the cortex in RAS+PTRA+EPC restored close to the normal, but remained impaired in the other two RAS groups, whereas eNOS expression was significantly reduced in all RAS groups. The expression of NAD(P)H oxidase p47 tended to be higher than normal in RAS (P = 0.09) and RAS+PTRA (P = 0.07), but did not reach statistical significance levels due to variability (Fig. 3A).
Fig. 3.

Representative (two bands per group) immunoblots demonstrating protein expression of VEGF, endothelial nitric oxide synthase (eNOS), and P47 in the cortex (A) and VEGF, eNOS, hypoxia-inducible factor-1α (HIF-1α), P47, and TNF-α in medulla (B). Values are means ± SE. *P < 0.05 vs. sham.
In the medulla, VEGF in all three RAS groups was reduced compared with normal (P < 0.05, Fig. 3B), and the expression of eNOS was significantly elevated in RAS+PTRA and RAS+PTRA+EPC (P < 0.05), but not in untreated RAS. HIF-1α expression, as an index of hypoxia, significantly increased in RAS+PTRA+EPC, strongly tended to increase in RAS+PTRA (P = 0.06), but remained unchanged in RAS compared with the control group. The expression of NADPH was increased in all three RAS groups (P < 0.05 vs. normal). On the other hand, the expression of TNF-α in the medulla was significantly elevated in RAS and RAS+PTRA, but was reduced in RAS+PTRA+EPC (P = 0.09 vs. normal).
Medullary tubulointerstitial fibrosis (trichrome staining) was significantly greater than normal in all experimental groups, but was significantly blunted in RAS+PTRA+EPC compared with RAS and RAS+PTRA (Fig. 4). Furthermore, immunoreactivity of the inflammatory marker iNOS showed a similar pattern and was also significantly reduced compared with that of the other two RAS groups (Fig. 4).
Fig. 4.
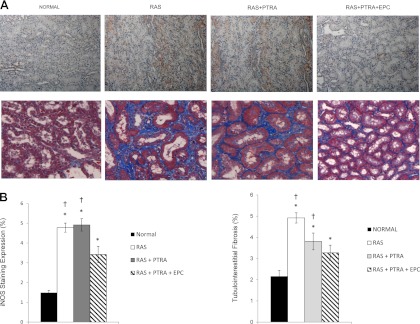
Medullary staining of inducible nitric oxide synthase iNOS (A; top) as an index of inflammation and trichrome (A; bottom) of tubulointerstitial fibrosis (×40), and the quantifications (B). Values are means ± SE. *P < 0.05 vs. sham. †P < 0.05 vs. RAS+PTRA+EPC.
DISCUSSION
This study shows that, in contrast to the cortex, PTRA, with or without adjunct EPC delivery, conferred no recovery of medullary hemodynamics and microvascular architecture. In this experimental study, restoration of main vessel blood flow by PTRA was associated with partial recovery of cortical volume and GFR. However, medullary capillary and microvascular density in treated swine remained below normal and similar to those in untreated RAS animals, and medullary blood flow tended to be reduced in all experimental groups. In contrast, changes in deoxyhemoglobin after furosemide, taken as a measure of oxygen consumption related to tubular solute transport, indicated greater recovery of tubular function in RAS+PTRA+EPC compared with RAS+PTRA alone. Furthermore, inflammation and tubulointerstitial fibrosis in EPC-treated kidney medullas were reduced, although they remained above that in sham animals, and markers of hypoxia (HIF-1α) and oxidative stress (p47) were unchanged compared with RAS+PTRA alone. This study, therefore, implies that the combination of PTRA and EPC confers selective improvement in medullary oxygen-dependent tubular function at the expense of lingering hypoxia, yet a complementary decrease in inflammation likely prevents enduring fibrosis.
A hemodynamically significant RAS leads to a decrease in RBF and, when severe, can decrease renal oxygen supply (11), which can trigger a vicious cycle of progressive kidney injury. In fact, chronic hypoxia in the tubulointerstitium has been proposed to represent a “common pathway” to end-stage renal failure (19, 22). Interstitial fibrosis resulting from hypoxia in turn aggravates peritubular capillary rarefaction and reduces oxygen delivery to the microcirculation, thereby perpetuating a chain of events of irreversible injury.
In this study, RAS animals developed hypertension and showed decreases in RBF and GFR. BOLD MRI showed a blunted reduction of R2* after furosemide in RAS, implying attenuated oxygen consumption related to tubular transport, and ex vivo studies revealed an increase in medullary tubulointerstitial fibrosis. Furthermore, micro-CT imaging revealed measurable loss of small medullary vessels, and histology confirmed regression of medullary capillaries.
Lack of sufficient blood supply to the medulla may result in impaired oxygen delivery and potentially hypoxia. Interestingly, despite impaired blood flow, vascular rarefaction, oxidative stress, and fibrosis, medullary HIF-1α expression and basal R2* (a measure of deoxyhemoglobin levels) remained unaltered in RAS, possibly due to a parallel decrease in oxygen-dependent tubular transport and thereby oxygen consumption. Our previous studies have shown that basal R2* in poststenotic human kidneys only increases during very severe ischemia (11). In fact, this disruption in tubular function might represent a primary protective mechanism to minimize hypoxia and preserve tubular cells, secondary to a decrease in filtrate input (GFR) or both.
Our study shows that PTRA alone partially restored medullary oxygenation response to furosemide in RAS, although it remained lower than that in the control group. Interestingly, this enhancement was achieved without change in tubulointerstitial fibrosis or capillary density. Since PTRA restored GFR, it is possible that an increase in tubular solute delivery accounted for the improved tubular transport function, which then became more responsive to furosemide. This postulation is supported by the modest but significant correlation between BOLD and GFR in the RAS groups. On the other hand, this increase in oxygen-dependent tubular transport and oxygen consumption might have, in turn, induced hypoxia, as reflected in the trend for medullary expression of HIF-1α to increase. The sustained increase in oxidative stress (represented by p47 expression) was also consistent with hypoxic conditions. The concurrent upregulation of eNOS expression may have aimed to compensate for the increased oxidative stress and diminished oxygen supply, or to facilitate nitric oxide-dependent tubular transport in the face of persistently impaired medullary blood flow (6).
Remarkably, in RAS+PTRA+EPC, the response to furosemide was fully restored to control values, yet, similar to the RAS+PTRA group, the avid tubular transport might have exacerbated hypoxia, as suggested by upregulation of medullary HIF-1α expression that has reached statistical significance. Speculatively, oxygen-related tubular function in this group might have been bolstered partially as a result of restored GFR and EPC engraftment into medullary tubular structures, as well as their autocrine and paracrine activities. For example, the anti-inflammatory effect of EPC (decreased TNF-α and iNOS expression) and, consequently, reduced fibrosis might have facilitated oxygen extraction by tubular cells. Similar to RAS+PTRA, in RAS+PTRA+EPC we observed upregulation of eNOS expression, possibly to increase the medullary blood flow and tubular function and offset oxidative stress and hypoxia. Contrarily, as opposed to the cortex after intrarenal EPC delivery (4), no significant improvement in medullary microvascular density or VEGF expression was observed in RAS+PTRA+EPC, perhaps because no EPC engrafted in medullary vessels, or the vessels were replaced by interstitial fibrosis. Reduced expression of VEGF, despite elevated expression of HIF-1α, may reflect an intrinsic protective anti-inflammatory mechanism that is activated even at the cost of hypoxia (16, 17, 21). Nevertheless, despite evidence of lingering hypoxia, medullary tubulointerstitial fibrosis was blunted in RAS+PTRA+EPC compared with RAS and RAS+PTRA. Possibly, EPC inhibited fibrosis directly or through their anti-inflammatory effect, thereby interrupting the vicious cycle of renal disease progression.
The weak correlation of cortical blood flow with medullary perfusion supports the notion that the influence of hemodynamic improvements in cortex on BOLD response is modest. The differential expression level of VEGF, eNOS, and NAD(P)H in the cortex compared with the medulla argue that those regions are regulated differently in RAS. Indeed, EPC seem to be less effective in improving medullary hemodynamics and vascular structure than those of the cortex.
Limitations.
Human RAS is a multifactorial disease, which is difficult to fully simulate in animal models. In addition, RAS in humans develops over longer periods of time than in our model, which might affect the interplay between RAS and other factors involved in progression of the disease. Nevertheless, the chain of events and the mechanism of tissue injury in our RAS model closely resemble those in humans (19, 23, 24). We used the arcuate arteries as the accepted anatomic boundary between the cortex and outer medulla in our micro-CT analysis, yet we cannot rule out the possibility that some cortex or inner medulla was inadvertently included. The reason for preferential engraftment of EPC in medullary tubules rather than blood vessels needs to be elucidated in future studies. Speculatively, strategies can be developed to increase their vascular engraftment, such as enrichment with VEGF receptors, or adjunct therapies to simultaneously increase vascular density and decrease remodeling. Finally, a renal protective effect of isoflurane in ischemia-reperfusion has been reported in the past (28). Although a short-term exposure to the anti-inflammatory properties of isoflurane anesthesia is more likely to affect acute rather than the chronic renal inflammation and injury observed in our model, its potential influence on renal hypoxia assessed by BOLD MRI cannot be completely ruled out and warrants further investigation.
In conclusion, PTRA improved GFR and solute delivery to the medulla, which might somewhat aggravate medullary hypoxia, in the absence of small-vessel neovascularization and an increase in medullary blood flow. Adjunct delivery of EPC further augmented RBF and tubular transport function, but, although this functional burden led to a slight further rise in medullary oxygen consumption and thereby hypoxia, this intervention decreased medullary fibrosis, possibly due to increased availability of nitric oxide or direct anti-fibrotic and anti-inflammatory effects of EPC. This study, therefore, supports further development of cell-based approaches as an adjunct therapy to preserve medullary outcomes in RAS after PTRA.
GRANTS
This study was partly supported by National Institutes of Health Grants DK73608, DK77013, HL77131, HL085307, and C06-RR018898.
DISCLOSURES
No conflicts of interest, financial or otherwise, are declared by the author(s).
AUTHOR CONTRIBUTIONS
B.E., X.Y.Z., S.C.T., and L.O.L. conception and design of research; B.E., Z.L., A.E., and X.Y.Z. performed experiments; B.E., Z.L., and A.E. analyzed data; B.E., A.E., X.Y.Z., S.C.T., and L.O.L. interpreted results of experiments; B.E., Z.L., and A.E. prepared figures; B.E. drafted manuscript; B.E., S.C.T., and L.O.L. edited and revised manuscript; B.E., Z.L., A.E., X.Y.Z., S.C.T., and L.O.L. approved final version of manuscript.
REFERENCES
- 1. Bonelli FS, McKusick MA, Textor SC, Kos PB, Stanson AW, Johnson CM, Sheedy PF, 2nd, Welch TJ, Schirger A. Renal artery angioplasty: technical results and clinical outcome in 320 patients. Mayo Clin Proc 70: 1041–1052, 1995 [DOI] [PubMed] [Google Scholar]
- 2. Brezis M, Rosen S. Hypoxia of the renal medulla–its implications for disease. N Engl J Med 332: 647–655, 1995 [DOI] [PubMed] [Google Scholar]
- 3. Chade AR. Renovascular disease, microcirculation, and the progression of renal injury: role of angiogenesis. Am J Physiol Regul Integr Comp Physiol 300: R783–R790, 2011 [DOI] [PMC free article] [PubMed] [Google Scholar]
- 4. Chade AR, Zhu X, Lavi R, Krier JD, Pislaru S, Simari RD, Napoli C, Lerman A, Lerman LO. Endothelial progenitor cells restore renal function in chronic experimental renovascular disease. Circulation 119: 547–557, 2009 [DOI] [PMC free article] [PubMed] [Google Scholar]
- 5. Chade AR, Zhu XY, Krier JD, Jordan KL, Textor SC, Grande JP, Lerman A, Lerman LO. Endothelial progenitor cells homing and renal repair in experimental renovascular disease. Stem Cells 28: 1039–1047, 2010 [DOI] [PMC free article] [PubMed] [Google Scholar]
- 6. Cowley AW., Jr Renal medullary oxidative stress, pressure-natriuresis, and hypertension. Hypertension 52: 777–786, 2008 [DOI] [PMC free article] [PubMed] [Google Scholar]
- 7. Daghini E, Primak AN, Chade AR, Krier JD, Zhu XY, Ritman EL, McCollough CH, Lerman LO. Assessment of renal hemodynamics and function in pigs with 64-section multidetector CT: comparison with electron-beam CT. Radiology 243: 405–412, 2007 [DOI] [PubMed] [Google Scholar]
- 8. Ebrahimi B, Gloviczki M, Woollard JR, Crane JA, Textor SC, Lerman LO. Compartmental analysis of renal BOLD MRI data: introduction and validation. Invest Radiol 47: 175–182, 2012 [DOI] [PMC free article] [PubMed] [Google Scholar]
- 9. Favreau F, Zhu XY, Krier JD, Lin J, Warner L, Textor SC, Lerman LO. Revascularization of swine renal artery stenosis improves renal function but not the changes in vascular structure. Kidney Int 78: 1110–1118, 2010 [DOI] [PMC free article] [PubMed] [Google Scholar]
- 10. Garovic VD, Textor SC. Renovascular hypertension and ischemic nephropathy. Circulation 112: 1362–1374, 2005 [DOI] [PubMed] [Google Scholar]
- 11. Gloviczki ML, Glockner JF, Crane JA, McKusick MA, Misra S, Grande JP, Lerman LO, Textor SC. Blood oxygen level-dependent magnetic resonance imaging identifies cortical hypoxia in severe renovascular disease. Hypertension 58: 1066–1072, 2011 [DOI] [PMC free article] [PubMed] [Google Scholar]
- 12. Heyman SN, Khamaisi M, Rosen S, Rosenberger C. Renal parenchymal hypoxia, hypoxia response and the progression of chronic kidney disease. Am J Nephrol 28: 998–1006, 2008 [DOI] [PubMed] [Google Scholar]
- 13. Iliescu R, Fernandez SR, Kelsen S, Maric C, Chade AR. Role of renal microcirculation in experimental renovascular disease. Nephrol Dial Transplant 25: 1079–1087, 2010 [DOI] [PMC free article] [PubMed] [Google Scholar]
- 14. Krier JD, Ritman EL, Bajzer Z, Romero JC, Lerman A, Lerman LO. Noninvasive measurement of concurrent single-kidney perfusion, glomerular filtration, and tubular function. Am J Physiol Renal Physiol 281: F630–F638, 2001 [DOI] [PubMed] [Google Scholar]
- 15. Lerman LO, Schwartz RS, Grande JP, Sheedy PF, Romero JC. Noninvasive evaluation of a novel swine model of renal artery stenosis. J Am Soc Nephrol 10: 1455–1465, 1999 [DOI] [PubMed] [Google Scholar]
- 16. Lindenmeyer MT, Kretzler M, Boucherot A, Berra S, Yasuda Y, Henger A, Eichinger F, Gaiser S, Schmid H, Rastaldi MP, Schrier RW, Schlondorff D, Cohen CD. Interstitial vascular rarefaction and reduced VEGF-A expression in human diabetic nephropathy. J Am Soc Nephrol 18: 1765–1776, 2007 [DOI] [PubMed] [Google Scholar]
- 17. Mayer G. Capillary rarefaction, hypoxia, VEGF and angiogenesis in chronic renal disease. Nephrol Dial Transplant 26: 1132–1137, 2011 [DOI] [PMC free article] [PubMed] [Google Scholar]
- 18. Mazzali M, Jefferson JA, Ni Z, Vaziri ND, Johnson RJ. Microvascular and tubulointerstitial injury associated with chronic hypoxia-induced hypertension. Kidney Int 63: 2088–2093, 2003 [DOI] [PubMed] [Google Scholar]
- 19. Nangaku M. Chronic hypoxia and tubulointerstitial injury: a final common pathway to end-stage renal failure. J Am Soc Nephrol 17: 17–25, 2006 [DOI] [PubMed] [Google Scholar]
- 20. Ramos F, Kotliar C, Alvarez D, Baglivo H, Rafaelle P, Londero H, Sanchez R, Wilcox CS. Renal function and outcome of PTRA and stenting for atherosclerotic renal artery stenosis. Kidney Int 63: 276–282, 2003 [DOI] [PubMed] [Google Scholar]
- 21. Rudnicki M, Perco P, Enrich J, Eder S, Heininger D, Bernthaler A, Wiesinger M, Sarkozi R, Noppert SJ, Schramek H, Mayer B, Oberbauer R, Mayer G. Hypoxia response and VEGF-A expression in human proximal tubular epithelial cells in stable and progressive renal disease. Lab Invest 89: 337–346, 2009 [DOI] [PubMed] [Google Scholar]
- 22. Tanaka T, Nangaku M. The role of hypoxia, increased oxygen consumption, and hypoxia-inducible factor-1 alpha in progression of chronic kidney disease. Curr Opin Nephrol Hypertens 19: 43–50, 2010 [DOI] [PubMed] [Google Scholar]
- 23. Textor SC. Ischemic nephropathy: where are we now? J Am Soc Nephrol 15: 1974–1982, 2004 [DOI] [PubMed] [Google Scholar]
- 24. Textor SC, Lerman L. Renovascular hypertension and ischemic nephropathy. Am J Hypertens 23: 1159–1169, 2010 [DOI] [PMC free article] [PubMed] [Google Scholar]
- 25. Textor SC, Lerman L, McKusick M. The uncertain value of renal artery interventions: where are we now? JACC Cardiovasc Interv 2: 175–182, 2009 [DOI] [PMC free article] [PubMed] [Google Scholar]
- 26. Ward WK, Quinn MJ, Wood MD, Tiekotter KL, Pidikiti S, Gallagher JA. Vascularizing the tissue surrounding a model biosensor: how localized is the effect of a subcutaneous infusion of vascular endothelial growth factor (VEGF)? Biosens Bioelectron 19: 155–163, 2003 [DOI] [PubMed] [Google Scholar]
- 27. Warner L, Glockner JF, Woollard J, Textor SC, Romero JC, Lerman LO. Determinations of renal cortical and medullary oxygenation using blood oxygen level-dependent magnetic resonance imaging and selective diuretics. Invest Radiol 46: 41–47, 2011 [DOI] [PMC free article] [PubMed] [Google Scholar]
- 28. Zhang L, Huang H, Cheng J, Liu J, Zhao H, Vizcaychipi MP, Ma D. Pre-treatment with isoflurane ameliorates renal ischemic-reperfusion injury in mice. Life Sci 88: 1102–1107, 2011 [DOI] [PubMed] [Google Scholar]
- 29. Zhu XY, Chade AR, Rodriguez-Porcel M, Bentley MD, Ritman EL, Lerman A, Lerman LO. Cortical microvascular remodeling in the stenotic kidney: role of increased oxidative stress. Arterioscler Thromb Vasc Biol 24: 1854–1859, 2004 [DOI] [PubMed] [Google Scholar]