

Abstract
Cellular uptake is being widely investigated in the context of diverse biological activities of metal compounds on the cellular level. However, the applied techniques differ considerably, and a validated methodology is not at hand. Therefore, we have varied numerous aspects of sample preparation of the human colon carcinoma cell line SW480 exposed in vitro to the tumor-inhibiting metal complexes cisplatin and indazolium trans-[tetrachlorobis(1H-indazole)ruthenate(iii)] (KP1019) prior to analysis with ICP-MS, and the results were found to be tremendously influenced by adsorption to the culture dishes. Adsorption to culture plates increases linearly with the concentration of KP1019, depends on the protein content of the medium, the duration of contact to protein-containing medium prior to drug addition and the hydrophilicity/lipophilicity of the compound. For varying degrees of cell confluence, adsorption of Ru hardly differs from cell-free experiments. Desorption from the plates contributes to total Ru detected in dependence on the cell harvesting method. Desorption kinetics for lysis in HNO3 and tetramethylammonium hydroxide (TMAH) are comparable, but TMAH is a more potent desorbant. Sample storage conditions prior to analysis influence significantly the recovery of analyte. Protocols using cell lysis in the culture plate without proper corrections run the risk of producing artefacts resulting from metal adsorption/desorption to an extent comparable with the actual cellular content. However, experimental protocols reported in the literature frequently do not contain information whether adsorption or blank correction were performed and should be regarded with caution, especially if lysis was performed directly in the culture dishes.
Introduction
Metal-based antitumor agents have set a standard in cancer chemotherapy and are applied in 50% of the therapy schemes, mostly in combination with other drugs.1,2 The limited spectrum of platinum-responsive tumors, serious side-effects and acquired resistance are the major problems associated with the use of platinum anticancer agents, as it is the case with all other clinically established antitumor agents. The different selectivity of platinum complexes for tumor and healthy tissues plays an important role for activity, but serious side effects show that an increase of selectivity for tumor tissue is desirable. DNA is being generally accepted as the critical target for this compound class.3 Therefore it is of central importance to target platinum and non-platinum compounds to the tumor tissue, which has led to the development of non-platinum metal complexes, some of which are currently undergoing clinical trials, i.e., the Ru(iii) complexes KP1019 and NAMI-A and the Ga(iii) compounds KP46 and gallium maltolate.4-8 However, only little is known about the mode of action of metal-based drugs. A variety of potential molecular targets have to be considered for Ru and Ga complexes. The tumor selectivity exhibited by Ru compounds, resulting in low side effects during treatment of clinical phase I trial patients, is thought to be at least partly due to activation by reduction in the cell.9-11 Also the role of plasma protein binding after intravenous infusion of Pt and Ru complexes is not quite clear: While the Ru complexes are thought to be transported by transferrin, there is some indication that Pt-protein binding contributes to the drugs’ side effects.12-14
Nearly all established and investigational metal-based anticancer drugs (possibly with the exception of NAMI-A)15 exert their therapeutic effects by interaction with intracellular targets. Therefore, one of the important preconditions for activity is a sufficient drug concentration in the cell. Net uptake is the result of cellular influx and efflux of the drug, to each of which different mechanisms may contribute. For example, cisplatin has long been thought to enter the cell either by passive diffusion through the cell membrane only or by a combination of passive diffusion and facilitated diffusion via gated channels,16 but more recent investigations have revealed a contribution of active import by the copper transporter CTR1.17 Export of cisplatin involves MRP2 and possibly MRP3, which are the only multidrug-resistance proteins associated with transport of cisplatin, probably in the form of glutathione conjugates,18 as well as the copper transporters ATP7B and possibly ATP7A.19 A lowered net uptake by either reduced influx or enhanced efflux is among the factors known to cause acquired resistance and hence is one of the determinants for therapeutic efficacy of cisplatin.20 Quantification of total platinum in drug-exposed cells has been involved in several studies on these mechanisms and is essential to assess their relative contributions to total net uptake.
In contrast to the established platinum drugs, little assured facts have been reported regarding the cellular uptake mechanisms of investigational metal-based anticancer drugs. Especially the non-platinum metal compounds among them differ substantially in their coordination chemistry, their molecular mode of action and, as far as known, their cellular uptake mechanisms which involve endocytosis of protein-bound species at least in some cases.2 In a straightforward approach to address this issue experimentally, the cellular drug content can be determined in dependence of inhibitors of the investigated uptake mechanism.
Further applications for cellular uptake experiments of established or investigational drugs include correlations between cytotoxicity and cellular drug content, investigations on the mechanisms of resistance which may involve decreased influx or increased efflux as compared to non-resistant cells, intracellular distribution of contrast agents (e.g. 99mTc, 67Ga), bioavailability studies or toxicological issues concerning both metal-based compounds and (radioactively) labelled organic compounds.
A dichotomy with methodological implications results from the divergent behavior of the tumor cells: The majority of cell lines originating from solid tumors adhere to the substrate through adhesion proteins, whereas cell lines derived from hematological malignancies usually grow in suspension without a tendency of attaching to surfaces. Non-adherent cells pose fewer problems for cellular uptake experiments, as they can be harvested without desorbing metals from the plastic material. Adherent cells, on the other hand, require additional steps in handling which are potential causes for artefacts. Although this can be circumvented by removal of the cells from substrate prior to drug addition and exposure of cells in suspension, e.g., in microcentrifuge tubes,21 one has to keep in mind, that in the latter case, cells are no longer in their accustomed growing conditions during drug uptake. Therefore, exposure in the adherent state is recommendable. Frequently used materials are culture flasks,22 multiwell plates,23-26 and petri dishes.27-29 Preincubation in culture medium prior to drug addition varies from 826 to 48 h25,28,29 or is adapted to fulfil the requirement of a certain degree of confluence.23 Exposure to the drug (typically varies from 1 to 48 h), and techniques for lysing cells differ strongly. Either they are detached from the substrate and lysed afterwards, or they are lysed directly in the adherent state. In the former case, cells are either removed by scraping27 or trypsinization,13,30 followed by washing, pelleting and lysis via sonification,30 treatment with nitric acid at ambient temperature31 or 120 °C,29 TMAH,13,24,32 or 1 M NaOH,28 whereas in the latter case, cultures are washed and incubated either with TMAH,33 HNO323 or detergents (Triton X-100, SDS),25 in order to get homogenous solutions of lysed cells. Subsequently, the metal concentrations are determined either by ICP-MS,23,29 ICP-OES,31 flameless AAS,13,24,27,30,31,34 scintigraphy,35,36 or flow cytometry,37 and cellular amounts are reported either as absolute values normalized to cell number or protein concentration or as relative changes compared to control cells.
Due to this broad variety of techniques for the same purpose and the short experimental descriptions in the literature, it is difficult to properly reproduce the technique and hence it is not astonishing that reported cellular platinum amounts in non-resistant cell lines incubated with cisplatin for not vastly different exposure times range from 220 nmol Pt/106 cells (cell line A2780, 50 μM cisplatin for 2 h)25 down to 0.5 nmol Pt/106 cells (cell line A431, 50 μM cisplatin for 1 h),27 which suggests that a critically validated protocol for cellular uptake experiments is not at hand so far. Furthermore, we are faced with unsatisfying day-to-day repeatabilities of cellular uptakes in our laboratory when applying previously published methods. This was the reason for developing and probing in detail a fast protocol based on ICP-MS quantification of cellular metal amounts in adherent cell lines. Several factors that influence the determination of the cellular amount are summarized in Fig. 1, and most of them are covered in this paper.
Fig. 1.

Ishikawa diagram of parameters influencing the determination of the cellular uptake of metal-based drugs in adherent tumor cells.
Experimental
Chemicals and materials
Eagle’s Minimum Essential Medium (MEM), Dulbecco’s phosphate-buffered saline (PBS), sodium pyruvate (100 mM), l-glutamine (200 mM) and trypsin-EDTA solution (0.25%) were obtained from Sigma (Vienna, Austria), fetal bovine serum (FCS) and non-essential amino acids (100x) from Gibco-Invitrogen (Lofer, Austria), and TMAH and nitric acid (p.a.) from Fluka (Buchs, Switzerland). Concentrated nitric acid was further purified in a quartz sub-boiling point distillation unit (Milestone-MLS, Leutkirch, Germany). All samples and dilutions were prepared with Milli-Q water (18.2 MΩ cm; Synergy 185, Milli-pore, Bedford, MA, USA). The multiwell cell culture plates (made from polystyrene) were purchased from Iwaki/Asahi Technoglass (Gyouda, Japan).
For determining the protein concentration, the Bradford test kit from Bio-Rad Laboratories (Vienna, Austria) was used and adapted for usage in 96-well plates. Human serum albumin (purity 96–99%) was purchased from Sigma. Optical densities at 595 nm were recorded on a microplate reader (Synergy HT, Biotek) 15 min after addition of Bradford solution.
Test compounds
KP1019, KP46, cisplatin, and KP1478 (see Table 3 for chemical structures) were synthesized following the procedures described elsewhere.38-42 In order to avoid premature hydrolysis, solutions of these compounds were freshly prepared for each analysis. KP1019, cisplatin, and KP1478 were sufficiently soluble in cell culture medium, whereas for KP46 a 10 mM stock solution in DMSO had to be prepared.
Table 3.
Comparison of adsorption of four metal complexes to the plates. Drug exposure was performed with a 50 μM solution for 2 h, followed by desorption with nitric acid (1–1.5 h)
| Substance | Structure | Adsorption (pmol well−1) |
|---|---|---|
| Cisplatin |
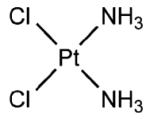
|
3.07 ± 0.08 |
| KP1478 |
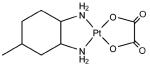
|
12.3 ± 0.6 |
| KP1019 |
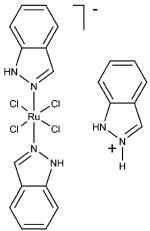
|
76.8 ± 3.2 |
| KP46 |
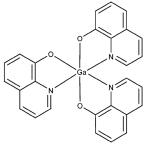
|
161.1 ± 9.7 |
The piston pipettes were regularly checked according to DIN 8655 and for experimental use, the pipette with the smallest possible nominal volume for pipetting in a single step was chosen.
Metal quantification by ICP-MS
Metal concentrations were determined by an ICP-MS instrument (Agilent 7500ce, Waldbronn, Germany), equipped with a CETAC ASX-520 autosampler (Neuss, Germany), a Scott double pass spray chamber, and a MicroMist nebulizer, at a sample uptake rate of approx. 0.25 ml min −1. 115In was used as the internal standard in a concentration of 0.5 ppb. Ruthenium, platinum, gallium and indium standards were obtained from CPI International (Amsterdam, The Netherlands). The standards (ranging from 0.05 to 5 ppb) were matrix matched with regard to internal standard, nitric acid and TMAH content. The instrument was tuned daily with an ICP-MS tuning solution (Agilent Technologies, Vienna, Austria) containing lithium, yttrium, cerium, thallium, and cobalt in 2% HNO3 (each 1 ng ml −1). The interference of 99Ru16O with 115In was minimized by tuning the ICP-MS to 140Ce16O/140Ce ratios of < 2% and did not disturb Ru measurements (background at m/z 115 was not increased within the range of Ru concentrations). Operational parameters and data on sensitivity are given in Table 1.
Table 1.
ICP-MS conditions and data on sensitivity for ruthenium
| Plasma gas flow rate | 15 l min−1 |
| Auxiliary gas flow rate | 0.9 l min−1 |
| Sampler cone | Ni (1.0 mm orifice) |
| Skimmer cone | Ni (0.4 mm orifice) |
| Plasma RF power | 1500 W |
| Isotopes registered | 69Ga, 102Ru, 115In, 195Pt |
| Carrier gas flow rate | 0.84–0.86 l min−1 |
| Make-up gas flow rate | 0.23–0.25 l min−1 |
| Background 102Ru | 200–800 cps |
| 102Ru | 50000–57000 cps ppb−1 |
All experiments were performed independently at least 3 times, and each experiment comprised 3 parallel samples. Results, if not otherwise stated, are given as mean ± standard deviation.
Cell line and culture conditions
SW480 cells (adenocarcinoma of the colon) from the American Type Culture Collection (ATCC) were kindly provided by Brigitte Marian, Institute of Cancer Research, Department of Medicine I, Medical University of Vienna, Austria. Cells were grown as adherent monolayer cultures in Minimal Essential Medium (MEM), supplemented with 10% heat-inactivated fetal bovine serum, 1 mM sodium pyruvate and 2 mM l-glutamine. Cultures were maintained at 37 °C in a humidified atmosphere containing 5% CO2 and 95% air. For uptake experiments, cells were seeded in complete culture medium (MEM supplemented with 10% heat-inactivated fetal bovine serum, 1 mM sodium pyruvate and 4 mM l-glutamine and 1% non-essential amino acids).
Determination of adsorption/desorption parameters
General procedure
All experiments were performed independently and repeated at least three times. Each experiment consisted of three replicates (three wells in a row of a 6-well plate), and comparative experiments were located on the same plate (e.g., protein-free vs. protein-containing medium). Wells were filled with 2.5 ml of culture medium and kept at 37 °C for 24 h prior to drug exposure. Consecutively, 0.278 ml of a freshly prepared 10x concentrated solution of test compound in complete culture medium (a 0.5 mM solution of KP1019, resulting in an effective concentration of 50 μM, was used if not otherwise stated) were added the following day and drug exposure lasted for 2 h at 37 °C in all experiments. Afterwards, the drug-containing medium was completely removed. Wells were washed twice with at least 3 ml PBS in order to assure that each drug-exposed well was cleaned appropriately. If not otherwise stated, desorption or cell lysis were accomplished by addition of 0.5 ml of sub-boiled HNO3 per well (1–1.5 h). Subsequently, an aliquot of 400 μl was transferred into a 15 ml polypropylene tube and filled to a total volume of 8 ml with Milli-Q water. Finally, 8 ml of a 0.5 ppm indium solution (final concentration 0.5 ppb) was added as internal standard for ICP-MS analysis which was performed on the same day. The total amount of the respective metal per well was calculated and averaged over the three replicates.
Influence of the protein concentration and determination of the adsorption capacity
Each well of a 6-well plate was filled with 2.5 ml of either protein-free MEM or complete culture medium (containing bovine serum proteins). After a 24 h preincubation period at 37 °C, 0.278 ml of a solution of KP1019 in complete culture medium or protein-free medium were added, yielding effective KP1019 concentrations of 1, 5, 10, 15 and 50 μM. Further work was performed as described above in detail.
Influence of preincubation on adsorption
Three wells of a 6-well plate were filled with 2.5 ml of complete culture medium or protein-free MEM and stored at 37 °C for 24 h. Just before drug application (50 μM KP1019 for 2 h), the remaining wells were filled with the respective medium. Washing, desorption, internal standardization and ICP-MS were done as described in the section General procedure.
Influence of the 6-well plate batch on adsorption
Three plates of two different batches of 6-well plates were preincubated with complete culture medium (24 h). Exposure to KP1019 (50 μM for 2 h), washing, desorbing and quantification of the Ru content by ICP-MS were done according to the general procedure.
Influence of the cell number on adsorption
Separate 6-well plates were seeded with 1 × 10⁵, 3 × 10⁵ or 6 × 10⁵ SW480 cells per well or filled cell-free medium. Preincubation, drug exposure (50 μM for 2 h), and washing were performed as described in the section General procedure. One row per plate was treated with 0.5 ml trypsin-EDTA solution, while the cells in the other row were scraped off (in the presence of 0.5 ml PBS). The cell-free plate was treated in the same way. Afterwards the solvents were sucked off, the wells were washed with PBS in order to remove the cells quantitatively, and plates were eyed up under the microscope for remaining cell clusters. For desorption, transfer into tubes and ICP-MS protocols see the section General procedure.
Adsorption of other metal complexes
Additionally to the ruthenium complex KP1019, the adsorption of the gallium complex KP46, cisplatin and the oxaliplatin analogue KP1478 was investigated at an effective concentration of 50 μM. The same experimental protocol as for KP1019 was applied.
Tetramethylammonium hydroxide and nitric acid as desorbants
6-Well plates were filled with 2.5 ml complete culture medium per well. After preincubation, drug exposure and washing (for full experimental details see the section General procedure), the wells were either treated with 0.5 ml TMAH or with 0.5 ml sub-boiled nitric acid for 5, 30, 60 or 120 min at room temperature. Afterwards, solutions were quantitatively transferred into 15 ml tubes and prepared for ICP-MS measurement. Samples containing TMAH were acidified by addition of 0.5 ml sub-boiled nitric acid.
In a further experiment, wells were incubated with 50 μM KP1019 and treated with nitric acid for 1 h. Subsequently, one plate was further incubated for 1 h with TMAH, while the other one was incubated with nitric acid for another hour. Ruthenium desorbed after 1 and 2 h was quantified by ICP-MS.
Desorption by trypsinization and scraping
6-Well plates were exposed to 50 μM KP1019 in complete culture medium and washed with PBS. Afterwards, the wells were either incubated with 0.5 ml trypsin-EDTA solution for 5 min at 37 °C or intensively scraped in 0.5 ml PBS per well for 2–3 min. Subsequently, trypsin-EDTA solution or PBS supernatant were removed, respectively, followed by a washing step with PBS (0.5 ml). Further preparations were done following the general protocol. The amount of Ru desorbed during treatment was calculated by comparison of treated wells (trypsinized or scraped off) with untreated wells to which acid was added directly after washing with PBS.
Cellular uptake
General procedure
General procedures for cellular uptake experiments were carried out analogous to adsorption/desorption experiments with slight modifications: Cells were seeded in densities of 3 × 10⁵ cells per well (if not otherwise stated) in a total volume of 2.5 ml complete culture medium. The uptake experiment and the corresponding adsorption/desorption experiment were located on the same plate. A separate plate (three wells per cell line) was prepared for the later determination of the cell number present during drug exposure. Plates were kept at 37 °C for 24 h prior to drug exposure to ensure that the cells were adherent during the uptake experiment.
During exposure to the drug (see general protocol on study of adsorption/desorption), the cell number and the protein concentration were determined in three wells after removal of the culture medium, washing the cells twice with 3 ml PBS and trypsinizing them with 0.5 ml trypsin-EDTA per well. The cell number in an aliquot of the resulting suspension was determined in a hemocytometer, and the absolute cell number per well was calculated. For protein determination, the remaining suspensions were transferred into Eppendorf tubes as soon as possible. To ensure completeness, wells were rinsed with approx. 0.5 ml of PBS, which was added to the cell suspension. Cells were pelleted (270 g, 3 min), the supernatant solution was sucked off carefully, cells were resuspended in 0.5 ml PBS, cooled on crushed ice, and ultrasonically lysed (two times 20 s, cooling on ice in between). The protein concentration of aliquots (25 and 50 μl per sample) of each lysate was determined in a 96-well plate against HSA standards in PBS (ranging from 1–10 μg), applying the Bradford test kit by Biorad, and the total amount of proteins per well was calculated.
Further work (washing, desorption/lysing, ICP-MS measurement) was carried out in the same way as adsorption/desorption was studied. For calculation of the cellular amount of metal, the corresponding adsorption blank was subtracted from the uptake sample, and the resulting cellular amount was referenced to mg protein and to a single cell and averaged over at least three independent experiments. The precisions of blank, uptake, and cell number or protein concentration were taken into account for determining the precision of the resulting cellular amount of metal by error propagation calculation (most probable error, see recommended protocol for cellular uptakes in the Conclusions).
Cellular uptake of cisplatin and KP1019
The cellular uptake of equicytotoxic concentrations of KP1019 and cisplatin, corresponding to the IC50 in the colon carcinoma cell line SW480 upon 96 h exposure (50 μM and 3 μM for KP1019 and cisplatin, respectively), was determined as described above. (It was known from previous cytotoxicity studies that 2 h exposure to 50 μM KP1019 or 3 μM cisplatin does not affect viability of SW480 cells.43)
Limits of detection and quantification of KP1019 uptakes
For determination of the instrumental detection limit (IDL), five Ru standards ranging from 0.020 to 2.000 μg l−1 were prepared in a solution of 3.5% nitric acid containing 0.5 ng ml−1 In.
In order to estimate the minimal ruthenium concentration in the medium giving rise to a detectable intracellular ruthenium amount (LOD, limit of detection of the method) or an amount high enough for quantification (LOQ, limit of quantification of the method), six cellular uptake experiments with KP1019 concentrations ranging from 0 to 50 μM were carried out in triplicates, following the procedures described in the general procedure of the section Cellular uptake. Cellular Ru (fg cell−1) was plotted against the concentration of KP1019 during exposure (μM), and data analysis was performed with Dintest demo software package (version 2005 DE),44 based on DIN 32645. Mandel’s F test was used for testing linearity, and residues were tested for normal distribution (R/s test, 95%), the occurrence of a trend (Neumann test, 95%) and outliers (F test, 95%). Subsequently, LOD and LOQ were calculated with a probability of α error of 5%, and LOQ was determined with an uncertainty of 33%. IDL was calculated analogously from the standard curve.
Shewhart control chart
Eleven independent uptake experiments (SW480, 50 μM KP1019, 2 h) were carried out so far. The upper control limit (UCL) and lower control limit (LCL) of the Shewhart control charts (accuracy and precision) for the cellular uptake were computed according to ISO8258 and correspond to an α error of 0.01 (Table 2). However, these limits have to be considered as preliminary, as the required minimum number of independent replicates (20 uptake experiments) has not been reached yet.
Table 2.
Calculation of the control limits for monitoring the accuracy and precision of cellular uptake. corresponds to the average cellular ruthenium amount of eleven independent experiments, is the average standard deviation of parallel experiments.
| Accuracy control chart () | Precision control chart () |
|---|---|
| UCL = 2.568 | |
| LCL = 0 |
Influence on ICP-MS detection
Matrix effects (high ionic concentrations and organic carbon)
A mixture of 15 ml PBS, 2.5 ml nitric acid and 50 μl of a 0.5 μg ml−1 In solution (internal standard), and a separate mixture of 2.5 ml TMAH, 2.5 ml nitric acid and 50 μl of a 0.5 μg ml−1 In solution were diluted with water to a total volume of 50 ml. These stock solutions were used for preparing the Ru standards in a concentration range from 0.5 to 10.0 ng ml−1. These samples were analyzed against standards without PBS and TMAH, prepared identically otherwise.
Storage
Samples prepared from SW480 cells (1 × 10⁵, 3 × 10⁵, 5 × 10⁵ cells per well) exposed to 50 μM KP1019, cell-free samples, and standards were split immediately after ICP-MS measurement. One series was stored for 1 week at 4 °C, while the other remained at room temperature. The Ru concentrations were determined again and compared with the previous measurements, and the recovery was calculated in % of the first measurement.
Results
Adsorption
Adsorption of metal species to polystyrene 6-well plates, which are usually used in cellular uptake experiments, was investigated in complete culture medium and in protein-free medium. Adsorption to the plates showed a linear increase with increasing concentration of KP1019 up to 50 μM in both cases (R2 > 0.99). No saturation of adsorption was observed up to this concentration (Fig. 2).
Fig. 2.
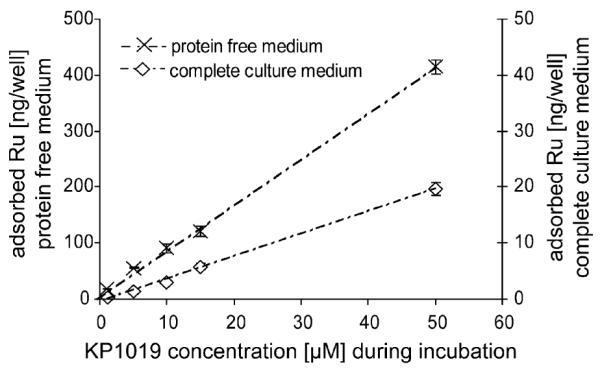
Influence of proteins on the amount of drug adsorbed to the plates. Total amount of adsorbed Ru in ng well −1 during a 2 h exposure with varying concentrations of KP1019 in either protein-free or protein-containing medium (complete culture medium).
In a next step, the effect of a 24 h preincubation prior to addition of KP1019 was studied. At an exposure concentration of 50 μM, the adsorbed amounts were determined to be 8.5 ± 1.1 and 413 ± 11 ng Ru well−1, if wells were preincubated with protein-containing or protein-free medium, respectively. However, no influence of preincubation on adsorption was found if protein-free medium was used (Fig. 3). Preincubation only affected adsorption in the case of complete culture medium: The adsorbed amount of Ru was reduced by a factor of 2.3 (8.5 ± 1.1 ng well −1 in case of complete culture medium vs. 19.7 ± 0.8 for protein-free medium). In a separate experiment, adsorption was found to vary significantly (ANOVA, p > 0.99), when plates from two different batches were preincubated with complete culture medium for 24 h, namely 6.1 ± 0.3 vs. 7.0 ± 0.4 ng Ru well −1.
Fig. 3.
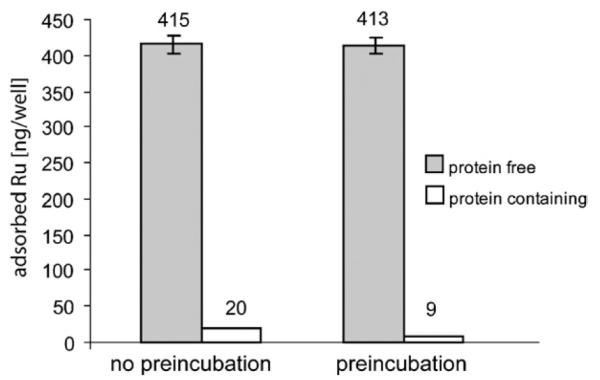
Influence of preincubation with protein-free or protein-containing medium on adsorption to the plates. Wells were either preincubated for 24 h prior to drug exposure with protein-free or protein-containing medium or immediately exposed to a 50 μM solution of KP1019 in the respective medium for 2 h.
Furthermore, the influence of DMSO addition was studied, because it is frequently used as a solvent for stock solutions of poorly water-soluble test compounds. The presence of 1% DMSO during drug exposure did not reduce adsorption of KP1019 (8.0 ± 0.2 vs. 8.2 ± 0.2 ng Ru well −1 in the absence and in the presence of 1% DMSO, respectively).
An influence of different degrees of cell confluence (10–20% in case of 1 × 10⁵, 50–60% in case of 3 × 10⁵ and complete confluence in case of 6 × 10⁵ seeded cells well −1) on adsorption could not be observed, if trypsin was used for cell removal (Fig. 4). Scraping off instead of trypsinization resulted in an apparent increase of adsorbed Ru with increasing cell number, but examination under the microscope revealed incomplete cell removal as the likely cause of this increase.
Fig. 4.
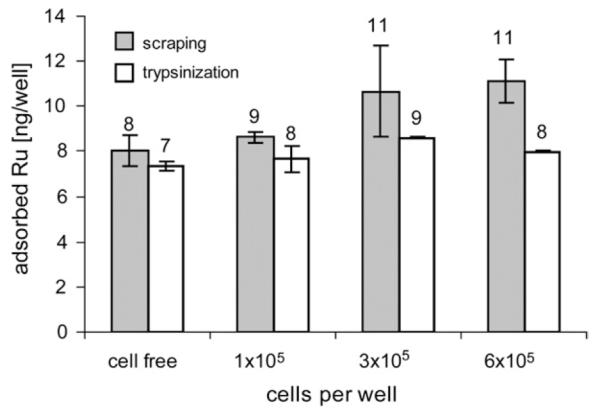
Influence of different degrees of cell confluence on adsorption of KP1019 to the plates. No cells, 1 × 10⁵, 3 × 10⁵ or 6 × 10⁵ cells were seeded and exposed to 50 μM of KP1019 for 2 h. Cells were scraped off or trypsinized after exposure, and wells were subsequently incubated with nitric acid in order to desorb ruthenium from the plates.
Adsorption was observed to be strongly dependent on the test compound. Equal concentrations (50 μM) and exposure conditions of the platinum complexes cisplatin and KP1478, the ruthenium complex KP1019, and the gallium complex KP46 resulted in adsorption of 3.07 ± 0.08, 12.3 ±0.6, 76.8 ± 3.2, and 161.1 ± 9.7 pmol well−1 of the respective metal (Table 3).
Desorption
The results from desorption studies of KP1019 by TMAH and HNO3 are summarized in Fig. 5. Desorption kinetics were comparable, but TMAH constantly desorbed approximately 30% more Ru than HNO3. As the desorbed amount of ruthenium was always higher if TMAH was used, wells initially exposed to nitric acid were subjected to a second treatment with TMAH, in order to verify the stronger desorbing properties of TMAH. It was found that TMAH was capable of desorbing further 3.4 ± 0.7 ng well−1 from a plate previously treated with nitric acid, whereas a second treatment with nitric acid only desorbed another 0.7 ± 0.1 ng well−1. The adsorption/desorption process is very reliable in parallel experiments, especially when nitric acid is used, with relative standard deviations (RSD) of <2% (Fig. 5, bottom). On the other hand, independent experiments lead to poor precision (approx. 20% RSD) as to the amount of Ru desorbed by TMAH or nitric acid (Fig. 5, top).
Fig. 5.

Desorption kinetics of ruthenium from KP1019-exposed wells. Upon exposure to KP1019 (50 μM, 2 h), wells were treated with TMAH or nitric acid up to 2 h. The means and standard deviations of three independent experiments (top) and three parallel samples (bottom) are shown.
Scraping and trypsinization desorbed approximately 1 ng Ru well−1, compared with 6.7 ng Ru well−1 for a 1 h nitric acid desorption. Desorbing properties of TMAH, HNO3, trypsin and scraping are summarized in Table 4.
Table 4.
Desorption of Ru from the plates by varying techniques after exposure to KP1019 (50 μM)
| Desorbent | Desorbed Ru/ng well−1 |
|---|---|
| Trypsin-EDTA (5 min) | 1.2 ± 0.4 |
| Scraping (3 min) | 0.9 ± 0.2 |
| HNO3 (1 h) | 6.7 ± 1.3 |
| TMAH (1 h) | 8.8 ± 1.7 |
Analysis of metal content by ICP-MS
TMAH and PBS-containing samples were measured against aqueous standards (3% nitric acid) with and without internal standard correction. The presence of TMAH in the standard solution caused only a slight loss in sensitivity (5%) if no internal standard correction was performed, and a 2% loss of sensitivity remained after internal standard correction, which may also be due to the fact that two independently prepared standard curves were compared. For PBS, sensitivity was reduced to 60% if no internal standard was used, but remained completely unchanged if internal standard was considered.
The influence of storing conditions (room temperature and 4 °C) on the recovery of Ru after one week of storage is shown for a varying number of lysed cells in Table 5.
Table 5.
Recovery of Ru in dependence of storing conditions and cell number. Varying numbers of KP1019-exposed cells were remeasured upon storing at 4 °C or room temperature [RT] for one week. Recovery is given in (%) of the immediate analysis
| Recovery (%) upon storing at |
||
|---|---|---|
| Number of cells | RT | 4 °C |
| 0 | 100 ±8 | 98 ± 1 |
| 1 × 10⁵ | 98 ±5 | 91 ± 1 |
| 3 × 10⁵ | 94 ±7 | 84 ± 2 |
| 5 × 10⁵ | 91 ±3 | 82 ± 4 |
Generally, cell-free samples (= adsorption blanks) could be stored with high recovery rates (nearly 100%), both at room temperature and at 4 °C. The more organic matrix (lysed cells) was present in the tubes, the more advantageous was storing at room temperature (e.g., in the case of 3 × 10⁵ cells, recovery was 94 ± 7%, whereas after one week of storing at 4 °C only 84 ± 2% could be recovered as compared to determination immediately after digestion with nitric acid). These findings are not unexpected, as acid-resistant bio-macromolecules are not digested and high concentrations thereof combined with low temperatures facilitate precipitation, which became visible in some cases.
Cellular uptake
Cellular uptake in the presence of equicytotoxic concentrations of KP1019 (50 μM) and cisplatin (3 μM) for 2 h results in average cellular metal contents of 31 ± 4 fg Ru cell−1 and 0.9 ± 0.3 fg Pt cell−1, respectively. These values correspond to 171 ± 7 ng Ru mg−1 protein and 5 ± 1 ng Pt mg−1 protein. The cell number, determined during exposure to the drug, varies around 3.9 ± 0.75 × 10⁵ cells per well in independent experiments, but is determined with a precision of 10% or better for a single experiment. The average protein concentration per cell, which is used as quality control for each cellular uptake experiment, amounts to 0.19 ± 0.02 ng cell −1 (Table 6)
Table 6.
Cellular amounts of Ru and Pt after exposure to equicytotoxic concentrations, determined with the developed protocol. Average cellular Ru (KP1019, 50 μM) and Pt (cisplatin, 3 μM during exposure) in SW480 cells expressed in fg cell−1 and ng mg−1 protein, determined in n independent experiments. The average cell number during drug exposure and the protein concentration per cell were determined and used as quality control parameters for uptake experiments
| Ru | Pt | |
|---|---|---|
| fg per cell | 31 ± 4 (n = 11) | 0.9 ± 0.3 (n = 7) |
| ng per mg protein | 171 ± 7 (n = 5) | 5 ± 1 (n = 5) |
| ng protein per cell | 0.19 ± 0.02 (n = 7) | |
| Average cell number | 3.9 ± 0.75 × 10⁵ (n = 11) |
Emphasis was laid on a reliable determination of the drug concentration required to obtain detectable and quantifiable cellular metal concentrations. Hence, cellular uptake experiments using seven different concentrations (up to 50 μM KP1019) were performed. For each concentration, the cellular amount (in ng well−1) was calculated via subtraction of the adsorbed/desorbed amount from the total amount (cell related + adsorbed/desorbed amount, Fig. 6, top) and division by the cell number. The resulting cellular ruthenium amount was plotted against the drug concentration in the medium during exposure (Fig. 6, bottom). Statistical analysis was applied on this graph (see the section Experimental for details), resulting in intracellular LOD and LOQ of 0.44 and 1.77 fg Ru per cell, respectively, which were achieved if 0.9 and 3.2 μM KP1019 were applied during exposure, respectively. The instrumental detection limit and instrumental quantification limit, based upon data analysis of a standard curve, were found to be 5.3 and 19.3 pg ml−1, respectively, and were lower than Ru concentrations in solutions from cellular uptake experiments with 1 μM KP1019.
Fig. 6.

Cellular uptake of KP1019 in a concentration range up to 50 μM. top: ( ) shows total Ru (adsorbed/desorbed to/from the plates + cellular), whereas (▲) is the corresponding adsorption/desorption blank. bottom: Subtraction of the absorbed/desorbed amount from the total amount and division by the cell number led to the displayed graph, which was used for determination of LOD and LOQ.
In order to prove the quality of the preferred protocol (involving exposure of 3 × 10⁵ cells per well to a solution of KP1019 of 50 μM over 2 h, lysis with nitric acid and quantification of the metal with ICP-MS in uptake and corresponding blank experiments) with regard to independent repeatability of the results, a Shewhart control chart monitoring the accuracy (Fig. 7, top) and the precision (Fig. 7, bottom) of the cellular uptake determinations of KP1019 (50 μM over 2 h), is currently being built up in our laboratory. All but the first uptake experiment that were performed with the final protocol are within the preliminary control limits (corresponding to an α error of 0.01, which is represented by the dashed bold lines), calculated from eleven independent experiments. However, final control limits need to be based on at least twenty experiments, and hence it is too early yet to state if the first data point is an outlier, but nevertheless the data recorded so far strongly suggests that the stability of the developed method is granted.
Fig. 7.

Shewhart control charts for cellular uptake determinations. The upper control limit (UCL) and lower control limit (LCL) were computed according to ISO 8258 from eleven independent uptake experiments (SW480 cells, 2 h exposed to 50 μM KP1019), in which accuracy (top) and precision (bottom) are controlled. corresponds to the average cellular ruthenium amount of independent experiments, is the average standard deviation of parallel experiments.
Discussion
A convenient and quick procedure was established for performing cellular uptake experiments of metal-based compounds with adherent cell lines and ICP-MS as detection method. With minor adjustments, e.g., number of seeded cells, preincubation time, it is applicable to any adherent cells of human or animal origin. Lysis of the cells is accomplished by nitric acid directly in the well in which they were exposed. Furthermore, the interference of the adsorption/desorption to/from the surface of the polystyrene plates on the cellular uptake was systematically investigated using the ruthenium antitumor drug candidate KP1019 (for structural formula see Table 3).
In conformity with previous publications,13,33 the strong base TMAH (25% aqueous solution) was initially used for cell lysis and investigations of its desorption capabilities. This technique, however, was found to have several drawbacks: the need of acidification, higher carbon loading into the ICP-MS (additional 0.7 percentage points carbon in the measured samples due to TMAH, which makes instrument clogging and signal drift more likely), and frequently occurring precipitation of cell lysates upon acidification due to the strong change in pH. Therefore, we found it not suitable to use TMAH as lysing agent in cellular uptake studies mainly due to precipitation and hence only investigated its desorbing properties and compared it with sub-boiled nitric acid, which is also suitable for lysing cells immediately in the well, where they were exposed. With regard to ICP-MS detection, lysis with nitric acid of sub-boiled quality is the method of choice, but causes large desorption of ruthenium from KP1019-exposed wells (contribution of 40% to the total amount of Ru, as mentioned above). TMAH, in contrast, exhibits slower desorption kinetics, but upon reaching a steady state even higher amounts of ruthenium are desorbed than by treatment with nitric acid. The latter finding is supported by the observation that TMAH is capable of desorbing considerable additional amounts of ruthenium from wells previously incubated with nitric acid. Although scraping off or trypsinization of the cells desorbs less ruthenium than treatment with either nitric acid or TMAH, these procedures are much more laborious, more expensive due to the need of more consumable items, run the risk of losing cells during the following centrifugation steps, and the cells still have to be digested in an ICP-MS-compatible matrix.
Adsorption was found to be strongly dependent on the protein content of the medium. When complete culture medium (containing bovine serum proteins) was used, adsorption was 20 times lower than in the case of protein-free medium (20 vs. 415 ng well−1, respectively), if wells were not preincubated prior to drug exposure with the respective medium. KP1019 binds strongly to plasma proteins (albumin, transferrin etc.),4 and this is the most likely reason for the much lower adsorption to the wells in the case of protein-containing medium. Preincubation with protein-containing medium for 24 h leads to a further reduction of the adsorbed amount of the applied drug to 9 ng well−1. As this benefit of preincubation is only observed in case of protein-containing medium, it is most likely due to coating of the wells with proteins. Therefore, preincubation with complete culture medium prior to seeding of the cells is recommendable, and the protein content of the medium should be kept as constant as possible in all experiments. However, adsorbed KP1019 still contributes to approx. 40% of total (cellular plus adsorbed) ruthenium, and hence carefully performed blank corrections are essential for each uptake experiment. This fact has to be considered not only in the case of metal-based drugs, but also for any other (hydrophobic) drug. Otherwise, the cellular amount is systematically overestimated, and, as a consequence, relative changes of cellular uptake are reversely underestimated (Fig. 8).
Fig. 8.
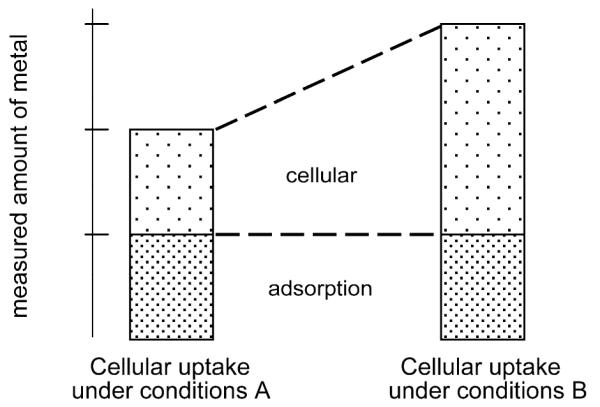
Schematic representation of a hypothetical comparative cellular uptake experiment. Without considering adsorption to the plastic material during incubation, the change in cellular uptake is dramatically underestimated (only 50% increase if adsorbed amount is not subtracted from the uptake experiment, whereas the cellular amount is actually doubled under conditions B).
As DMSO (in typical concentrations of 1%) is frequently used to enhance solubility of hydrophobic compounds in aqueous systems, we evaluated its effect on adsorption/desorption. The resulting slight reduction of adsorption was not significant. Although adsorption may dramatically falsify the determination of cellular uptake, the adsorbed amount has a negligible effect on the effective concentration of the test compound, as for the investigated compounds less than 0.1% of the applied drug adsorbs during the exposure period.
As adsorption effects are not avoidable, their dependence on the water solubility of the test compounds was investigated using metal complex concentrations of 50 μM. Cisplatin and the oxaliplatin analogue KP1478, which are the most water-soluble complexes in our series (approx. 3.3 mM for both compounds), show the least adsorption onto the polystyrene material, whereas KP1019 and KP46 are more lipophilic (solubility in aqueous solution of 0.5–0.8 mM and 40 μM, respectively) and exhibit higher adsorption. Similar effects might be relevant for organic drug molecules.
Adsorption takes place on the surface of the wells, but in cellular uptake experiments the surface is partly covered with a cell monolayer, which might reduce adsorption, resulting in further problems for appropriate blank subtractions. Therefore, this influence was investigated by seeding cells in varying densities, removing the cells by trypsinization or scraping, measuring the amounts of Ru desorbed by the subsequent treatment with nitric acid and comparing them with cell-free adsorption blanks. However, no influence of the degree of cell confluence (100% in case of 6 × 10⁵ seeded cells, 10–15% in case of 1 × 10⁵ cells) was found.
Moreover, the precision of the determination of adsorption/desorption was very high (2% RSD) in parallel experiments with nitric acid as lysing agent (Fig. 5, bottom), but poor (20% RSD) in independent experiments performed on different days (Fig. 5, top). Nevertheless, this does not hamper a precise determination of the cellular amount of the metal in independent experiments, because the strong variations in adsorption/desorption are compensated by proper blank subtraction. Apart from adsorption, the precise and accurate determination of the cell number is of equal importance, as the cellular amount per well is divided by the cell number. The latter was determined by counting the cells from three wells in a hemocytometer (at least three squares per sample), with a precision of ~10% RSD for the average cell number. This is ~5–10 times less precise than the ICP-MS analysis of the cellular amount of ruthenium per well and hence limits the precision of the cellular uptake determinations. Therefore, it was tested whether the cellular protein concentration, which was determined by the Bradford test upon ultrasonically lysing the cells, is a more reliable reference value. Hereby, the cellular uptake of KP1019 was measured with a precision of 4% RSD within the three investigated wells. Determining both the cell number and the protein concentration in each uptake experiment has the advantage that the resulting protein amount per cell can be used as a quality control parameter for accuracy (0.19 ± 0.02 ng cell−1 for SW480 cells).
In order to assure comparability between independently performed cellular uptake experiments, we suggest introducing Shewhart control charts for monitoring precision and accuracy of a laboratory-specific standard system. Fig. 7 shows our current charts (in our case: SW480 cells exposed to KP1019 in a concentration of 50 μM over 2 h), which have to be considered as preliminary, as they are only based on eleven independent experiments so far. However, they already give a good impression on how these charts are built up and used. As soon as twenty independent experiments have been performed, the final control limits can be calculated, and the control chart is ready to use: Additionally to any further uptake in SW480 cells, an uptake with the reference system has to be performed each time, and if the result is within the accepted range of the Shewhart control charts, the cellular uptake of the other compounds can be considered as reliable concerning correct determination of the cell number, and comparability with cellular uptake experiments performed on different days is ensured.
Unspecific adsorption to polystyrene, the main material used for cultivation of adherent cell lines, was observed to dramatically falsify the determination of cellular metal-based drug concentrations – no matter if the cells are scraped, trypsinized or lysed directly in the well before analysis of the metal content. This effect is of increasing relevance with increasing lipophilicity of the test compound and not only important in the case of (hydrophobic) metal-based drugs but also for organic compounds. Due to direct lysis in the well, the proposed method is less laborious than those based on harvesting by scraping or trypsinization, the resulting matrix is already perfectly suited for ICP-MS quantification, and the results become highly repeatable.
Conclusions
In the context of drug development, cellular uptake experiments are indispensable for studies and mechanisms of transport, mode of action and resistance. These studies may be taken as a basis for rational structure optimization and thus exert an influence on developmental strategies. Not considering adsorption gives too high values for cellular uptakes and consecutively results in false positives. A proper protocol for cell lysis in the culture plate including corrections of adsorption effects is required for excluding the risk of producing artefacts due to the effects described in this paper.
Accordingly, based on the experiments described above, the following optimized protocol is recommended for the determination of the cellular uptake of metal compounds into adherent cells of human or animal origin (Fig. 9):
Take one 6-well plate per cellular uptake experiment and use 3 wells for adsorption/desorption blank and the others for cellular uptake. Per cell line, 3 wells of a separate plate are used for determination of cell number and/or protein concentration.
Seed a defined number of cells (e.g., 3 × 10⁵ in the case of SW480) in a total volume of 2.5 ml well−1 and add 2.5 ml culture medium to each blank well.
Preincubate plates at 37 °C for 24–48 h, depending on the necessities of the cell line (e.g., 24 h in the case of SW480). The degree of confluence should be chosen such that cells still form an intact monolayer at the end of exposure (e.g., 60–80% in the case of SW480).
Add 0.278 ml of a 10 × stock solution of the test compound to each well, shake plate gently and expose cells/blanks as long as desired (e.g., 2–6 h in the case of SW480).
Determine the cell number/protein concentration in the meantime.
After exposure, wash wells twice with 3 ml PBS and take care to remove PBS as completely as possible.
Treat each well with exactly 0.5 ml of sub-boiled nitric acid for 1–1.5 h at room temperature.
Transfer an aliquot of 0.4 ml into a 15 ml tube, fill to a total volume of 8 ml with Milli-Q water, add appropriate internal standard and quantify immediately by ICP-MS (standards up to 5 ng ml−1 are usually sufficient).
- Calculate the average cellular amount (cc) of the respective metal in fg cell−1 and the corresponding standard deviation (scc) according to the following formulae:
1 2
cc is the average cellular amount (fg cell−1), ct the average measured metal concentration in the uptake samples (“total concentration”, ng ml−1) and cb is the average measured metal concentration of the adsorption-samples (“blank concentration”, ng ml−1); N is the average cell number (cells well −1); scc, sct, scb, and sN are the standard deviations of cc, ct, cb and N, respectively.
Fig. 9.

Ishikawa diagram of the final protocol for cellular uptake experiments of metal based drugs in adherent tumor cell lines.
As the procedure described here does not implicate a separation of metal bound to the cell membrane and metal incorporated into the cell, a reliable method to determine the intracellular amount in the strict sense rather than the total cell-bound amount remains desirable. This issue will be a central task within the ongoing development of a methodology for quantification of metals in subcellular compartments.
Acknowledgements
Support by the Austrian Science Fund (FWF), the Austrian Research Promotion Agency (FFG), the Austrian Council for Research and Technology Development and COST is gratefully acknowledged. The authors are indebted to Anna Eichinger, Susanna Slaby, Ladislav Habala and Peter Unfried for synthesis of the test compounds.
References
- 1.Galanski M, Arion VB, Jakupec MA, Keppler BK. Curr. Pharm. Des. 2003;9:2078–2089. doi: 10.2174/1381612033454180. [DOI] [PubMed] [Google Scholar]
- 2.Jakupec MA, Galanski M, Arion VB, Hartinger CG, Keppler BK. Dalton Trans. 2008:183–194. doi: 10.1039/b712656p. [DOI] [PubMed] [Google Scholar]
- 3.Jamieson ER, Lippard SJ. Chem. Rev. 1999;99:2467–2498. doi: 10.1021/cr980421n. [DOI] [PubMed] [Google Scholar]
- 4.Hartinger CG, Zorbas-Seifried S, Jakupec MA, Kynast B, Zorbas H, Keppler BK. J. Inorg. Biochem. 2006;100:891–904. doi: 10.1016/j.jinorgbio.2006.02.013. [DOI] [PubMed] [Google Scholar]
- 5.Rademaker-Lakhai JM, Van Den Bongard D, Pluim D, Beijnen JH, Schellens JHM. Clin. Cancer Res. 2004;10:3717–3727. doi: 10.1158/1078-0432.CCR-03-0746. [DOI] [PubMed] [Google Scholar]
- 6.Collery P, Jakupec MA, Kynast B, Keppler BK. Preclinical and early clinical development of the antitumor gallium complex KP46 (FFCC11) Éditions John Libbey Eurotext; Montrouge: 2006. pp. 521–524. [Google Scholar]
- 7.Lum BL, Srinivas S, Beck JT, Vesole D, LArgey M, Valone FH, Sayre PH. Proc. Am. Soc. Clin. Oncol. 2003;22:943. [Google Scholar]
- 8.Groessl M, Hartinger CG, Polec-Pawlak K, Jarosz M, Dyson PJ, Keppler BK. Chem. Biodivers. 2008;5(8):1609–1614. doi: 10.1002/cbdv.200890148. [DOI] [PubMed] [Google Scholar]
- 9.Jakupec MA, Reisner E, Eichinger A, Pongratz M, Arion VB, Galanski M, Hartinger CG, Keppler BK. J. Med. Chem. 2005;48:2831–2837. doi: 10.1021/jm0490742. [DOI] [PubMed] [Google Scholar]
- 10.Schluga P, Hartinger CG, Egger A, Reisner E, Galanski M, Jakupec MA, Keppler BK. Dalton Trans. 2006:1796–1802. doi: 10.1039/b511792e. [DOI] [PubMed] [Google Scholar]
- 11.Egger A, Schluga P, Hartinger CG, Arion VB, Keppler BK. In: Metal Ions in Biology and Medicine. Alpoim MC, Morais PV, Santos MA, Cristóvão AJ, Centeno JA, Collery P, editors. Vol. 9. Éditions John Libbey Eurotext; Montrouge: 2006. pp. 24–29. [Google Scholar]
- 12.Timerbaev AR, Hartinger CG, Aleksenko SS, Keppler BK. Chem. Rev. 2006;106:2224–2248. doi: 10.1021/cr040704h. [DOI] [PubMed] [Google Scholar]
- 13.Pongratz M, Schluga P, Jakupec MA, Arion VB, Hartinger CG, Allmaier G, Keppler BK. J. Anal. At. Spectrom. 2004;19:46–51. [Google Scholar]
- 14.Hartinger CG, Ang WH, Casini A, Messori L, Keppler BK, Dyson PJ. J. Anal. At. Spectrom. 2007;22:960–967. [Google Scholar]
- 15.Bergamo A, Sava G. Dalton Trans. 2007:1267–1272. doi: 10.1039/b617769g. [DOI] [PubMed] [Google Scholar]
- 16.Gately DP, Howell SB. Br. J. Cancer. 1993;67:1171–1176. doi: 10.1038/bjc.1993.221. [DOI] [PMC free article] [PubMed] [Google Scholar]
- 17.Ishida S, Lee J, Thiele DJ, Herskowitz I. Proc. Natl. Acad. Sci. USA. 2002;99:14298–14302. doi: 10.1073/pnas.162491399. [DOI] [PMC free article] [PubMed] [Google Scholar]
- 18.Borst P, Evers R, Kool M, Wijnholds J. J. Natl. Cancer Inst. 2000;92:1295–1302. doi: 10.1093/jnci/92.16.1295. [DOI] [PubMed] [Google Scholar]
- 19.Safaei R, Howell Stephen B. Crit. Rev. Oncol. Hematol. 2005;53:13–23. doi: 10.1016/j.critrevonc.2004.09.007. [DOI] [PubMed] [Google Scholar]
- 20.Rabik CA, Dolan ME. Cancer Treatment Rev. 2007;33:9–23. doi: 10.1016/j.ctrv.2006.09.006. [DOI] [PMC free article] [PubMed] [Google Scholar]
- 21.Zastre J, Anantha M, Ramsay E, Bally M. Cancer Chemother. Pharmacol. 2007;60:91–102. doi: 10.1007/s00280-006-0353-z. [DOI] [PubMed] [Google Scholar]
- 22.Johnson SW, Shen DW, Pastan I, Gottesman MM, Hamilton TC. Exp. Cell Res. 1996;226:133–139. doi: 10.1006/excr.1996.0211. [DOI] [PubMed] [Google Scholar]
- 23.Samimi G, Kishimoto S, Manorek G, Breaux JK, Howell SB. Cancer Chemother. Pharmacol. 2007;59:301–312. doi: 10.1007/s00280-006-0271-0. [DOI] [PubMed] [Google Scholar]
- 24.Scolaro C, Chaplin AB, Hartinger CG, Bergamo A, Cocchietto M, Keppler BK, Sava G, Dyson PJ. Dalton Trans. 2007:5065–5072. doi: 10.1039/b705449a. [DOI] [PubMed] [Google Scholar]
- 25.Van Rijt S, Van Zutphen S, Den Dulk H, Brouwer J, Reedijk J. Inorg. Chim. Acta. 2006;359:4125–4129. [Google Scholar]
- 26.Song I-S, Savaraj N, Siddik ZH, Liu P, Wei Y, Wu CJ, Kuo MT. Mol. Cancer Ther. 2004;3:1543–1549. [PubMed] [Google Scholar]
- 27.Martelli L, Di Mario F, Ragazzi E, Apostoli P, Leone R, Perego P, Fumagalli G. Biochem. Pharmacol. 2006;72:693–700. doi: 10.1016/j.bcp.2006.06.008. [DOI] [PubMed] [Google Scholar]
- 28.Beretta GL, Gatti L, Tinelli S, Corna E, Colangelo D, Zunino F, Perego P. Biochem. Pharmacol. 2004;68:283–291. doi: 10.1016/j.bcp.2004.03.022. [DOI] [PubMed] [Google Scholar]
- 29.Ghezzi A, Aceto M, Cassino C, Gabano E, Osella D. J. Inorg. Biochem. 2004;98:73–78. doi: 10.1016/j.jinorgbio.2003.08.014. [DOI] [PubMed] [Google Scholar]
- 30.Kirin SI, Ott I, Gust R, Mier W, Weyhermueller T, Metzler-Nolte N. Angew. Chem., Int. Ed. 2008;47:955–959. doi: 10.1002/anie.200703994. [DOI] [PubMed] [Google Scholar]
- 31.Previati M, Lanzoni I, Astolfi L, Fagioli F, Vecchiati G, Pagnoni A, Martini A, Capitani S. J. Cell. Biochem. 2007;101:1185–1197. doi: 10.1002/jcb.21239. [DOI] [PubMed] [Google Scholar]
- 32.Kapitza S, Pongratz M, Jakupec MA, Heffeter P, Berger W, Lackinger L, Keppler BK, Marian B. J. Cancer Res. Clin. Oncol. 2005;131:101–110. doi: 10.1007/s00432-004-0617-0. [DOI] [PubMed] [Google Scholar]
- 33.Heffeter P, Pongratz M, Steiner E, Chiba P, Jakupec MA, Elbling L, Marian B, Koerner W, Sevelda F, Micksche M, Keppler BK, Berger W. J. Pharmacol. Exp. Ther. 2005;312:281–289. doi: 10.1124/jpet.104.073395. [DOI] [PubMed] [Google Scholar]
- 34.Muscella A, Calabriso N, Fanizzi FP, De Pascali SA, Urso L, Ciccarese A, Migoni D, Marsigliante S. Br. J. Pharmacol. 2008;153:34–49. doi: 10.1038/sj.bjp.0707576. [DOI] [PMC free article] [PubMed] [Google Scholar]
- 35.Andriopoulos B, Hegeduesch S, Mangin J, Riedel H-D, Hebling U, Wang J, Pantopoulos K, Mueller S. J. Biol. Chem. 2007;282:20301–20308. doi: 10.1074/jbc.M702463200. [DOI] [PubMed] [Google Scholar]
- 36.Zhang Y-M, Liu N, Zhu Z-H, Rusckowski M, Hnatowich DJ. Eur. J. Nucl. Med. 2000;27:1700–1707. doi: 10.1007/s002590000343. [DOI] [PubMed] [Google Scholar]
- 37.Puckett CA, Barton JK. J. Am. Chem. Soc. 2007;129:46–47. doi: 10.1021/ja0677564. [DOI] [PMC free article] [PubMed] [Google Scholar]
- 38.Collery P, Domingo JL, Keppler BK. Anticancer Res. 1996;16:687–691. [PubMed] [Google Scholar]
- 39.Lipponer K-G, Vogel E, Keppler BK. Metal-Based Drugs. 1996;3:243–260. doi: 10.1155/MBD.1996.243. [DOI] [PMC free article] [PubMed] [Google Scholar]
- 40.Galanski M, Yasemi A, Slaby S, Jakupec MA, Arion VB, Rausch M, Nazarov AA, Keppler BK. Eur. J. Med. Chem. 2004;39:707–714. doi: 10.1016/j.ejmech.2004.04.003. [DOI] [PubMed] [Google Scholar]
- 41.Dhara SC. Indian J. Chem. 1970;8:192–193. [Google Scholar]
- 42.Habala L, Galanski M, Yasemi A, Nazarov AA, von Keyserlingk NG, Keppler BK. Eur. J. Med. Chem. 2005;40:1149–1155. doi: 10.1016/j.ejmech.2005.06.003. [DOI] [PubMed] [Google Scholar]
- 43.Jakupec MA. unpublished. [Google Scholar]
- 44. http://www.rzuser.uni-heidelberg.de/~df6/download/