Abstract
Motoneurons receive synaptic inputs from tens of thousands of connections that cause membrane potential to fluctuate continuously (synaptic noise), which introduces variability in discharge times of action potentials. We hypothesized that the influence of synaptic noise on force steadiness during voluntary contractions is limited to low muscle forces. The hypothesis was examined with an analytical description of transduction of motor unit spike trains into muscle force, a computational model of motor unit recruitment and rate coding, and experimental analysis of interspike interval variability during steady contractions with the abductor digiti minimi muscle. Simulations varied contraction force, level of synaptic noise, size of motor unit population, recruitment range, twitch contraction times, and level of motor unit short-term synchronization. Consistent with the analytical derivations, simulations and experimental data showed that force variability at target forces above a threshold was primarily due to low-frequency oscillations in neural drive, whereas the influence of synaptic noise was almost completely attenuated by two low-pass filters, one related to convolution of motoneuron spike trains with motor unit twitches (temporal summation) and the other attributable to summation of single motor unit forces (spatial summation). The threshold force above which synaptic noise ceased to influence force steadiness depended on recruitment range, size of motor unit population, and muscle contractile properties. This threshold was low (<10% of maximal force) for typical values of these parameters. Results indicate that motor unit recruitment and muscle properties of a typical muscle are tuned to limit the influence of synaptic noise on force steadiness to low forces and that the inability to produce a constant force during stronger contractions is mainly attributable to the common low-frequency oscillations in motoneuron discharge rates.
Keywords: motor control, neuromuscular modeling
the neural mechanisms underlying the generation of motor commands are inevitably influenced by noise (Faisal et al. 2008). A spinal motoneuron, for example, receives up to 60,000 synaptic connections (Ulfhake and Cullheim 1988) that can each elicit a brief excitatory (EPSP) or inhibitory (IPSP) postsynaptic potential to modulate the membrane potential of the motoneuron (Heckman and Enoka 2004) and thereby influence the variability in the timing of its action potentials (Berg et al. 2007). Experimentally observed coefficients of variation (CoVs) for motoneuron interspike intervals (ISIs) are usually in the range of 10–30% during voluntary muscle contractions (Clamann 1969; Matthews 1996), which reflects the random fluctuations in the membrane potential, henceforth termed synaptic noise. The variability in ISIs is also influenced by low-frequency oscillations in the common synaptic input to the motoneuron population (De Luca et al. 1982b).
The relative influence of synaptic noise and low-frequency oscillations on movement variability is uncertain. One approach to determining the role of each source of variability in movement has been to focus on the variability in the force exerted by a muscle during a steady contraction. The CoV for isometric force is usually <5%, except at low forces, as observed for intrinsic hand muscles (Barry et al. 2007; Burnett et al. 2000; Danion and Gallea 2004; Galganski et al. 1993; Laidlaw et al. 2000; Lee Hong and Newell 2008; Moritz et al. 2005; Sosnoff and Newell 2006; Sosnoff et al. 2006; Tracy et al. 2007), elbow flexors (Brown et al. 2010; Tracy et al. 2007), ankle flexors (Tracy 2007), and knee extensors (Christou et al. 2002; Tracy and Enoka 2002). Some studies have suggested that force variability is at least partly associated with the ISI of motor unit discharge times (Jones et al. 2002; Moritz et al. 2005), whereas others indicate a greater role for low-frequency oscillations in the trains of action potentials (Negro et al. 2009).
The aim of this study was to investigate the influence of motor unit recruitment strategies and muscle contractile properties on the transmission of synaptic noise into force variability. We hypothesized that the mechanisms underlying the transduction of neural input into muscle force reduce the influence of synaptic noise on motor output variability in such a way that common low-frequency oscillations in the motor unit spike trains rather than the presence of synaptic noise is the limiting factor for force steadiness at most contraction intensities. The study comprised theoretical derivations, a computational model that simulated the adjustments in the magnitude of the input to the motoneuron population in order to maintain a constant isometric force, and experimental observations related to the theoretical and simulation results. The outcomes provide a systematic assessment of the impact of synaptic noise on force steadiness.
METHODS
The approach was based on a theoretical derivation of the muscle force produced by the spike trains of an ensemble of motoneurons. The mathematical details of this derivation are reported in appendix a. The computational model simulated the force produced by a population of motoneurons that received a common drive signal. The theoretical analysis and the simulation results demonstrate that the synaptic noise normally present in the input received by a motoneuron pool is largely eliminated from the force signal because of temporal and spatial filtering. Experimental measurements on the abductor digiti minimi muscle were consistent with the simulation results.
Force Generation: Temporal and Spatial Filtering of Motoneuron Spike Trains
A mathematical description of the generation of force (r) is as follows:
| (1) |
where gk(t) is the kth train of motor unit twitch forces, xk(t) the twitch force of the kth motor unit, N the total number of active motor units, and φk,i the random variables describing the discharge times i of the kth motor unit spike train. Twitch force [xk(t)] had a longer impulse response for low-threshold motor units compared with high-threshold motor units. The random variables φk,i were expressed as
| (2) |
where θk,i are independent random variables with the same probability density function fθk,i(x) = q(x)∀k,∀i.
The power spectrum of the process r(t) can be obtained from the theory of linear time-invariant systems and is given by Tetzlaff et al. (2008):
| (3) |
where Gγk,k(f) and Gγk,l(f) are, respectively, the auto- and cross-spectra of the spike trains. Equation 3 simply describes the spectrum of the total force as the summation of the auto- and cross-spectra of the spike trains that are filtered by the transfer function of the single motor unit twitch forces. The mathematical derivations for spectra of the spike trains can be found in appendix a. Based on these derivations and assuming independence of the N spike trains, the auto-spectra can be written as
| (4) |
where Qk(f) is the Fourier transform of the probability density function fθk,i(x). Equation 4 defines the spectrum of the kth spike train as the sum of two contributions: a continuous spectrum and a line spectrum. A continuous spectrum has values for a certain interval of frequencies, whereas a line spectrum represents a signal with power concentrated at discrete frequencies (i.e., sum of sinusoids that are Delta functions in the frequency domain). In Eq. 4, the line spectrum has lines at multiples of the mean discharge rate that have an amplitude proportional to the square of the mean discharge rate but with the total bandwidth limited by the power spectrum of the probability density function for the ISI |Qk(f)|2. The frequency bandwidth is inversely proportional to the standard deviation of the random variables θk,i: A spike train with a low discharge variability has a line spectrum with greater bandwidth compared with one that has more variability. The continuous spectrum has a value of 0 for f = 0 and reaches the limit value of for frequencies greater than the bandwidth of |Qk(f)|2. The frequency bandwidth of this spectrum is proportional to the variability of the ISI. In the extreme case of a fully regular spike train, for example, |Qk(f)|2 is equal to 1 (the probability density function is indeed a Dirac delta) and, therefore, the continuous spectrum is 0 and only the line spectrum is present (Eq. 4). Moreover, the first term of Eq. 3 indicates that the spectra of the N spike trains are low-pass filtered by the transfer function of the corresponding motor unit twitch force. This low-pass filter is referred to as the temporal filter (TF) in force generation. Because of the relatively slow contraction times of muscle units, this filter attenuates most of the high-frequency oscillations in motoneuron spike trains. The influence of the filter depends on the twitch properties (its impulse response is the twitch), which means that slow motor units have twitches with smaller frequency bandwidth compared with faster motor units. The influence of the twitch filter depends on its efficiency in reducing the power at frequencies different from zero (DC). In the absence of ISI variability, the generated force will still be variable because of the periodicity of the spike train and this will be limited by the transfer function of the motor unit twitch.
The cross-spectra in Eq. 3 can be written as follows:
| (5) |
Equation 5 states that the contributions of individual cross-spectra to the total force spectrum (Eq. 3) occur at DC. The number of cross-spectra that contribute to power at DC increases with the number of spike trains. These cross-spectra do not influence other frequencies because they are assumed to be independent. The combination of Eqs. 3, 4, and 5 describes the second type of filtering experienced by the spike trains, which is the filtering due to the summation of several spike trains and is referred as spatial filtering (SF). For physiological values of the parameters in the equations, the effect of this filter is to increase the DC component of the force relatively more than the higher-frequency components because of the contributions of both the auto-spectrum and the cross-spectra for each spike train to the DC component. Consequently, force variability tends to decrease with an increase in the number of summed spike trains. In contrast to the TF that depends on muscle contractile properties only, the efficiency of the SF depends on the size of the motor unit population and recruitment properties of the activated motor units.
The combined influence of the TF and SF is to reduce high-frequency components (both line and continuous spectra) relative to the DC component in the generated force and thus to improve force steadiness. The CoV for force is indeed the ratio between force standard deviation (which is the square root of the area of the force spectrum outside DC) and the mean force value (which is the square of the value of the force spectrum at DC). Because of these filters, only the low-frequency components of the control signal are transmitted to the force signal. Moreover, slowly varying components in the control signal will be further enhanced if they are spread as common input to the entire motoneuron pool.
Numerical Model
The study was based on a recently developed model (Dideriksen et al. 2010) that represented the motor unit recruitment and rate coding characteristics (Fuglevand et al. 1993) of the first dorsal interosseus muscle (FDI; index finger abductor) (Barry et al. 2007; Herbert and Gandevia 1999; Moritz et al. 2005). The present version of the model introduced a PID (proportional, integral, derivative) control algorithm that estimated the common neural drive to the motor unit population required to achieve a target force. A previous study demonstrated that the temporal and spectral characteristics of the simulated force variability, as well as the characteristics of the motor unit discharge rate variability, closely resembled experimental observations (Dideriksen et al. 2010).
The model was implemented in MATLAB v. 7.11 (The MathWorks, Natick, MA), and simulations were performed with a sample rate of 1,000 Hz. The duration of all simulations was at least 10 s from the time the target force was reached.
Motor Unit Synchronization and Twitch Contraction Time
In addition to performing simulations with the same parameters as described by Dideriksen et al. (2010), we repeated simulations with high levels of motor unit synchronization and with variations of motor unit twitch contraction times. Motor unit short-term synchronization (henceforth termed synchronization), which is defined as an above-chance tendency for pairs of motor units to discharge action potentials at about the same time (Buchthal and Madsen 1950), is commonly found during voluntary contractions in humans (Semmler 2002) and is known to increase force variability (Halliday et al. 1999; Yao et al. 2000). As synchronization is the result of common synaptic input to motoneurons (Datta and Stephens 1990; Sears and Stagg 1976), it was implemented in the model by adding a common random input (white Gaussian zero-mean noise low-pass filtered at 100 Hz; Negro and Farina 2011) to the fluctuations in synaptic noise (added in Eq. 35 in Dideriksen et al. 2010). The ratio between the standard deviations of the common input and the total synaptic noise of each motoneuron was set to 0.67, which corresponded to an average common input strength (CIS; see Analysis of Simulation Data) for all motor unit pairs of ∼1 imp/s at a contraction level of 10% of the maximal voluntary contraction (MVC) force, which corresponded to the greatest levels commonly observed in upper extremity muscles of healthy individuals (Dartnall et al. 2008; Dideriksen et al. 2009; Semmler and Nordstrom 1999; Semmler et al. 2002).
Because the distribution of twitch contraction times varies across motor unit populations and depends on acute and chronic adaptations, such as muscle fatigue (Fuglevand et al. 1999), sympathetic activation (Roatta et al. 2008), high-intensity training (Andersen and Aagaard 2010), and aging (Narici et al. 1991), the simulations were performed with the contraction time of each motor unit multiplied by 0.5 (fast muscle) or 2 (slow muscle). Although these adjustments likely exaggerate the magnitude of the in vivo adaptations and were imposed homogeneously across the motor unit population, this approach provides an estimate of the influence of twitch contraction time on the results observed.
Simulations with varying synchronization levels or with varying motor unit contraction times were performed at target forces of 0.5%, 1%, 1.5%, 2%, 3%, 4%, 5%, 7%, 10%, 15%, and 20% MVC. The simulations were repeated 10 times for each target force to account for variability in the random parameters of the model.
Size and Recruitment Range of Motor Unit Populations
Simulations were also performed with motor unit populations of 100, 150, 200, 300, 400, and 500 by modifying the control algorithm as described in appendix b. Furthermore, the upper limit of motor unit recruitment was varied across these simulations by changing the relation that established the recruitment thresholds (Eq. 1 in Fuglevand et al. 1993). The upper limits of motor unit recruitment used in the simulations were 40%, 50%, 60%, and 70% MVC force, which corresponded to recruitment of 50% of the motor unit population at 4%, 5%, 7.5%, and 10% MVC force, respectively. Intrinsic hand muscles typically exhibit full recruitment at 50–60% MVC (Kukulka and Clamann 1981; Thomas et al. 1986), whereas the value is ∼90% for larger muscles, such as biceps brachii and soleus (Kukulka and Clamann 1981; Oya et al. 2009).
The standard deviation of the synaptic noise was modeled as proportional to the magnitude of the synaptic input (see Eq. 35, Dideriksen et al. 2010). A gain function was used to control the magnitude of synaptic noise, and the influence on force variability (CoV for force) was examined for each condition. Four values for gain were used (0.5, 1, 1.5, and 2), which resulted in discharge rate variability that spanned the physiological range (∼5% to 30%).
Simulations were performed with all combinations of these three parameters (size of motor unit population, recruitment range, and gain of synaptic noise) and were repeated 5 times each, yielding a total of 480 simulations for each target force. The simulated target forces ranged from 0.5% to 4% MVC with increments of 0.5% MVC force, from 4% to 12% MVC with increments of 1% MVC force, and from 12% to 60% MVC with increments of 2% MVC force.
Analysis of Simulation Data
The composite spike train (CST) and force signals for the simulations with varying levels of synchronization and twitch contraction times were high-pass filtered (0.5 Hz, 2nd order Butterworth filter). CST was defined as the sum of the individual spike trains of all active motor units and corresponded to the neural drive to the muscle. To investigate how variability in the neural drive was transmitted to force, the cross-correlation (peak value in the range ±500 ms of zero time lag) between the two signals was estimated for the CST low-pass filtered with various cutoff frequencies (3, 6, 9, 12, and 15 Hz, respectively; 2nd order Butterworth filter). Because force was obtained by convolving the CST with the sum of several twitch shapes, a perfect correlation between the two signals was not expected (Negro et al. 2009).
The level of synchronization and common drive were estimated for contractions that were simulated for 90 s at 10% MVC force. Synchronization was estimated by generating cross-histograms (±50 ms relative to the reference motor unit discharge; bin width 1 ms) of all combinations of motor unit pairs. Simulation duration was adjusted to achieve an average bin count of 4 or greater for most motor units (Semmler et al. 1997). The width of the synchronous peak in the cross-correlation histogram was identified by using the cumulative sum (Ellaway 1978), and synchronization was quantified by the CIS index (Nordstrom et al. 1992), which denotes the number of synchronous discharges in excess of chance per second. Similarly, the common drive index (De Luca et al. 1982b) was estimated for all combinations of motor unit pairs. The time-varying, detrended instantaneous discharge rate was smoothed with a 400-ms Hanning window (Semmler et al. 1997) and was divided into nonoverlapping intervals of 5-s duration. The maximal value of the cross-correlation in the range ±250 ms of zero time lag was estimated for all motor unit pairs in each time window.
Linear regression was applied to the pairs of simulated CoVs for ISI and force individually for the simulations conducted with the same number of motor units and recruitment range. The slope of the relation between the two CoVs was computed with linear regression, and the influence of CoV for ISI on CoV for force was considered negligible when this slope was smaller than 0.1 (unit: CoV force/CoV ISI).
Experimental Procedures
The experiments were performed on four healthy men (age 25 ± 2.5 yr, mean ± SD) in accordance with the Declaration of Helsinki, with a protocol that was approved by the local ethics committee (approval number N-20090019). All four men gave written informed consent before participating in the experiment.
EMG signal recordings.
Single motor unit action potentials were recorded with intramuscular EMG electrodes comprising Teflon-coated stainless steel wires (diameter 0.1 mm; A-M Systems, Carlsborg, WA) that were inserted with 25-gauge hypodermic needles. To maximize the number of motor units detected in each contraction, two pairs of wires were placed ∼1 cm apart in the transverse direction in the proximal portion of the abductor digiti minimi muscle. The needles were removed once the wires had been inserted. Each wire was cut to expose the cross section of the tip without insulation. The two bipolar intramuscular EMG signals were amplified (Counterpoint EMG; Dantec Medical, Skovlunde, Denmark), band-pass filtered (500 Hz to 5 kHz), and sampled at 10 kHz.
Procedure.
The subject was seated on an adjustable chair with the right arm extended in a force brace (Aalborg University) in front of the subject. The elbow angle was ∼120°. The fifth finger was fixed in the isometric device so that the abduction force exerted by the finger could be measured. The forearm and the other four digits were secured with Velcro straps. The force produced by the fifth finger was measured with two force transducers (Interface), one in the transverse plane (abduction force) and the other in the sagittal plane (flexion force). The force signal was sampled at 10 kHz and stored on a computer. Visual feedback of the abduction force was provided on an oscilloscope.
The subjects performed three MVCs with the test muscle, resting for 2 min between contractions. The maximal force achieved during each contraction was considered the reference MVC force. Five minutes after the MVCs, the subject performed two steady contractions for 10 s each at target forces of 2.5% and 10% MVC. The flexion force was monitored during each contraction, and trials were repeated when this force was not negligible.
EMG signal decomposition.
The action potentials of individual motor units were identified from the intramuscular EMG signals recorded from the two locations in the muscle by the use of a decomposition algorithm (McGill et al. 2005). An experienced operator manually edited each motor unit spike train, and any unusually long (>250 ms) or short (<20 ms) ISIs were inspected for potential discrimination errors (Negro et al. 2009).
Analysis of experimental data.
The first common component (FCC) of the smoothed motor unit discharge times was derived as an estimate of the common low-frequency oscillations in the discharge rates (Negro et al. 2009). The CoVs for ISI, force, and FCC were computed as the ratio (%) between the respective SD and mean values. The CoV was computed for all variables using intervals of 1-s duration, and the 10 values obtained from the steady 10-s contractions were analyzed with correlation analysis. The peak values from the cross-correlation functions between CoVs for ISI and force and between CoVs for FCC and force were computed for both target forces. The strength of these associations indicated the relative contribution of ISI variability and FCC variability to the force steadiness.
RESULTS
The first section of results presents a theoretical derivation to demonstrate the influence of TF and SF in a simplified condition when the only variability in the spike trains was that due to synaptic noise. The second section reports the results obtained with the computational model when a realistic low-frequency oscillation was added to the input received by the motoneurons. Such oscillations represent the active adjustments by the central nervous system (CNS) in controlling muscle force (PID controller in the numerical model). When appropriate, experimental results are provided in the second section as validation of the simulations.
Filtering of Synaptic Noise
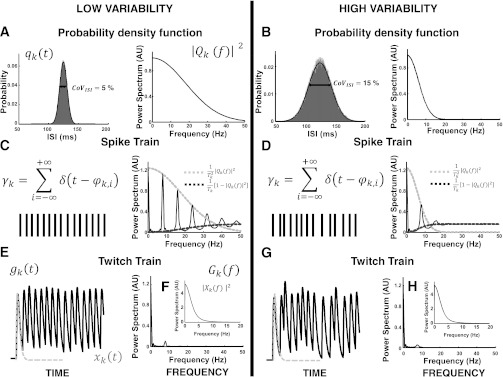
The analytical expression of the power spectrum for force (Eq. 3) predicts that force variability depends on the characteristics of the spike trains and the twitch forces of the motor units. Figure 1 shows how the timing variability in the spike trains influences force variability. The spike trains were generated with Gaussian-distributed ISIs with a given mean value; therefore, no control signal was applied in this theoretical example (see the model results below). Two motor unit spike trains were simulated with the same average discharge rate of 8 pps but with the CoV for ISI set at 5% for one trial and 15% for the second. The probability density functions for the random ISIs are shown in the time and frequency domains (spectrum) for the two trials (Fig. 1, A and B).
Fig. 1.
Representation of the power spectra (AU, arbitrary unit) of 2 simulated spike trains with coefficient of variation (CoV) for interspike interval (ISI) of 5% (low variability) and 15% (high variability). According to Eqs. 3 and 4, the probability density function of the ISI (A and B) influences the frequency support of the power spectrum of the generated spike train (C and D). The impulse response of the twitch force low-pass filters (F and H) the line spectra, reducing the variability in the force signal (E and G).
The frequency bandwidth of the spectrum for the probability density functions was inversely related to the standard deviation. In this example, the two spike trains had frequency bandwidths of ∼50 Hz and 20 Hz, respectively. Figure 1, C and D, show the spectra (Welch periodogram, rectangular windows of 1-s length) for the two spike trains. According to the second term in Eq. 4, the spectrum of a spike train is given by a line spectrum at frequencies that are multiples of the average discharge rate with an amplitude proportional to the spectrum of the probability density function of the ISI random variables (Fig. 1, C and D). Additionally, the continuous spectrum at high frequencies is given by the first term of Eq. 4 and is shown in Fig. 1, C and D. The differences in the frequency bandwidths of the two spectra are evident and directly related to the CoV for ISI of the two spike trains: More variable spike trains have a continuous spectrum with greater frequency bandwidth and greater attenuation of the line spectrum (Fig. 1, C and D). Figure 1, E and G, show the influence of TF on the fluctuations in force due to the twitch transfer function (Fig. 1, F and H). The convolution of the spike trains with the twitch impulse responses (rise time, T = 30 ms) low-pass filters the high-frequency components in the spectrum of the spike trains (compare the power spectra of the spike trains in Fig. 1, C and D, with those of the force in Fig. 1, E and G) and reduces the high-frequency content of the force variability in the time domain.
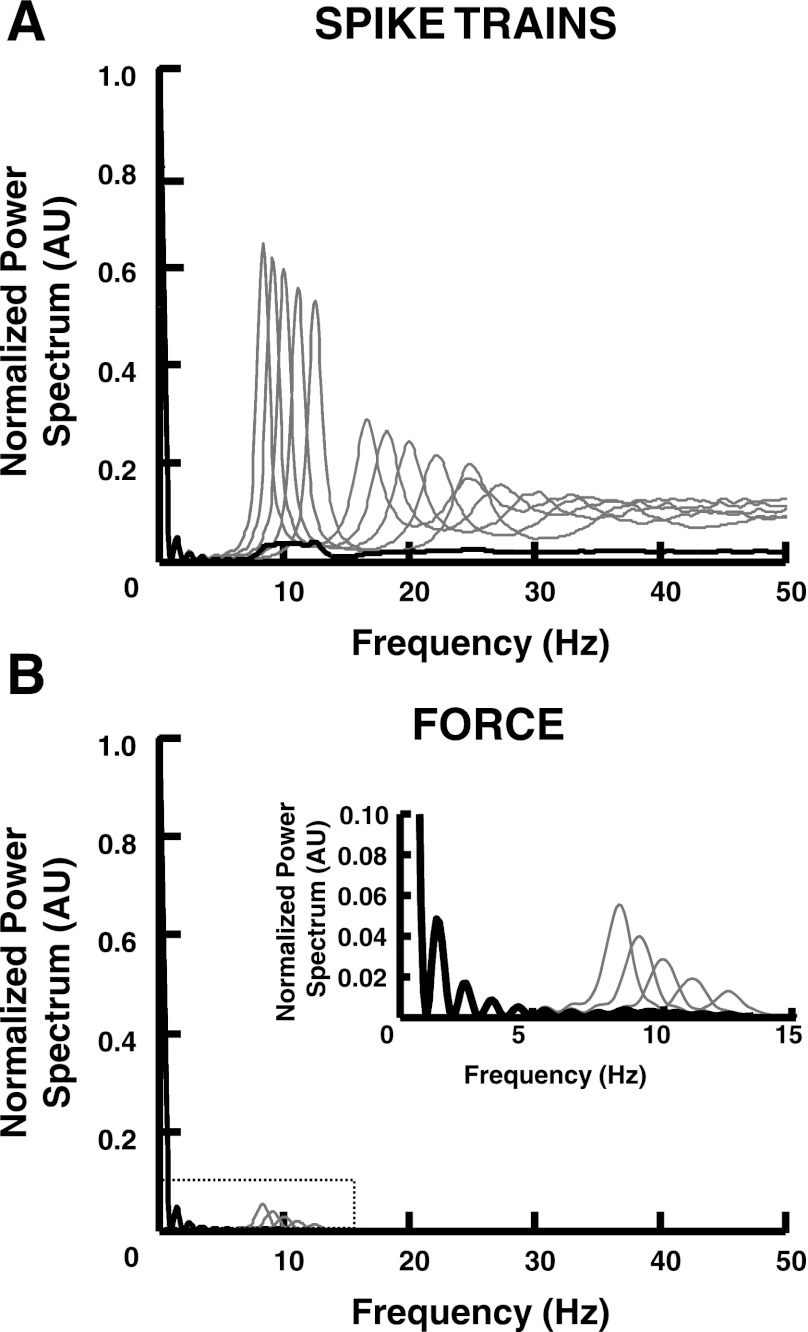
Figure 2 shows the influence of spatial summation for five individual spike trains on the corresponding force spectrum. The spike trains have different average discharge rates (8.3, 9.1, 10, 11.1, and 12.5 pps) but the same CoV for ISI (10%). Figure 2A shows the individual power spectra of the spike trains and the corresponding spatial summation. The spectra are normalized to the mean value of the signals or the value at zero frequency. According to Eq. 3, this example shows how the SF can blur the contributions at high frequencies relative to the mean amplitude of the signal (DC component). Figure 2B shows the same results, but after the convolution with the twitch impulse response; for simplicity, the same twitch force was used as in the previous example for all motor unit spike trains. The normalized spectra show how the combination of TF and SF drastically reduces the signal components that contribute to force variability beyond DC.
Fig. 2.
Averaging effect of the summation of individual spike and twitch trains (spatial filtering). A: power spectra of 5 spike trains (gray lines) are shown with the power spectrum of the corresponding summation (black line). B: power spectra of the individual twitch trains (gray lines) and the summation (black line). Inset: power spectra in a smaller frequency range (0–15 Hz). All spectra are normalized to the value at zero frequency (mean value).
Filtering of Low-Frequency Oscillations
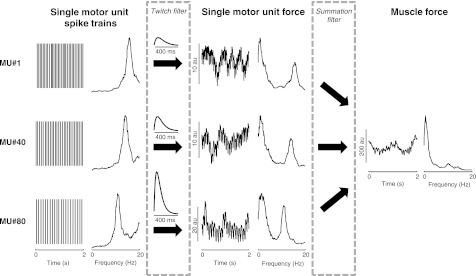
Unless stated otherwise, the next set of results refers to the simulation conditions for FDI as implemented in Dideriksen et al. (2010), with 120 motor units, no synchronization, and default values for twitch contraction time and gain of synaptic noise. The neural drive to the muscle (all the action potentials delivered to the muscle from the output layer of the spinal cord) contains frequency components that are attenuated by low-pass filtering of the individual motor unit twitches (TF) and the summation process that produces muscle force (SF). Figure 3 depicts the temporal and spectral characteristics of each step involved in the generation of muscle force for a simulated contraction at 20% MVC force. The power spectra for motor unit force display a prominent spectral peak at ∼3 Hz associated with the low-frequency fluctuations (3 Hz) embedded in the control signal (determined by the PID control algorithm). When the single motor unit forces were summed, SF enhanced this component with respect to other spectral lines associated with discharge rate variability.
Fig. 3.
Time- and frequency-domain representations of the spike trains and force from 3 motor units (MUs 1, 40, 80) and the net muscle force (in arbitrary units, au). The target force was 20% maximal voluntary contraction (MVC), and MU 80 was among the largest motor units recruited at this force.
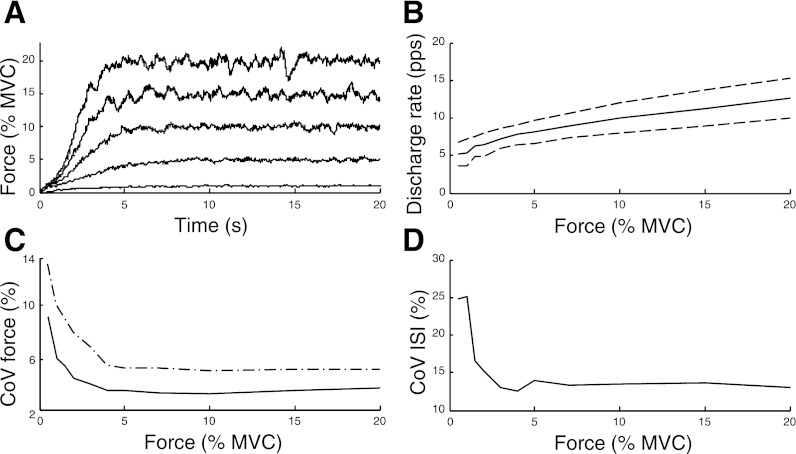
Figure 4 shows a representative example of simulated force, average motor unit discharge rate, force variability, and motor unit discharge variability for 20-s contractions with target forces ranging from 0.5% MVC to 20% MVC. Average discharge rate (Fig. 4B) increased with target force, and its standard deviation increased as more motor units were recruited. Consistent with experimental observations for the FDI, the relative force variability (CoV) in the simulations was greatest at low forces (<4% MVC) and declined to a steady level at higher forces (Barry et al. 2007; Burnett et al. 2000; Galganski et al. 1993; Laidlaw et al. 2000; Lee Hong and Newell 2008; Moritz et al. 2005; Sosnoff and Newell 2006; Sosnoff et al. 2006; Tracy et al. 2007). These results were also confirmed by the experimental analysis performed in the present study on the abductor digiti minimi muscle, as the CoV for force was higher at 2.5% MVC force (3.5 ± 1.2%) than at 10% MVC (1.9 ± 0.5%).
Fig. 4.
The simulated force for 20-s contractions at 5 target forces (A; 1%, 5%, 10%, 15%, and 20% MVC force), the average ± SD discharge rate for all active motor units (B), CoV for force in simulations with (dash-dotted line) and without (solid line) motor unit synchronization (C), and the average CoV for ISI for all active motor units (D) for the simulated target forces.
When common synaptic noise was imposed to induce synchronization (CIS = 1), the CoV for force increased by ∼1.5 percentage points (pp) for target forces >2% MVC and by up to 4 pp for lower forces (Fig. 4C). This increase in force fluctuations was related to greater variability in the magnitude of the PID control signal; its CoV increased from 2.6 ± 0.3% (without synchronization) to 3.6 ± 0.3% (with synchronization). The relative discharge variability (CoV for ISI; averaged for all active motor units) exhibited a trend similar to the force variability across the simulated forces (Fig. 4, C and D). Because the proportion of motor units just below threshold is greatest at low forces, the average discharge variability was greatest at low forces (Matthews 1996). The average level of common drive to the motor unit population (De Luca et al. 1982b) was 0.35 for the contraction at 10% MVC force, both with and without synchronization, which is within the range observed experimentally (Mochizuki et al. 2006; Semmler et al. 1997).
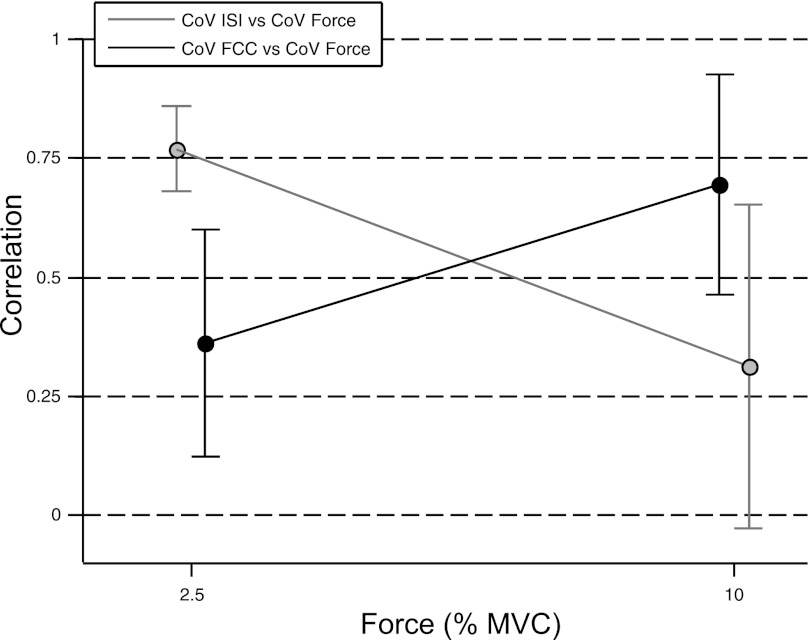
The correlation between CoV for force and CoV for descending drive was ∼0.4 at low forces (<4% MVC) and increased to 0.88 at 20% MVC force. The association between CoV for ISI and CoV for force changed in the opposite direction: R = 0.62 for forces <4% MVC and R = 0.31 for 20% MVC. These results were confirmed by the experimental observations shown in Fig. 5. In the experiments, 44 single motor unit spike trains were identified in the four subjects (2.5% MVC: 9 motor units; 10% MVC: 35 motor units). The strength of the association between CoV for FCC and CoV for abduction force increased with target force (2.5%: 0.36 ± 0.24; 10%: 0.70 ± 0.23), in contrast to the strength of the association between CoV for ISI and CoV for abduction force (2.5%: 0.77 ± 0.09; 10%: 0.31 ± 0.31).
Fig. 5.
Experimental results illustrating the correlation between CoV for force and CoV for ISI (gray line) and the correlation between CoV for force and CoV for first common component (FCC) (black line) for steady isometric contractions at target forces of 2.5% and 10% MVC.
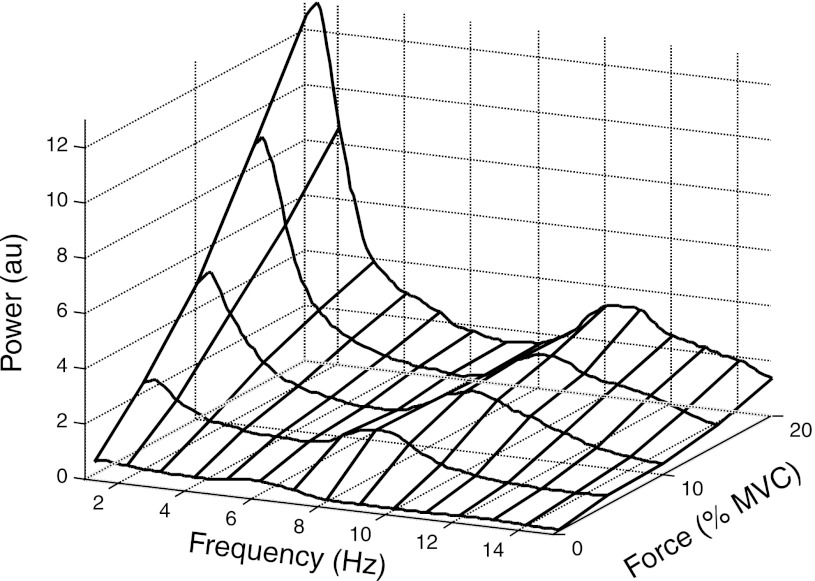
Figure 6 depicts the smoothed power spectra for the simulated forces ranging from 1% to 20% MVC. The power spectra comprise two peaks: a prominent low-frequency peak and a secondary peak that reflects the average motor unit discharge rate (see Fig. 4B). This distribution of power is consistent with the experimental observations with most of the power in the 0–4 Hz band (Dewhurst et al. 2007; Slifkin and Newell 1999). Furthermore, spectral peaks related to the motor unit discharge rate have only been observed at low forces (Galganski et al. 1993). The greater relative amplitude of the low-frequency spectral peak at high forces is reflected in a decrease in the median power frequency with an increase in force, indicating a smoother force signal with an increase in target force (Fig. 4D). The decline in median frequency for muscle force contrasts with the stable value for individual forces of the contributing motor units, and the bandwidth for the first spectral peak (<5 Hz) was narrower for muscle force than for single motor unit forces. These observations indicate that the summation of single motor unit forces preserves the low-frequency content of single motor unit forces, as expected theoretically from the sum of uncorrelated components (noise), and that this filtering occurred once the target force exceeded ∼10% MVC for this set of simulation conditions.
Fig. 6.
Power spectra for the simulated forces up to 20% MVC.
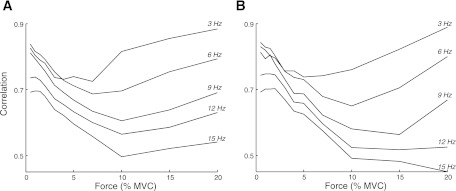
When a sufficient number of motor units were active, therefore, the ensemble of the spike trains correlated with the low-frequency oscillation in muscle force. Figure 7 depicts the correlation between fluctuations in force and CST when CST was low-pass filtered at different cutoff frequencies for contraction levels up to 20% MVC for simulations with (Fig. 7B) and without (Fig. 7A) synchronization. The correlation was less influenced by the low-pass filter cutoff frequency at low target forces (<5% MVC), which indicates that a wide spectrum of the synaptic noise was transmitted to muscle force. At greater target forces (>10% MVC), however, the correlation was high only when CST was filtered at low cutoff frequencies (<6 Hz), which indicates that only the low-frequency components of the discharge pattern are transmitted to force. Synchronization had little influence on the magnitude of these correlations (Fig. 7B).
Fig. 7.
Average peak correlations between the fluctuations in force and low-pass filtered composite spike train (CST) (cutoff frequencies of 3, 6, 9, 12, and 15 Hz) for target forces from 0.5–20% MVC for simulations without (A) and with (B) imposed short-term motor unit synchronization.
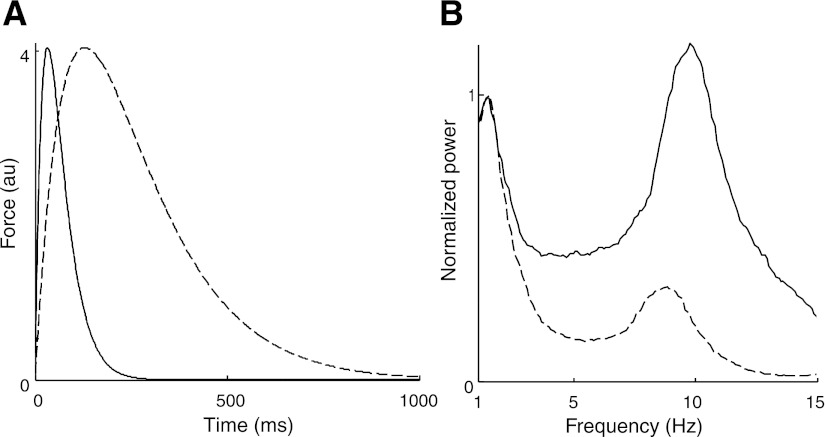
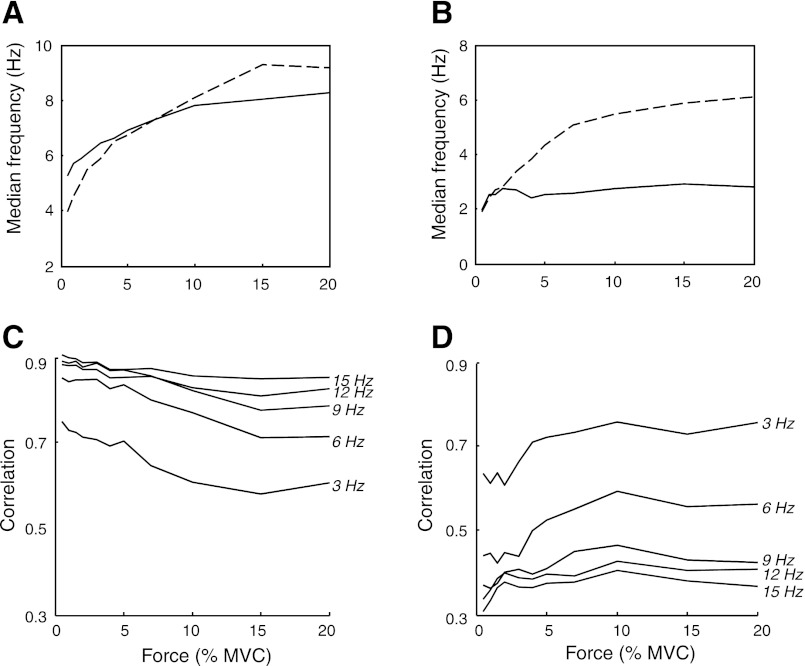
Motor unit twitch contraction times influenced the power spectrum for force (Fig. 8), the median frequency of muscle force and individual forces of the contributing motor units (Fig. 9, A and B), and the transmission of spike-train frequencies to muscle force (Fig. 9, C and D; representation similar to Fig. 7). An increase in contraction time (longer twitches) augmented the influence of the filter and reduced the threshold force above which only the low-frequency content was transmitted to force (∼2% MVC; Fig. 9B vs. Fig. 9A). Consequently, the full spectral content of the spike trains is transmitted to muscle force when twitch duration is shortened for target forces up to 20% MVC (Fig. 9, C and D), whereas only the common low-frequency input is transmitted with longer contraction times. The correlation between the spike trains and force fluctuations was greater for short contraction times with a low-pass filter at 15 Hz than at 3 Hz (Fig. 9C), whereas the converse association was observed for longer contraction times (Fig. 9D). Thus the influence of TF and SF on force steadiness depended on the number and twitch properties of the activated motor units.
Fig. 8.
Twitch of the smallest motor unit (MU 1) with the contraction time multiplied by 0.5 (solid line) and 2 (dashed line) (A) and power spectrum for muscle force with the contraction time of all motor unit twitches multiplied by 0.5 (solid line) and 2 (dashed line) for a 20% MVC contraction (B). The power is normalized to the maximal power of the first spectral peak. The frequency at the second spectral peak was greater for fast contraction times because of a greater average discharge rate to achieve the target force.
Fig. 9.
A and B: median power frequency for muscle force (solid lines) and mean of all active single motor unit forces (dashed lines) when the contraction times were multiplied by 0.5 (A) or 2 (B). C and D: average peak correlations between the fluctuations in force and low-pass filtered CST (cutoff frequencies of 3, 6, 9, 12, and 15 Hz) for target forces from 0.5% to 20% MVC for simulations with the contraction times multiplied by 0.5 (C) or 2 (D).
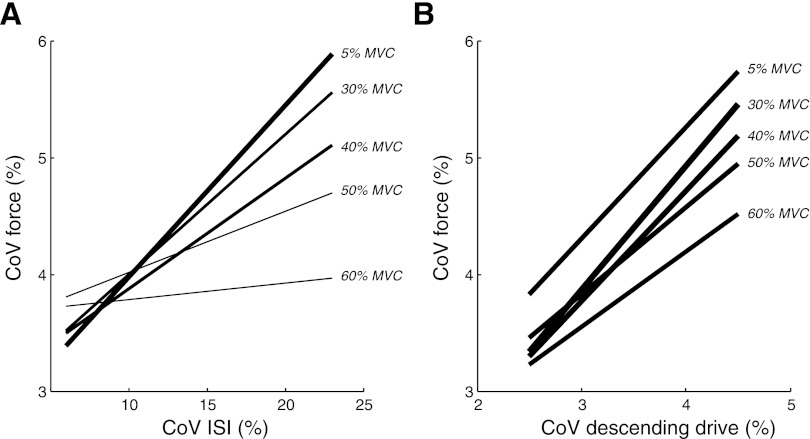
Force steadiness (CoV force) was also influenced by the gain of the synaptic noise, at least for the model settings representing FDI. The influence of synaptic noise on force variability (slope of the regression lines) declined with an increase in target force (number of recruited motor units; Fig. 10A). In contrast, the influence of variability in the PID control signal on force variability was not modulated by target force (Fig. 10B). This indicates that force steadiness during contractions above a threshold force was entirely due to variability in the PID control signal.
Fig. 10.
Linear regression lines for the relations between CoV for force and CoV for ISI (A) and CoV for the descending drive (B), respectively, for 5 target forces. Simulations were performed with settings representing the first dorsal interosseus muscle (FDI) (120 motor units, full recruitment at 60% MVC force).
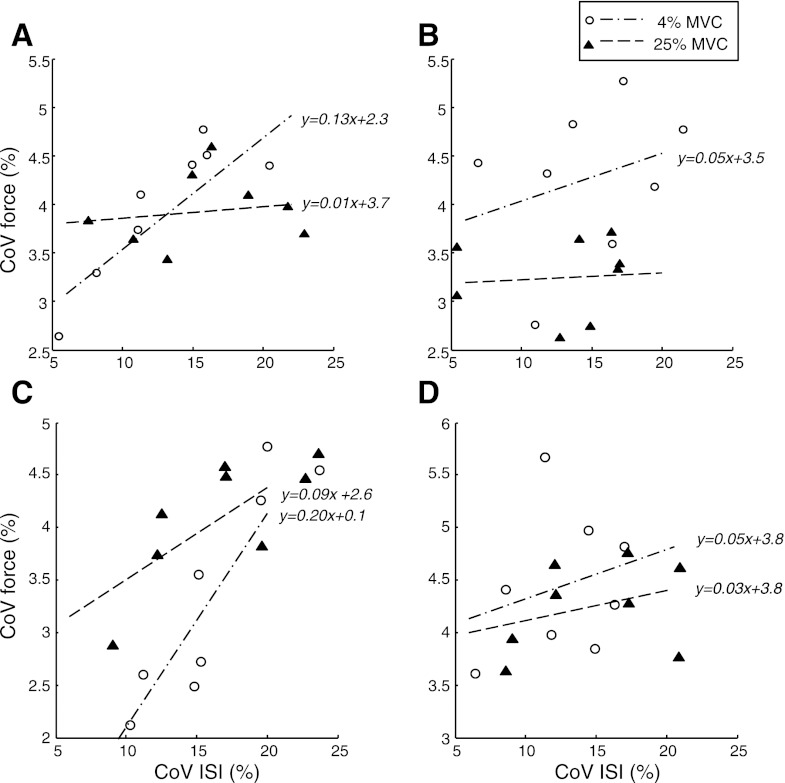
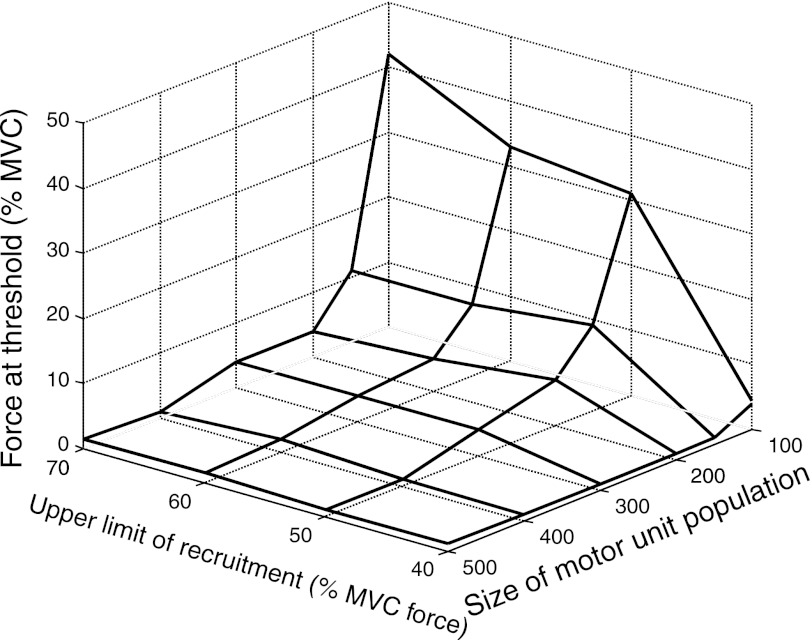
The influence of discharge variability (CoV for ISI) on force variability (CoV for force) was limited to low target forces for various combinations of motor unit population size and upper limit of recruitment. The slope of the relation between CoVs for ISI and force, for example, was only significant (slope > 0.1) for a contraction to 4% MVC force with 200 motor units and not with a stronger contraction (25% MVC force) or more motor units (400; Fig. 11, A and B). Similarly, the relation was only significant for a weak contraction (4% MVC force) and an upper limit of motor unit recruitment of 70% MVC and not a stronger contraction (25% MVC force) or a 40% MVC force upper limit of recruitment (Fig. 11, C and D). These effects are summarized in Fig. 12, which shows the greatest target force (threshold level) at which the relation was significant (slope > 0.1) for all simulated combinations of motor unit population size (range 100–500) and upper limit of recruitment (40–70% MVC). Force steadiness at target forces below threshold, but not stronger contractions, was limited by synaptic noise. The threshold force was <5% MVC for most simulations, except for small motor unit populations (<200) or greater upper limits of motor unit recruitment.
Fig. 11.
Scatterplots and linear regression lines between CoV for ISI and CoV for force during contractions at target forces of 4% (circles and dash-dotted lines) and 25% (triangles and broken lines) MVC. Each simulation was repeated 8 times, and the gain of the synaptic noise was varied between 0.5 and 2. The simulations varied the size of the motor unit population and the upper limit of recruitment: 200 and 60% (A); 400 and 60% (B); 150 and 70% (C); 150 and 40% (D).
Fig. 12.
Greatest target forces at which the slope of the linear relation between CoV for ISI and CoV for force was >0.1 for all combinations of motor unit population size (100, 150, 200, 300, 400, and 500) and upper limits of motor unit recruitment (40%, 50%, 60%, and 70% MVC).
DISCUSSION
The simulation results indicate that muscle contractile properties, size of the motor unit population, and the upper limit of motor unit recruitment establish a threshold force above which the influence of discharge variability on force variability is negligible. Although the low-pass filtering effect of force generation was an expected observation, this study quantifies the effect and indicates that the threshold force is low for parameters that match the characteristics of typical limb and hand muscles. Thus the synaptic noise attributable to the input received by the motoneuron has a negative influence on force steadiness only at low forces, which explains previous experimental observations. The attenuation of the influence of synaptic noise is attributable to two filtering effects that act on the motor unit spike trains: one that imposes temporal filtering (TF) and another that provides spatial filtering (SF). Except for when the simulated muscle had either a small motor unit population or a large recruitment range, a sufficient number of motor units were active even at low forces (<5% MVC) to engage the low-pass filters (Fig. 11). The simulation setting reflecting the FDI (120 motor units, full recruitment at 60% MVC force), represented one of the few cases in which the level of synaptic noise did have an influence on the force variability up to relatively high forces (up to ∼20% MVC; Fig. 12), which is consistent with previous studies on this muscle (Jones et al. 2002; Moritz et al. 2005) and with the recent suggestion that hand muscle properties may not be optimally selected with respect to force steadiness (Fuglevand 2011; Hamilton et al. 2004).
When the simulated force exceeded the threshold force (Fig. 12), only the low-frequency content of the neural drive was transmitted to the muscle force (Fig. 7). This was supported by experimental observations that the variability of FCC (estimate of the common input) increased its correlation with force variability as the target force increased, whereas the motor unit discharge rate variability showed the opposite trend (Fig. 5). Moreover, experimental assessment of the association between ISI variability and force variability was poor at relatively low forces (10% MVC). This result was predicted by the simulations, considering that the average number of motor units in the abductor digiti minimi muscle is ∼380 (Santo Neto et al. 1985) and assuming that the upper limit of motor unit recruitment is ∼50–60% MVC, as in other intrinsic hand muscles (Kukulka and Clamann 1981; Thomas et al. 1986) (see Fig. 12).
In the model, the slow fluctuations in muscle force were highly correlated with the output of the control algorithm, which represented the adjustments in the magnitude of the common input that maintained the target force, thereby reflecting the integration of the descending and afferent inputs into the neural drive sent to the muscle (Farina et al. 2012). The control algorithm adjusted the descending drive at a frequency of 3 Hz, which is similar to experimental observations (Loram et al. 2011). A previous simulation study showed that it is not possible to simulate realistic muscle forces in the absence of common low-frequency variability of motor unit discharge rates (Taylor et al. 2003). Experimentally, these fluctuations are observed as a common drive to the motor unit population, which are usually at frequencies <2–3 Hz (De Luca et al. 1982b), and the imposed fluctuations in motor unit discharge rates are correlated with the fluctuations in muscle force across several contraction levels (Negro et al. 2009).
These findings suggest that differences in force steadiness between adults and children (Deutsch and Newell 2001), training-related improvements in old adults (Keen et al. 1994; Laidlaw et al. 1999), and visual feedback conditions (Baweja et al. 2010; Slifkin et al. 2000) are mediated by changes in the low-frequency modulation of discharge rate rather than differences in synaptic noise. Similarly, pathological tremor arising from oscillatory descending input to the motoneuron pool (Raethjen et al. 2007) is transmitted in the motor output because this input is largely common to the entire motoneuron population (Christakos et al. 2009). Furthermore, the decrease in force steadiness in the presence of high levels of motor unit synchronization observed in the present study was likely attributable to increased variability in the magnitude of the simulated descending drive due to the difficulty experienced by the control algorithm to maintain a constant force with the increased probability of near-simultaneous twitches.
These results indicate that the scaling of force variability with force magnitude to produce a constant CoV for force (signal-dependent noise; Harris and Wolpert 1998), except at low forces (Fig. 4C) (Galganski et al. 1993; Schmidt et al. 1979), is attributable to features of the control signal produced by the CNS. Consequently, differences in force variability observed across muscles at forces >20% MVC (Hamilton et al. 2004) are related to the ability of the CNS to produce a stable neural drive to muscle rather than due to differences in either synaptic noise or intrinsic muscle properties. Similarly, the decreased force steadiness observed in older adults (Galganski et al. 1993; Keen et al. 1994) may also be related to descending drive variability as well as a reduction in the size of the motoneuron population (Campbell et al. 1973; Tomlinson and Irving 1977). Conversely, increases in twitch contraction times, such as occur with aging (Narici et al. 1991), serve to improve force steadiness (Fig. 9).
According to the results of the present study, experimental observations suggest that muscle contractile properties, motor unit population size, and recruitment strategy have been selected to minimize the contraction force at which synaptic noise ceases to influence the motor output. At a given contraction intensity, for example, low-threshold motor units discharge at a greater rate than higher-threshold units (De Luca et al. 1982a) and the twitch filtering of these units has the lowest cutoff frequency (Baldissera et al. 1998), so that the main contribution to force has small variability. Furthermore, the distributions of rheobase currents of motoneuron populations are skewed toward low currents (Gustafsson and Pinter 1984; Powers and Binder 1985), thereby increasing the number of active motor units at low forces and thus maximizing the effect of SF that depends on the number of active units (Fig. 12). Also, muscles with few motor units (<200) generally employ a low recruitment range (Kukulka and Clamann 1981; Thomas et al. 1986), which favors SF at low forces by recruitment of a relatively large fraction of units at the same relative force (Fig. 12). In this way, the small number of units, which favors variability, is compensated by the small recruitment range, which has the opposite effect. Conversely, muscles with many motor units tend to have a greater upper limit of motor unit recruitment (Kukulka and Clamann 1981; Oya et al. 2009). Furthermore, motor unit recruitment thresholds are lower in the FDI of the dominant hand (which also produced the more stable force) compared with the nondominant hand (Adam et al. 1998).
In conclusion, synaptic noise only influences force steadiness at low forces, after which the fluctuations in force are attributable to low-frequency oscillations in the neural drive to muscle. Once a certain number of motor units are active, the influence of synaptic noise is filtered by the twitch (temporal) and summation (spatial) filtering effects of muscle properties. In muscles for which force steadiness is functionally significant, muscle and recruitment properties have likely been selected to engage the filtering mechanisms at low forces and thereby to minimize the influence of synaptic noise on motor output.
GRANTS
We acknowledge financial support by the German Ministry for Education and Research (BMBF) via the Bernstein Focus Neurotechnology (BFNT) Göttingen under Grant No. 1GQ0810 and the European Research Council Advanced Grant DEMOVE (contract no. 267888) (D. Farina).
DISCLOSURES
No conflicts of interest, financial or otherwise, are declared by the author(s).
AUTHOR CONTRIBUTIONS
Author contributions: J.L.D., F.N., R.M.E., and D.F. conception and design of research; J.L.D., F.N., and D.F. analyzed data; J.L.D., F.N., R.M.E., and D.F. interpreted results of experiments; J.L.D. and F.N. prepared figures; J.L.D., F.N., R.M.E., and D.F. drafted manuscript; J.L.D., F.N., R.M.E., and D.F. edited and revised manuscript; J.L.D., F.N., R.M.E., and D.F. approved final version of manuscript.
APPENDIX A: AUTO- AND CROSS-SPECTRA OF SPIKE TRAINS
Although derivations of the power spectrum of spike trains have been reported previously (Lago and Jones 1977; Pan et al. 1989), we provide a slightly modified version of such derivations and include the convolution by twitch force so that the spectral components can be compared with force steadiness.
A spike train γ(t) can be modeled as
| (A1) |
where φi = iT + θi with T the average discharge interval and θi independent random variables with the same probability density function fθi(x) = q(x)∀i. The power spectrum Gγ(t) of the process γ(t) can be computed as the Fourier transform of the autocorrelation function of γ(t):
| (A2) |
The first term in Eq. A2 is zero if τ ≠ 0, and if τ = 0 we have
| (A3) |
The second term can be computed as
| (A4) |
With the substitution l = i − j we obtain
| (A5) |
Therefore the autocorrelation function of γ(t) depends on t and τ and is given by
| (A6) |
Rγ(t,τ) is periodic in the variable t with period T:
| (A7) |
Because the mean and the autocorrelation of the process γ(t) are periodic, its spectrum is the Fourier transform of the mean on a period T of the autocorrelation function (cyclostationary process). The averaged autocorrelation is given by
| (A8) |
The first term in Eq. A8 can be approximated by assuming that the probability density function q(t) is zero outside the interval . In this case we have
| (A9) |
The assumption made on the probability density function corresponds to the physiological constraints that the time of a discharge is always smaller than the time of the following discharge.
With a similar assumption the second term also can be approximated:
| (A10) |
with Rq(τ) being the determinist autocorrelation function of q(t).
So we obtain
| (A11) |
The spectrum of the process γ(t) is given by the Fourier transform of the averaged autocorrelation function:
| (A12) |
with Gq(f) the Fourier transform of the determinist autocorrelation Rq(τ) of the probability density function q(t). This is given by
| (A13) |
With multiple spike trains γk(t), under the same assumption of independence, the cross-spectra contain only a DC component proportional to the total level of coincident discharges that should be expected between two uncoupled spike trains:
| (A14) |
where Tk and Ti are the average discharge intervals of the two spike trains.
APPENDIX B: MODEL MODIFICATIONS
Changing the number of motor units in the model alters the maximal force, but the range of excitation levels at recruitment and at maximal discharge rate for each motor unit (termed RTE and Emax; Dideriksen et al. 2010; Fuglevand et al. 1993) does not change. Because the PID control algorithm estimates the excitation level for the motor unit population (termed required excitation level, RTE) based on the instantaneous force error (difference between predefined target force and simulated muscle force expressed in nonnormalized units, termed e), changing the size of the motor unit population introduces an error. To maintain a realistic force output for all sizes of the motor unit population, a gain (G) was introduced in the PID control algorithm (Eq. 13 in Dideriksen et al. 2010):
| (B1) |
where Kp, Ki, and Kd are the controller gains and N is the number of motor units in the population. G was determined as
| (B2) |
REFERENCES
- Adam A, De Luca CJ, Erim Z. Hand dominance and motor unit firing behavior. J Neurophysiol 80: 1373–1382, 1998 [DOI] [PubMed] [Google Scholar]
- Andersen JL, Aagaard P. Effects of strength training on muscle fiber types and size; consequences for athletes training for high-intensity sport. Scand J Med Sci Sports 20, Suppl 2: 32–38, 2010 [DOI] [PubMed] [Google Scholar]
- Baldissera F, Cavallari P, Cerri G. Motoneuronal pre-compensation for the low-pass filter characteristics of muscle. A quantitative appraisal in cat muscle units. J Physiol 511: 611–627, 1998 [DOI] [PMC free article] [PubMed] [Google Scholar]
- Barry BK, Pascoe MA, Jesunathadas M, Enoka RM. Rate coding is compressed but variability is unaltered for motor units in a hand muscle of old adults. J Neurophysiol 97: 3206–3218, 2007 [DOI] [PubMed] [Google Scholar]
- Baweja HS, Kennedy DM, Vu J, Vaillancourt DE, Christou EA. Greater amount of visual feedback decreases force variability by reducing force oscillations from 0–1 and 3–7 Hz. Eur J Appl Physiol 108: 935–943, 2010 [DOI] [PMC free article] [PubMed] [Google Scholar]
- Berg RW, Alaburda A, Hounsgaard J. Balanced inhibition and excitation drive spike activity in spinal half-centers. Science 315: 390–393, 2007 [DOI] [PubMed] [Google Scholar]
- Brown RE, Edwards DL, Jakobi JM. Sex differences in force steadiness in three positions of the forearm. Eur J Appl Physiol 110: 1251–1257, 2010 [DOI] [PubMed] [Google Scholar]
- Buchthal F, Madsen A. Synchronous activity in normal and atrophic muscle. Electroencephalogr Clin Neurophysiol 2: 425–444, 1950 [DOI] [PubMed] [Google Scholar]
- Burnett RA, Laidlaw DH, Enoka RM. Coactivation of the antagonist muscle does not covary with steadiness in old adults. J Appl Physiol 89: 61–71, 2000 [DOI] [PubMed] [Google Scholar]
- Campbell MJ, McComas AJ, Petito F. Physiological changes in ageing muscles. J Neurol Neurosurg Psychiatry 36: 174–182, 1973 [DOI] [PMC free article] [PubMed] [Google Scholar]
- Christakos CN, Erimaki S, Anagnostou E, Anastasopoulos D. Tremor-related motor unit firing in Parkinson's disease: implications for tremor genesis. J Physiol 587: 4811–4827, 2009 [DOI] [PMC free article] [PubMed] [Google Scholar]
- Christou EA, Grossman M, Carlton LG. Modeling variability of force during isometric contractions of the quadriceps femoris. J Mot Behav 34: 67–81, 2002 [DOI] [PubMed] [Google Scholar]
- Clamann HP. Statistical analysis of motor unit firing patterns in a human skeletal muscle. Biophys J 9: 1233–1251, 1969 [DOI] [PMC free article] [PubMed] [Google Scholar]
- Danion F, Gallea C. The relation between force magnitude, force steadiness, and muscle co-contraction in the thumb during precision grip. Neurosci Lett 368: 176–180, 2004 [DOI] [PubMed] [Google Scholar]
- Dartnall TJ, Nordstrom MA, Semmler JG. Motor unit synchronization is increased in biceps brachii after exercise-induced damage to elbow flexor muscles. J Neurophysiol 99: 1008–1019, 2008 [DOI] [PubMed] [Google Scholar]
- Datta AK, Stephens JA. Synchronization of motor unit activity during voluntary contraction in man. J Physiol 422: 397–419, 1990 [DOI] [PMC free article] [PubMed] [Google Scholar]
- De Luca CJ, LeFever RS, McCue MP, Xenakis AP. Behaviour of human motor units in different muscles during linearly varying contractions. J Physiol 329: 113–128, 1982a [DOI] [PMC free article] [PubMed] [Google Scholar]
- De Luca CJ, LeFever RS, McCue MP, Xenakis AP. Control scheme governing concurrently active human motor units during voluntary contractions. J Physiol 329: 129–142, 1982b [DOI] [PMC free article] [PubMed] [Google Scholar]
- Deutsch KM, Newell KM. Age differences in noise and variability of isometric force production. J Exp Child Psychol 80: 392–408, 2001 [DOI] [PubMed] [Google Scholar]
- Dewhurst S, Graven-Nielsen T, De Vito G, Farina D. Muscle temperature has a different effect on force fluctuations in young and older women. Clin Neurophysiol 118: 762–769, 2007 [DOI] [PubMed] [Google Scholar]
- Dideriksen JL, Falla D, Baekgaard M, Mogensen ML, Steimle KL, Farina D. Comparison between the degree of motor unit short-term synchronization and recurrence quantification analysis of the surface EMG in two human muscles. Clin Neurophysiol 120: 2086–2092, 2009 [DOI] [PubMed] [Google Scholar]
- Dideriksen JL, Farina D, Baekgaard M, Enoka RM. An integrative model of motor unit activity during sustained submaximal contractions. J Appl Physiol 108: 1550–1562, 2010 [DOI] [PubMed] [Google Scholar]
- Ellaway PH. Cumulative sum technique and its application to the analysis of peristimulus time histograms. Electroencephalogr Clin Neurophysiol 45: 302–304, 1978 [DOI] [PubMed] [Google Scholar]
- Faisal AA, Selen LP, Wolpert DM. Noise in the nervous system. Nat Rev Neurosci 9: 292–303, 2008 [DOI] [PMC free article] [PubMed] [Google Scholar]
- Farina D, Negro F, Gizzi L, Falla D. Low-frequency oscillations of the neural drive to the muscle are increased with experimental muscle pain. J Neurophysiol 107: 958–965, 2012 [DOI] [PMC free article] [PubMed] [Google Scholar]
- Fuglevand AJ. Mechanical properties and neural control of human hand motor units. J Physiol 589: 5595–5602, 2011 [DOI] [PMC free article] [PubMed] [Google Scholar]
- Fuglevand AJ, Macefield VG, Bigland-Ritchie B. Force-frequency and fatigue properties of motor units in muscles that control digits of the human hand. J Neurophysiol 81: 1718–1729, 1999 [DOI] [PubMed] [Google Scholar]
- Fuglevand AJ, Winter DA, Patla AE. Models of recruitment and rate coding organization in motor-unit pools. J Neurophysiol 70: 2470–2488, 1993 [DOI] [PubMed] [Google Scholar]
- Galganski ME, Fuglevand AJ, Enoka RM. Reduced control of motor output in a human hand muscle of elderly subjects during submaximal contractions. J Neurophysiol 69: 2108–2115, 1993 [DOI] [PubMed] [Google Scholar]
- Gustafsson B, Pinter MJ. An investigation of threshold properties among cat spinal alpha-motoneurones. J Physiol 357: 453–483, 1984 [DOI] [PMC free article] [PubMed] [Google Scholar]
- Halliday DM, Conway BA, Farmer SF, Rosenberg JR. Load-independent contributions from motor-unit synchronization to human physiological tremor. J Neurophysiol 82: 664–675, 1999 [DOI] [PubMed] [Google Scholar]
- Hamilton AF, Jones KE, Wolpert DM. The scaling of motor noise with muscle strength and motor unit number in humans. Exp Brain Res 157: 417–430, 2004 [DOI] [PubMed] [Google Scholar]
- Harris CM, Wolpert DM. Signal-dependent noise determines motor planning. Nature 394: 780–784, 1998 [DOI] [PubMed] [Google Scholar]
- Heckman CJ, Enoka RM. Physiology of the motor neuron and the motor unit. In: Neurophysiology of Motor Neuron Diseases, Handbook of Clinical Neurophysiology, edited by Eisen A. Amsterdam: Elsevier, 2004, vol. 4, p. 119–147 [Google Scholar]
- Herbert RD, Gandevia SC. Twitch interpolation in human muscles: mechanisms and implications for measurement of voluntary activation. J Neurophysiol 82: 2271–2283, 1999 [DOI] [PubMed] [Google Scholar]
- Jones KE, Hamilton AF, Wolpert DM. Sources of signal-dependent noise during isometric force production. J Neurophysiol 88: 1533–1544, 2002 [DOI] [PubMed] [Google Scholar]
- Keen DA, Yue GH, Enoka RM. Training-related enhancement in the control of motor output in elderly humans. J Appl Physiol 77: 2648–2658, 1994 [DOI] [PubMed] [Google Scholar]
- Kukulka CG, Clamann HP. Comparison of the recruitment and discharge properties of motor units in human brachial biceps and adductor pollicis during isometric contractions. Brain Res 219: 45–55, 1981 [DOI] [PubMed] [Google Scholar]
- Lago P, Jones NB. Effect of motor-unit firing time statistics on e.m.g. spectra. Med Biol Eng Comput 15: 648–655, 1977 [DOI] [PubMed] [Google Scholar]
- Laidlaw DH, Bilodeau M, Enoka RM. Steadiness is reduced and motor unit discharge is more variable in old adults. Muscle Nerve 23: 600–612, 2000 [DOI] [PubMed] [Google Scholar]
- Laidlaw DH, Kornatz KW, Keen DA, Suzuki S, Enoka RM. Strength training improves the steadiness of slow lengthening contractions performed by old adults. J Appl Physiol 87: 1786–1795, 1999 [DOI] [PubMed] [Google Scholar]
- Lee Hong S, Newell KM. Visual information gain and the regulation of constant force levels. Exp Brain Res 189: 61–69, 2008 [DOI] [PubMed] [Google Scholar]
- Loram ID, Gollee H, Lakie M, Gawthrop PJ. Human control of an inverted pendulum. Is continuous control necessary? Is intermittent control effective? Is intermittent control physiological? J Physiol 589: 307–324, 2011 [DOI] [PMC free article] [PubMed] [Google Scholar]
- Matthews PB. Relationship of firing intervals of human motor units to the trajectory of post-spike after-hyperpolarization and synaptic noise. J Physiol 492: 597–628, 1996 [DOI] [PMC free article] [PubMed] [Google Scholar]
- McGill KC, Lateva ZC, Marateb HR. EMGLAB: an interactive EMG decomposition program. J Neurosci Methods 149: 121–133, 2005 [DOI] [PubMed] [Google Scholar]
- Mochizuki G, Semmler JG, Ivanova TD, Garland SJ. Low-frequency common modulation of soleus motor unit discharge is enhanced during postural control in humans. Exp Brain Res 175: 584–595, 2006 [DOI] [PubMed] [Google Scholar]
- Moritz CT, Barry BK, Pascoe MA, Enoka RM. Discharge rate variability influences the variation in force fluctuations across the working range of a hand muscle. J Neurophysiol 93: 2449–2459, 2005 [DOI] [PubMed] [Google Scholar]
- Narici MV, Bordini M, Cerretelli P. Effect of aging on human adductor pollicis muscle function. J Appl Physiol 71: 1277–1281, 1991 [DOI] [PubMed] [Google Scholar]
- Negro F, Farina D. Decorrelation of cortical inputs and motoneuron output. J Neurophysiol 106: 2688–2697, 2011 [DOI] [PubMed] [Google Scholar]
- Negro F, Holobar A, Farina D. Fluctuations in isometric muscle force can be described by one linear projection of low-frequency components of motor unit discharge rates. J Physiol 587: 5925–5938, 2009 [DOI] [PMC free article] [PubMed] [Google Scholar]
- Nordstrom MA, Fuglevand AJ, Enoka RM. Estimating the strength of common input to human motoneurons from the cross-correlogram. J Physiol 453: 547–574, 1992 [DOI] [PMC free article] [PubMed] [Google Scholar]
- Oya T, Riek S, Cresswell AG. Recruitment and rate coding organisation for soleus motor units across entire range of voluntary isometric plantar flexions. J Physiol 587: 4737–4748, 2009 [DOI] [PMC free article] [PubMed] [Google Scholar]
- Pan ZS, Zhang Y, Parker PA. Motor unit power spectrum and firing rate. Med Biol Eng Comput 27: 14–18, 1989 [DOI] [PubMed] [Google Scholar]
- Powers RK, Binder MD. Distribution of oligosynaptic group I input to the cat medial gastrocnemius motoneuron pool. J Neurophysiol 53: 497–517, 1985 [DOI] [PubMed] [Google Scholar]
- Raethjen J, Govindan RB, Kopper F, Muthuraman M, Deuschl G. Cortical involvement in the generation of essential tremor. J Neurophysiol 97: 3219–3228, 2007 [DOI] [PubMed] [Google Scholar]
- Roatta S, Arendt-Nielsen L, Farina D. Sympathetic-induced changes in discharge rate and spike-triggered average twitch torque of low-threshold motor units in humans. J Physiol 586: 5561–5574, 2008 [DOI] [PMC free article] [PubMed] [Google Scholar]
- Santo Neto H, de Carvalho VC, Penteado CV. Motor units of the human abductor digiti minimi. Arch Ital Anat Embriol 90: 47–51, 1985 [PubMed] [Google Scholar]
- Schmidt RA, Zelaznik H, Hawkins B, Frank JS, Quinn JT., Jr Motor-output variability: a theory for the accuracy of rapid motor acts. Psychol Rev 47: 415–451, 1979 [PubMed] [Google Scholar]
- Sears TA, Stagg D. Short-term synchronization of intercostal motoneurone activity. J Physiol 263: 357–381, 1976 [DOI] [PMC free article] [PubMed] [Google Scholar]
- Semmler JG. Motor unit synchronization and neuromuscular performance. Exerc Sport Sci Rev 30: 8–14, 2002 [DOI] [PubMed] [Google Scholar]
- Semmler JG, Kornatz KW, Dinenno DV, Zhou S, Enoka RM. Motor unit synchronisation is enhanced during slow lengthening contractions of a hand muscle. J Physiol 545: 681–695, 2002 [DOI] [PMC free article] [PubMed] [Google Scholar]
- Semmler JG, Nordstrom MA. A comparison of cross-correlation and surface EMG techniques used to quantify motor unit synchronization in humans. J Neurosci Methods 90: 47–55, 1999 [DOI] [PubMed] [Google Scholar]
- Semmler JG, Nordstrom MA, Wallace CJ. Relationship between motor unit short-term synchronization and common drive in human first dorsal interosseous muscle. Brain Res 767: 314–320, 1997 [DOI] [PubMed] [Google Scholar]
- Slifkin AB, Newell KM. Noise, information transmission, and force variability. J Exp Psychol Hum Percept Perform 25: 837–851, 1999 [DOI] [PubMed] [Google Scholar]
- Slifkin AB, Vaillancourt DE, Newell KM. Intermittency in the control of continuous force production. J Neurophysiol 84: 1708–1718, 2000 [DOI] [PubMed] [Google Scholar]
- Sosnoff JJ, Newell KM. Are age-related increases in force variability due to decrements in strength? Exp Brain Res 174: 86–94, 2006 [DOI] [PubMed] [Google Scholar]
- Sosnoff JJ, Valantine AD, Newell KM. Independence between the amount and structure of variability at low force levels. Neurosci Lett 392: 165–169, 2006 [DOI] [PubMed] [Google Scholar]
- Taylor AM, Christou EA, Enoka RM. Multiple features of motor-unit activity influence force fluctuations during isometric contractions. J Neurophysiol 90: 1350–1361, 2003 [DOI] [PubMed] [Google Scholar]
- Tetzlaff T, Rotter S, Stark E, Abeles M, Aertsen A, Diesmann M. Dependence of neuronal correlations on filter characteristics and marginal spike train statistics. Neural Comput 20: 2133–2184, 2008 [DOI] [PubMed] [Google Scholar]
- Thomas CK, Ross BH, Stein RB. Motor-unit recruitment in human first dorsal interosseous muscle for static contractions in three different directions. J Neurophysiol 55: 1017–1029, 1986 [DOI] [PubMed] [Google Scholar]
- Tomlinson BE, Irving D. The numbers of limb motor neurons in the human lumbosacral cord throughout life. J Neurol Sci 34: 213–219, 1977 [DOI] [PubMed] [Google Scholar]
- Tracy BL. Visuomotor contribution to force variability in the plantarflexor and dorsiflexor muscles. Hum Mov Sci 26: 796–807, 2007 [DOI] [PMC free article] [PubMed] [Google Scholar]
- Tracy BL, Enoka RM. Older adults are less steady during submaximal isometric contractions with the knee extensor muscles. J Appl Physiol 92: 1004–1012, 2002 [DOI] [PubMed] [Google Scholar]
- Tracy BL, Mehoudar PD, Ortega JD. The amplitude of force variability is correlated in the knee extensor and elbow flexor muscles. Exp Brain Res 176: 448–464, 2007 [DOI] [PubMed] [Google Scholar]
- Ulfhake B, Cullheim S. Postnatal development of cat hind limb motoneurons. III. Changes in size of motoneurons supplying the triceps surae muscle. J Comp Neurol 278: 103–120, 1988 [DOI] [PubMed] [Google Scholar]
- Yao W, Fuglevand RJ, Enoka RM. Motor-unit synchronization increases EMG amplitude and decreases force steadiness of simulated contractions. J Neurophysiol 83: 441–452, 2000 [DOI] [PubMed] [Google Scholar]


