Abstract
Rapid temporal modulation of acoustic signals among several vertebrate lineages has recently been shown to depend on the actions of superfast muscles. We hypothesized that such fast events, known to require synchronous activation of muscle fibers, would rely on motoneuronal properties adapted to generating a highly synchronous output to sonic muscles. Using intracellular in vivo recordings, we identified a suite of premotor network inputs and intrinsic motoneuronal properties synchronizing the oscillatory-like, simultaneous activation of superfast muscles at high gamma frequencies in fish. Motoneurons lacked spontaneous activity, firing synchronously only at the frequency of premotor excitatory input. Population-level motoneuronal output generated a spike-like, vocal nerve volley that directly determines muscle contraction rate and, in turn, natural call frequency. In the absence of vocal output, motoneurons showed low excitability and a weak afterhyperpolarization, leading to rapid accommodation in firing rate. By contrast, vocal activity was accompanied by a prominent afterhyperpolarization, indicating a dependency on network activity. Local injection of a GABAA receptor antagonist demonstrated the necessity of electrophysiologically and immunohistochemically confirmed inhibitory GABAergic input for motoneuronal synchrony and vocalization. Numerous transneuronally labeled motoneurons following single-cell neurobiotin injection together with electrophysiological collision experiments confirmed gap junctional coupling, known to contribute to synchronous activity in other neural networks. Motoneuronal synchrony at the premotor input frequency was maintained during differential recruitment of variably sized motoneurons. Differential motoneuron recruitment led, however, to amplitude modulation (AM) of vocal output and, hence, natural call AM. In summary, motoneuronal intrinsic properties, in particular low excitability, predisposed vocal motoneurons to the synchronizing influences of premotor inputs to translate a temporal input code into a coincident and extremely synchronous, but variable-amplitude, output code. We propose an analogous suite of neuronal properties as a key innovation underlying similarly rapid acoustic events observed among amphibians, reptiles, birds, and mammals.
Keywords: hindbrain, motoneurons, superfast muscles, vocalization
high-frequency, synchronous neuronal firing is implicated in a wide spectrum of behavioral functions ranging from attention, information coding, and memory formation to neurological disorders including epilepsy and Parkinson's disease (Averbeck and Lee 2004; Axmacher et al. 2006; Baker et al. 1999; Jia and Kohn 2011; Niebur et al. 2002; Uhlhaas and Singer 2006). Recent studies also suggest an essential role for population level synchrony in the motor patterning of acoustic signaling, where rapid temporal modulation in the high-gamma (>80 Hz) range is linked to the actions of “superfast” muscles in several vertebrate lineages, including fishes (sonic swim bladder), reptiles (rattlesnake shaker), birds (syrinx), and mammals (larynx) (Elemans et al. 2004, 2008, 2011; Rome et al. 1996). Considerable progress has been made in identifying ultrastructural (Appelt et al. 1991; Bass and Marchaterre 1989; Fawcett and Revel 1961), oxidative (Walsh et al. 1995), and molecular-contractile properties (Rome 2006) adapted for high-frequency contraction (often >80 Hz under ambient conditions). Although nerve recordings alone suggest an extreme degree of synchrony in fish vocal systems that is not observed in other motor systems, namely, those underlying locomotion (see discussion), it remains essentially unknown how motoneuron populations pattern rapid acoustic events in fishes and vertebrates in general. We used intracellular recordings in an in vivo preparation to investigate the intrinsic and network properties leading to motoneuron synchrony in the evolutionarily conserved vocal network driving superfast muscle activity among toadfishes (Bass et al. 2008).
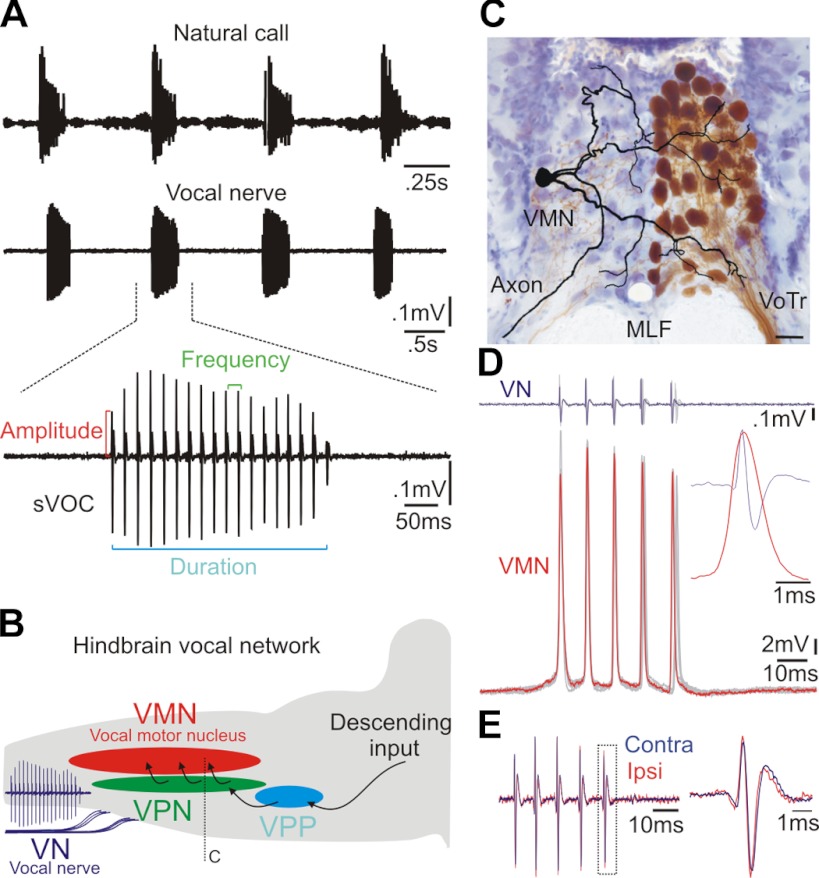
Toadfishes, which include midshipman fish, generate acoustic signals for social communication functions (Fig. 1A) by vibrating one set of superfast muscles attached to the walls of the swim bladder (Cohen and Winn 1967; Skoglund 1961; Tavolga 1971). Prior studies in toadfishes (Bass 1985; Bass and Baker 1990; Fine et al. 1984; Pappas and Bennett 1966) identified paired hindbrain vocal motor nuclei (VMN; Fig. 1, B and C), providing ipsilateral innervation to these muscles via the vocal nerve formed by axons exiting the brain through occipital nerve roots likely homologous to hypoglossal roots (Fig. 1, B and C) (Bass et al. 2008). Individual vocal motoneuron responses are matched 1:1 with brief, fast-rising vocal nerve waveforms/spikes representing synchronous motoneuron activity (Fig. 1D) (Bass and Baker 1990; Pappas and Bennett 1966). Both motor nuclei fire in phase (Fig. 1E), with each bilaterally synchronous vocal motor volley (VOC) resulting in simultaneous vocal muscle contraction and one sound pulse (Bass and Baker 1990, 1991; Cohen and Winn 1967). Morpho-physiological analyses in distantly related teleosts show a comparable vocal motor system (Bass and Andersen 1991; Bass et al. 2008; Bass and McKibben 2003; Onuki and Somiya 2007), suggesting its key role in the widespread evolution of acoustic communication among fishes (Fish and Mowbray 1970; Ladich et al. 2006).
Fig. 1.
Vocal control system of fish. A: hydrophone recording of natural call series of agonistic “grunts” (top) and vocal nerve recording of the highly synchronous motor volley with increased resolution of a single gruntlike call (bottom) indicating duration, amplitude, and frequency measures. SVOCs, spontaneous vocalizations. B: schematic sagittal view of hindbrain vocal network with single vocal nerve (VN) motor volley (as in A). VMN, vocal motor nucleus; VPN, vocal pacemaker nucleus; VPP, vocal prepacemaker nucleus. C: transverse section showing unilateral fill (brown) of VMN after 10-kDa dextran biotin application to ipsilateral VN (hindbrain level indicated in B); unpublished photomicrograph from prior study (Bass et al. 1994). Camera lucida reconstruction of an intracellular neurobiotin-filled, physiologically identified VMN neuron superimposed on contralateral unlabeled VMN (cresyl violet counterstain). VoTr, vocal tract; MLF, medial longitudinal fasciculi. Scale bar represents 30 μm. D: superimposed traces of 5 VN (top, 1 highlighted in violet) and corresponding intracellular motoneuron (VMN) recordings (bottom, 1 highlighted in red). Inset shows precise temporal alignment of a single motoneuron response and VN spike, highlighting that activation of a single motoneuron entirely predicts the VMN population response as reflected by the VN spike. E: contralateral (Contra) and ipsilateral (Ipsi) VN recordings of entire motor volley (left) and single spike (right, from boxed area). Record was normalized to maximum amplitude spike of respective VN record.
The highly stereotyped VOC of toadfishes directly translates into natural call duration and frequency (Fig. 1A) (Bass and Baker 1990, 1991; Remage-Healey and Bass 2004, 2006; Rubow and Bass 2009). We recently showed that separate hindbrain nuclei (Fig. 1B) determine the duration (vocal prepacemaker) and frequency (vocal pacemaker) of VMN firing, and hence of natural vocalizations (Chagnaud et al. 2011). Prepacemaker neurons exhibit sustained depolarizations that encode duration, whereas pacemaker neuron oscillatory activity directly determines motoneuronal firing frequency and, in turn, natural call frequency or pulse repetition rate. It remains unknown, however, how motoneuron intrinsic and premotoneuronal network properties contribute to VMN's extreme synchrony while ensuring motoneuronal firing only at time points concordant with vocal pacemaker excitatory input. Equally uncertain is whether the extreme synchrony is maintained during the differential recruitment of variably sized motoneurons (Bass et al. 1996). In this report, we show that a novel suite of intrinsic and network motoneuronal properties, namely, low somatodendritic excitability combined with especially dense and robust premotor network excitatory and inhibitory inputs, ensure extremely synchronous motoneuron activation at the excitatory input frequency. These mechanisms make certain an extreme degree of temporal fidelity at a population level that, in this case, directly determines natural call frequency while allowing for size-dependent recruitment that contributes to amplitude modulation of motoneuronal output and, hence, natural calls. We propose a similar complement of intrinsic and network properties adapted for motoneuron synchrony in vocal networks among reptiles, birds, and mammals (see above) also dependent on the rapid temporal modulation of acoustic events.
MATERIALS AND METHODS
Animals.
Midshipman fish have two male reproductive morphs (Brantley and Bass 1994). Nest-building, territorial type I males acoustically court females. Only type I males (n = 43, standard length: 9.7–15.8 cm) were used in this study because of their larger repertoire of agonistic and advertisement calls that mainly differ in duration and degree of amplitude modulation (Bass et al. 1999; Brantley and Bass 1994). Type II males neither build nests nor acoustically court females, but instead steal fertilizations from type I males using sneak and satellite-spawning strategies. Type II males, like females, are only known to make agonistic grunt calls in non-nesting contexts. Animals were hand collected from either nests or offshore trawls and housed in isolation in an environmental control room at 17 ± 2°C on a 14:10-h light-dark cycle. Animal procedures were approved by the Cornell University Institutional Animal Care and Use Committee.
Surgery.
Surgical procedures followed previously described methods (e.g., Bass and Baker 1990; Kittelberger et al. 2006; Weeg et al. 2005). In brief, fish were anesthetized by immersion in 0.025% ethyl p-amino benzoate (Sigma, St. Louis, MO) in artificial seawater before surgery. Bupivacaine (0.01 g/ml; 0.2 ml) was additionally injected every 4 h near the surgical site for local, long-lasting anesthesia/analgesia. A dorsal craniotomy exposed the brain, rostral spinal cord, and ventral occipital nerve roots innervating sonic muscles. Animals were then given an intramuscular injection of pancuronium bromide (0.5 mg/kg body wt; Astra Pharmaceutical Products, Westborough, MA) for immobilization and transferred to an experimental tank. Recirculated, chilled (17 ± 2°C) seawater was pumped across the gills at all times. The experimental tank rested on a vibration isolation table (TMC, Peabody, MA).
Stimulation.
Vocal output was monitored with an extracellular electrode (75-μm diameter, Teflon-coated silver wire with an exposed ball tip 125–200 μm in diameter) placed on an occipital (vocal) nerve root (VN; Fig. 1B). VN recordings were amplified 1,000-fold and bandpass filtered from 300 Hz to 5 kHz with a differential AC amplifier (model 1700; A-M Systems, Carlsborg, WA). Vocal output was evoked by current pulses applied to previously mapped midbrain vocal sites (Bass and Baker 1990; Goodson and Bass 2002; Kittelberger et al. 2006). Electrical stimulation was delivered using insulated tungsten electrodes (impedance: 5 MΩ; A-M Systems). Current pulses were delivered via a constant current source (model 305-B; WPI) driven by a stimulus generator (A310 accupulser; WPI) producing 1–10 transistor-transistor logic (TTL) pulses at 100–300 Hz per pulse train per stimulus trial (standard settings were 5 pulses at 200 Hz). Intertrial intervals were 0.7–1.4 s.
Neurophysiological recordings.
Intracellular electrodes were pulled on a horizontal puller (P97; Sutter Instruments, Novato, CA) and filled with either 5% neurobiotin (Vector Laboratories) in 0.5 M KCOOH (resistance 35–60 MΩ) for intracellular labeling or 2 M KCOOH for physiological analysis. Neuronal signals were amplified 100-fold (Biomedical Engineering, Thornwood, NY) and digitized at a rate of 20 kHz (Digidata 1322A; Axon instruments) using the software pCLAMP 9 (Axon instruments). An external clock (Biomedical Engineering) sending TTL pulses synchronized stimulus delivery and data acquisition. A current step applied to the recording electrode was used to monitor electrode resistance during the search for neurons.
For antidromic stimulation, electrodes were implanted in vocal muscles attached to lateral walls of the swim bladder following a ventromedial incision in the body wall. Bipolar silver wire electrodes, insulated with enamel except at their tips (0.15-mm diameter, separated by 0.3 mm), were inserted into each muscle along the midline prior to where the nerve branches. Electrodes were connected via a constant current source (model 305-B; WPI) to a stimulator that delivered single shocks of square pulses. The body wall was sutured shut and sealed with Vetbond (3M).
Bicuculline injection into vocal motor nucleus.
Micropipettes with diameters of 20–30 μm were fabricated and filled with either 10% bicuculline methiodide (Sigma) in 0.1 M phosphate buffer (PB) or 0.1 M PB alone. The pipette solution was pressure-ejected with a picospritzer (Biomedical Engineering) using a pulse duration of 50 ms at 10 lb/in2. Four midline injections were performed sequentially at different rostrocaudal locations of VMN.
Neurophysiological analysis.
Neuronal data were analyzed using the software IGOR Pro 6 (WaveMetrics), the free software package NeuroMatic (www.neuromatic.thinkrandom.com), and self-written scripts. The pulsatile VOC comprises a series of spikes that directly determine natural vocalization duration and frequency (Rubow and Bass 2009). VOC duration was measured as the duration between the first and last VOC spikes (see Fig. 1A). VOC frequency was the quotient of the number of VOC spikes and total VOC duration (Fig. 1A). VOC spike amplitude, the distance between the peak amplitude of each VOC spike from baseline levels (Fig. 1A), was compared for simultaneous VOC recordings from both sides of the brain (amplitudes were normalized within a single VOC to the maximum peak amplitude). VOC spike frequency and amplitudes were statistically compared using a Pearson's correlation test.
The latency of excitatory postsynaptic potentials (EPSPs) following midbrain stimulation was measured as the difference between onset of stimulation and onset of an EPSP's rising phase.
Sodium channel inactivation experiments used electrodes filled with 100 mM QX314 (Tocris Bioscience) in 2 M KCOOH. After intracellular penetration of motoneurons, a short period of baseline activity was recorded followed by a repetitive positive current injection (400-ms duty cycle for 1–2 min) and then continued recording. Effects were quantified as the ratio of the antidromically evoked action potential's amplitude after and before QX 314 injection, averaged for five stimulus applications. The amplitude of the motoneuronal activity during vocal activity (VOC) was calculated as the distance between the maximum and minimum amplitude of the motoneuronal activity during the evoked VOC.
Motoneuron firing patterns were visualized using a phase-plane plot of the recorded voltage (V) against the difference in voltage over time (dV/dt). The dV/dt trace was smoothed using a Gaussian filter to reduce electrical noise.
Anatomy.
To visualize intracellularly recorded neurons, positive current (4–10 nA) with a duty cycle of 50% at 2–4 Hz was passed through a neurobiotin-filled recording electrode for 3–30 min. After a 2- to 6-h survival, fish were deeply anesthetized (0.025% benzocaine) and perfused with ice-cold teleost Ringer solution with 10 U/ml heparin (Elkins-Sinn, Cherry Hill, NJ), followed by 3.5% paraformaldehyde-0.5% glutaraldehyde in 0.1 M PB. Brains were postfixed (2–12 h) and then stored in 0.1 M PB (pH 7.2). One day before sectioning, brains were cryoprotected overnight in 30% sucrose solution in PB, embedded in gelatin (15%), and sectioned frozen in the transverse plane (120 μm thick) on a sliding microtome. Floating sections were reacted with an ABC kit (Vector Laboratories), mounted on gelatin-coated slides, and counterstained with cresyl violet. Neurobiotin-filled neurons were reconstructed using a camera lucida drawing tube (Leitz) attached to a microscope (Leitz Dialuz) at a magnification of ×400. Drawings were scanned and images were further processed with the software Photoshop 7.0 and CorelDRAW. Photographs of sections were taken using a microscope (Nikon) and a digital camera, and whole images were later processed with Photoshop 7.0. Image stacks of light microscopy pictures were used to generate photographs with high contrast and sharpness using Zerene Stacker (http://zerenesystems.com/stacker/).
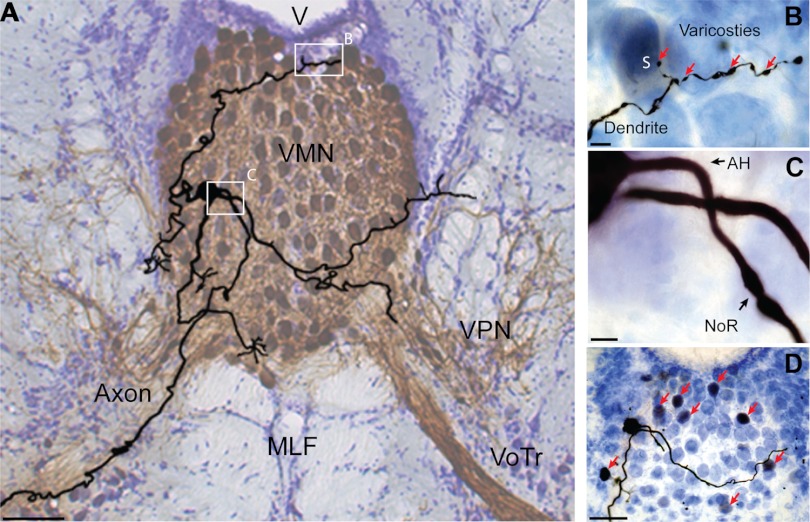
Images of either ipsilaterally labeled VMN (Fig. 1C) or transneuronal, bilaterally labeled hindbrain vocal pacemaker nuclei (VPN)-VMN circuit (Fig. 2A) were from previously unpublished images of an earlier study (Bass et al. 1994).
Fig. 2.
Vocal motoneuron morphology. A: camera lucida reconstruction of vocal motoneuron (VMN) superimposed on background image of bilaterally labeled VMN-VPN circuit (see materials and methods). VMN axon exits nucleus unbranched to then exit brain via vocal occipital nerve root (see VN, Fig. 1B). V, 4th ventricle. B–D: photomicrographs of dendritic varicosities and transneuronally colabeled VMN soma (S) (B), axon hillock (AH) and putative first node of Ranvier (NoR) (C), and somatic region of reconstructed neuron and transneuronal neurobiotin labeling of nearby motoneurons (red arrows) (D). Scale bars represent 100 (A and D) and 10 μm (B and C).
GABA immunohistochemistry.
The hindbrain vocal motor network was transneuronally labeled via biocytin application to a single vocal nerve at the level of the swim bladder (methods directly adopted from Bass et al. 1994). After 4–5 days, animals were deeply anesthetized and perfused as described above except that the fixative was 4% paraformaldehyde- 0.2% glutaraldehyde in PB. Brains were postfixed for 2 h at room temperature before storage in PB at 4°C. Brains were cryoprotected (30% sucrose PB) overnight at 4°C and then sectioned (50 μm, transverse plane) on a freezing microtome and immersed in blocking buffer [10% normal goat serum in 0.01 M PB saline (PBS) with 0.1% Triton X-100] for 4 h at room temperature. After blocking, sections were incubated with 1:50 monoclonal anti-GABA (GABA93) produced and characterized by Holstein et al. (2004) for use in closely related toadfish. All primary and secondary antibody incubation steps were performed overnight at 4°C. After several washes in PBS, sections were preincubated in blocking buffer and then incubated with 4 μg/ml of a fluorescent-tagged goat anti-mouse secondary antibody (IgG-rhodamine red; Molecular Probes). After another series of PBS washes, sections were preincubated in a second blocking buffer (2% BSA and 0.1% gelatin in PBS with 0.1% Triton X-100) and then incubated with 5 μg/ml of a fluorescein-streptavidin conjugate (Vector Laboratories). Sections were washed in PBS, mounted onto gelatin-subbed slides, dried overnight, and coverslipped using a fluorescent mounting medium (Vectashield; Vector Laboratories). Photographs were taken on a fluorescence microscope, and image stacks on a confocal microscope.
Cluster analysis of motor nerve volley.
Twelve different motor nerve volleys were used in a cluster analysis. Recordings were kindly provided by A. Berkowitz from the University of Oklahoma (turtle hip flexor, knee flexor, knee extensor), S. Kishore from Northwestern University (zebrafish, spinal root), G. von Uckermann from Bordeaux University (Xenopus spinal nerve), C. Guschlbauer from University of Cologne (lamprey spinal root), and E. Zornik from the University of Utah (Xenopus glottal and laryngeal nerves). Vocal occipital nerve records from midshipman fish and toadfish were acquired by us as detailed above; sea robin records were available from a previous study (Bass and Baker 1991). A single representative motor volley was analyzed for each available motor nerve volley. Analysis was performed on the waveform of the signal itself [second autocorrelation peak amplitude, signal-to-noise ratio (standard deviation divided by mean), root mean square, average deviation], on the interspike intervals (ISI) of the signals (average, root mean square, average deviation), and on the distribution of the ISI [distribution width (the distance of first and last crossing of 0.2 times maximum peak amplitude), skewness, curtosis, standard deviation]. The ISI was calculated by thresholding the original waves used in the analysis. Threshold was defined as six times the standard deviation of baseline levels for each signal. Analysis was performed with IGOR (WaveMetrics). All of the above-mentioned factors were used in a farthest point clustering analysis, and the individual clusters were displayed as a dendrogram using Python software.
RESULTS
The VOC is readily recorded from the VN (Fig. 1B) and occurs bilaterally in phase so that ipsilateral VOC spike frequency matches contralateral VOC frequency (Bass and Baker 1990, 1991). We also found that ipsilateral VOC spike amplitude was highly predictable of contralateral VOC spike amplitude (Fig. 1E, Pearson's correlation test: P < 0.001, correlation coefficient: 0.98; n = 57 VOC spike pairs from 10 individual VOCs).
In vivo intracellular recordings were made from 151 vocal motoneurons during either spontaneous (sVOCs) or electrically evoked VOCs (eVOCs). On average, sVOCs occurred in about every fifth fish with 1 to 32 sVOCs per fish (11.1 ± 11.7 sVOC/fish; n = 12 fish, 172 sVOCs). Midbrain vocal regions common to fish and tetrapods were electrically stimulated to elicit eVOCs (Goodson and Bass 2002; Kittelberger et al. 2006). Evoked VOCs are consistently evoked with midbrain stimulation once a low-threshold location is found (e.g., Bass and Baker 1990; Kittelberger et al. 2006). We first describe VMN morphology, followed by intrinsic membrane and premotoneuronal network properties that contribute to VMN synchronous firing.
Motoneuron morphology.
Physiologically identified, neurobiotin-filled vocal motoneurons (n = 15) showed a modest dendritic arbor of three to four main branches crossing the midline into the adjacent VMN, with prominent varicosities on their most distal ends (Figs. 1C and 2, A and B). Dendritic trees had a far rostrocaudal extent almost entirely contained within the paired VMN. Axons arose from either a primary dendrite (Fig. 1C, n = 6) or the soma (Fig. 2, A and C, n = 9) and exited the brain via the ipsilateral vocal tract (Figs. 1C and 2A). The axon hillock showed no obvious tapering (Fig. 2C); the putative first node of Ranvier was detected in four cases (Fig. 2C). Neurobiotin colabeling of VMN neurons occurred after single-cell injections, indicative of transneuronal transport via gap junctions (Bass and Marchaterre 1989; Bass et al. 1994). Colabeled neurons were detected bilaterally throughout both VMNs (Fig. 2D, also see colabeled soma in 2B), suggesting dendrodendritic and/or dendrosomatic coupling within and between both VMNs.
Population-level network activity.
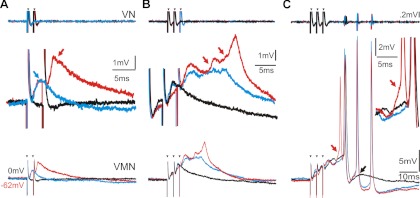
Vocal motoneurons lacked ongoing spontaneous activity, firing exclusively during VOCs. Single axonal recordings from occipital nerve roots during eVOCs exhibited action potential half-widths of 0.83 ± 0.15 ms (n = 10), whereas somatic and dendritic recordings showed significantly broader firing (t-test: P < 0.001), lasting 1.15 ± 0.23 ms (n = 10). After a single midbrain stimulus pulse, motoneurons (16 of 43) showed short-latency (2.71 ± 0.62 ms) EPSPs (Fig. 3A, blue trace and arrow), indicating direct midbrain input. EPSPs showed only weak summation with additional current pulses (Fig. 3A, red trace and arrow). The duration of the depolarization was prolonged with increasing stimulus pulse number and amplitude (Fig. 3B, blue trace), occasionally coinciding with additional superimposed depolarizations that were not temporally matched to the electrical stimuli (Fig. 3B, red arrows). The additional depolarizations suggested polysynaptic EPSPs that likely originated from midbrain activation of vocal pacemaker (VPN) and/or prepacemaker nuclei (VPP; Fig. 1B).
Fig. 3.
Generation of vocal motoneuron activity. A–C: superimposed traces of VN (top) and corresponding color-coded intracellular VMN activity (bottom; shown at increased resolution in middle traces) during electrically evoked vocal response. A: extracellular (black trace) and intracellular VMN activity show similar time delay in responses after 1 (blue trace) and 2 (red trace) consecutive midbrain stimulation pulses (small arrowheads indicate truncated stimulus artifact). Blue and red arrows (middle trace) indicate short-latency excitatory postsynaptic potential (EPSP) and EPSP summation, respectively. B: a third stimulus pulse leads to prolonged EPSP (middle blue trace) that sometimes shows overlapping potentials (red arrows, middle red trace). C: EPSP shown by red arrows in B turns into robust action potential-like response (black trace) matched by VN spike. Increasing stimulus amplitude results in more potentials and temporally matched VN spikes (blue). Smaller amplitude action potentials sometimes precede (red arrow and trace) first potential synchronous with first VN spike.
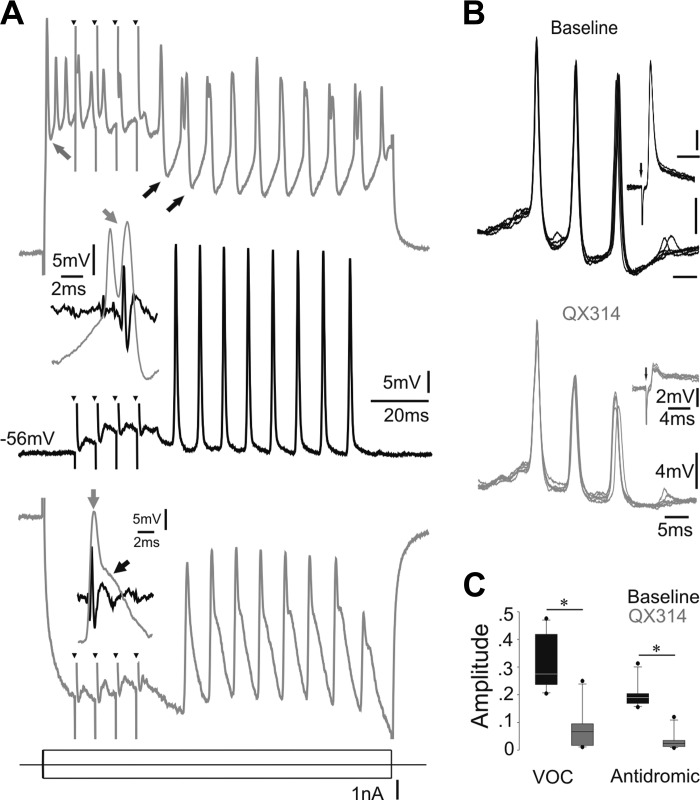
Action potential-like responses were eventually evoked with a time course matching superimposed depolarizations concurrent with eVOC spikes; total eVOC duration increased with the addition of action potential-like responses at the eVOC spike frequency (Fig. 3C, black and blue traces show 1 vs. 3 potentials/ VOC spikes, respectively). We refer to the in vivo recorded activity of an individual motoneuron that was always coincident with each VOC spike as action potential-like because several lines of evidence strongly suggested that this response reflected not only the activity of the recorded neuron but also the combined chemical and electrical coupling components of the VMN population, hereafter referred to as the VMN network component (see below for activity prior to VOCs). First, eVOC-associated motoneuron activity showed small double peaks during depolarizing current injection (Fig. 4A, top trace; middle trace shows response during no injection). Double-peak responses were never found during current injection alone and thus were not an intrinsic feature of motoneuron firing. Peak 1 likely represented the activity of the recorded neuron first firing in response to the combination of depolarizing current injection and synaptic input, whereas peak 2, which was coincident with the eVOC spike, represented the VMN network component (Fig. 4A, inset at middle trace shows magnification of a single response and corresponding vocal nerve activity, gray and black traces, respectively; gray arrow indicates second peak). Hyperpolarizing current injection during eVOCs revealed strong rhythmic activity (Fig. 4A, bottom trace) with a brief, fast-rising component coincident with the eVOC spike (Fig. 4A, inset at bottom trace, gray arrow), followed by a slower decaying component (black arrow).
Fig. 4.
Motoneuronal recordings reflect network activity. A: VMN activity without (middle trace) and with either depolarizing (top trace) or hyperpolarizing (bottom trace) current injection (small black arrowheads indicate stimulus artifact). Gray arrow in top trace indicates weak afterhyperpolarization (AHP) following action potential initiated by intracellular current injection; black arrows indicate strong hyperpolarization during vocal activity. Insets: magnification of a single cycle of rhythmic input to motoneurons (gray traces) together with corresponding VN activity (black traces) during hyperpolarizing (bottom inset; gray and black arrows indicate short, fast-rising and more extended Gaussian-like components, respectively) and depolarizing current injection (middle inset; gray arrow indicates double peaks). B: multiple recordings of a single motoneuron at baseline (black) and after QX314 iontophoresis (gray). Insets show corresponding antidromically evoked action potentials. Small downward arrow indicates stimulus onset. C: box plots of amplitude of motoneuron action potentials during midbrain-evoked vocalizations (VOC) and during antidromic activation via the VN (black, baseline; gray, after QX314 iontophoresis). Y-axis is dimensionless (see materials and methods). Asterisks indicate significant differences.
A second body of evidence for a VMN network component came from a significant four- to fivefold increase in amplitude of the motoneuron afterhyperpolarization (AHP) during eVOCs (Fig. 4A, top trace, paired black arrows) compared with responses induced by positive current injection alone (Fig. 4A, top trace, gray arrow) (n = 6 neurons; average AHP amplitude during eVOCs: −5.07 ± 2.28 mV; average AHP during current injection: −1.19 ± 0.82 mV; Mann-Whitney U-test: P < 0.001). This difference in AHP amplitude, despite similar depolarization levels, indicates an additional (extrinsic) contribution to the activity of the recorded motoneuron.
Further evidence of a network contribution to individual motoneuron responses during VOCs came from early action potentials occasionally generated by the recorded neuron that were not coincident with a VOC spike (Fig. 3C, red trace). Early, smaller amplitude action potentials did not show the characteristic AHP seen during responses coinciding with VOC spikes (Fig. 3C, red trace and inset), further suggesting that the prominent AHP coincident with a VOC spike was induced by the VMN network component. The amplitude of those spikes was significantly lower than the ones correlated with an eVOC spike (n = 8 neurons; average amplitude of uncorrelated spikes: 20.4 ± 7.7 mV; average amplitude of correlated spikes: 26.9 ± 7.6 mV; Mann-Whitney U-test: P < 0.001).
Support for VMN network activity during vocal responses also came from experiments that recorded intracellular motoneuronal activity (n = 11) using electrodes containing the lidocaine derivative QX314 (100 mM in 2 M KCOOH) that intracellularly inactivates voltage-dependent sodium channels (Connors and Prince 1982). After in vivo intracellular QX314 injections, there was a significant decrease in amplitude of motoneuron responses during eVOCs (Fig. 4, B and C) and of antidromic action potentials (Fig. 4B, insets, and C) (Mann-Whitney U-tests: P = 0.001). Amplitude decreased to a similar extent for both sets of responses (Mann-Whitney U-tests: P > 0.624). Despite the decrease in amplitude, motoneurons still displayed rhythmic responses during eVOCs. To control for possible effects due to the current injection alone, we performed control experiments (n = 9) with only KCOOH-filled electrodes and applied current pulses as in the QX314 experiments. No significant effect was detected on the amplitude of either the motoneuronal activity during the eVOC or the antidromic action potential (Mann-Whitney U-test: P = 0.473 and 0.970, respectively).
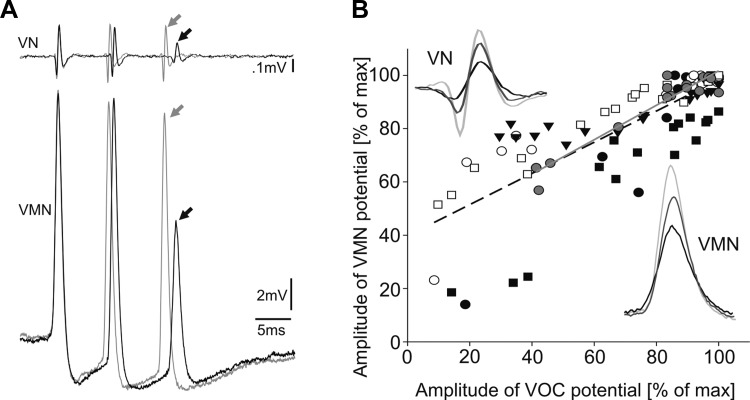
An added indication of a VMN network component came from a positive correlation between motoneuron (n = 6) response amplitude during eVOCs and eVOC spike amplitude (Fig. 5A, black and gray traces and arrows; linear regression in Fig. 5B: y = 0.58x + 39.77, R2 = 0.64, P < 0.001). The variance in eVOC spike amplitude likely represented changes in the extent of coupling across the motoneuron population, as represented by the VMN network component in the recorded neuron's activity.
Fig. 5.
Motoneuron network activity is reflected in membrane potential of single motoneurons. A: VN traces and concurrent VMN activity (matched pairs are coded black and gray) showing variable VN spike amplitude and matching VMN potential amplitude (midbrain-evoked responses). B: linear regression (black dashed line) of relationship between VN spike and VMN potential amplitudes (expressed as %maximum), including data from neuron shown in A (gray-filled circles and gray solid line). Insets show VN spikes and matching VMN responses of varying amplitude (matched pairs are black and grayscale coded; from neuron in A).
Spontaneous vs. midbrain evoked network activity.
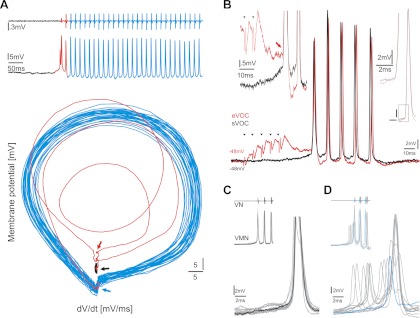
Like eVOCs, sVOCs exhibited initial vocal activity superimposed on a membrane depolarization, whereas subsequent spiking activity was superimposed on a membrane hyperpolarization (Fig. 6A, top traces). A phase-plane plot (Fig. 6A, bottom; color-coded with top trace to show corresponding activity) showed highly sustained oscillatory activity (blue spirals) after the first sVOC spike. At the onset of vocal activity, the membrane potential spiraled out (red spirals) from the baseline resting level (black).
Fig. 6.
Comparison of intracellular vocal motoneuron activity during spontaneous and midbrain electrically evoked vocal motor activity. A: long-duration, spontaneous VN response (top trace) and matching intracellular VMN activity (middle trace: baseline, black; VN onset, red; sustained oscillatory activity, blue). Corresponding phase-plane plot (bottom) of VMN record color-coded to match VN and VMN activity that becomes highly stable within 2 cycles. B: superimposed recordings of same VMN during spontaneous (sVOC; black) and electrically evoked vocalizations (eVOC; red; small black arrowheads indicate stimulus artifact; VN response not shown). Left inset: compared with sVOC (black), the onset of eVOC (red arrow) starts from summated EPSPs and not from baseline levels. Right inset: VMN responses show fast rise time and similar shape between sVOC and eVOC. C and D: onset of sVOC varies across motoneurons. Superimposed traces of 2 neurons during sVOCs showing 1 without (C; response truncated) and 1 with (D) high onset variability. For clarity, a single trace is highlighted in C (black) and D (blue). Insets show corresponding VN and VMN activity at lower resolution.
A comparison between eVOC and sVOC activity recorded from the same neuron revealed no apparent effect of midbrain electrical activation on the overall temporal pattern of activity (Fig. 6B), as reflected in their similar firing frequency (n = 6 neurons, t-test: P = 0.977). As in eVOCs, motoneuron responses showed a fast rise time during sVOCs (Fig. 6B, right inset). Thus midbrain electrical stimulation did not distort natural hindbrain vocal motor activity. One difference in motoneuron activity between eVOCs and sVOCs was attributed to the effects of midbrain electrical activation. The summation of EPSPs during eVOCs was not present in sVOCs (Fig. 6B, left inset), reflecting the different time course and activation of hindbrain motor and premotor populations during eVOCs.
Recordings during sVOCs also provided support for a VMN network component. During sVOCs, the majority of motoneurons (17 of 23) consistently generated responses coincident with the first sVOC spike (Fig. 6C). As with eVOCs (see above), motoneurons (6 of 23) occasionally fired responses before the first one coincident with the first sVOC spike (Fig. 6D), again emphasizing similarities between the two VOC responses. On average, these responses were significantly lower in amplitude than responses coinciding with sVOC spikes (n = 6 neurons; average amplitude of uncorrelated spikes: 11.7 ± 4.2 mV; average amplitude of correlated spikes: 18.5 ± 9.4 mV; Mann-Whitney U-test: P = 0.003). Motoneuron activity preceding a sVOC spike was assumed to originate from EPSPs that reached action potential threshold in the recorded motoneuron but did not reach threshold for a large population of neurons in the VMN network, as evidenced by the missing sVOC spike in the VN record and either a weak or absent AHP in the motoneuron record (Fig. 6D). The apparent changes in potential amplitude in the VMN record while sVOCs were being recorded strongly suggested that the smaller amplitude potentials preceding a sVOC spike (see above) were the recorded motoneuron's action potential, whereas the larger potentials coincident with the sVOC spike reflected the action potential of the recorded neuron and the summation of motoneuron action potentials across the VMN population, i.e., the VMN network component.
As in eVOCS, unsynchronized VMN responses were never observed during sVOCs, i.e., no motoneuron action potentials could be detected between nerve spikes, reflecting the strong coupling of motoneuron activation (synchronicity) during vocalization.
Individual motoneuron responses to current injection.
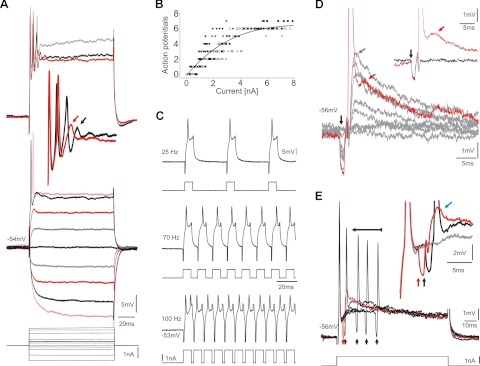
Motoneurons (n = 15) responded phasically with one to seven successive action potentials (Fig. 7A), with most (n = 10) firing less than five, during intracellular injections of variable amplitude current steps (100-ms duration, Fig. 7, A and B). Action potential amplitude always decreased within a series of action potentials (Fig. 7A, top trace and inset). Both amplitude decrease and phasic firing of action potentials suggested motoneurons possessed slowly reactivating depolarizing conductances. To test the assumption that these conductances were a limiting factor determining vocal motoneuron activity (see above), we injected a pulse train of positive current during intracellular recordings (n = 7) (pulse duration 2 ms, 10–230 Hz; higher frequency stimuli were not used due to transients in current injection profile) to rapidly reactivate those conductances. Neurons fired repetitively without any sign of inactivation in response to each current pulse for up to 5 min (Fig. 7C). We concluded that slow reactivation of depolarizing conductances was likely a determinative factor in setting the periodicity of rhythmic motoneuron activity.
Fig. 7.
Intrinsic and network properties reveal electrotonic coupling of vocal motoneurons. A: motoneuron response during current injection at different amplitudes (color-coded for clarity). Inset: increased resolution of top traces showing decreasing amplitude of successive action potentials (arrows indicate lowest detectable one). B: plot of the relationship between injected current and number of action potentials (n = 9 motoneurons). Black line indicates exponential fit. C: activity of a motoneuron during pulse train stimulation at 3 different frequencies, as indicated, together with the corresponding stimulus trains. D: antidromic motoneuron activation from ipsilateral VN shows increasing electrotonic potential amplitude (gray arrow) following increasing stimulation amplitude until action potential is generated. Electrotonic potential persists after action potential firing (red trace and arrow, highlighted in inset). Black arrow indicates antidromic stimulation artifact. E: collision test reveals gap junctional coupling showing that electrotonic potentials are neither intrinsic, nor can they be blocked. Horizontal black arrow indicates gradual shift of antidromically activated action potentials (onset indicated by small vertical arrows) toward intracellular, current-induced action potential. Inset shows increased resolution for 3 different records: current injection alone (gray trace) and current injection and antidromic stimulation with (red trace) and without (black trace) collided action potential. Blue arrow indicates the potential after collision.
Electrical coupling within and between motor nuclei.
Electron microscopy and extensive transneuronal neurobiotin/biocytin transport imply gap junction coupling throughout the paired VMN (Bass and Marchaterre 1989; Bass et al. 1994). Consistent with this, numerous motoneurons were labeled following single intracellular neurobiotin injection (see Fig. 2D). We found physiological evidence of electrical coupling by using antidromic activation via the vocal nerve. With increasing antidromic stimulation amplitude, membrane depolarizations appeared and increased in amplitude, likely originating from electrotonically coupled motoneurons differentially activated during antidromic stimulation (Fig. 7D). Membrane depolarizations increased until an action potential was elicited (Fig. 7D, red trace). The onset of action potential firing coincided with electrical stimulation and thus was not induced by membrane depolarizations reaching action potential threshold. In contrast to eVOC and sVOC activity, antidromically activated motoneurons did not show a distinct AHP after action potential firing, further suggesting a network-dependent activation of the AHP mediating conductance. Electrotonic potentials remained after action potentials fired (Fig. 7D, inset, red arrow). Electrotonic coupling was also found after contralateral antidromic activation in 9 of 10 motoneurons, corroborating the extensive coupling between the paired VMN observed with single-cell labeling.
Electrotonic coupling was further investigated in vivo with collision experiments, a physiological demonstration of gap junctional coupling (Kiehn and Tresch 2002), in which motoneuron action potentials were antidromically activated via the vocal nerve and intracellularly induced with current injection. Electrical coupling was evident in 12 of 13 motoneurons. Antidromically activated action potentials (Fig. 7E, small vertical arrows) were gradually shifted toward the current-induced action potential (Fig. 7E, horizontal arrow) until they disappeared following collision with the intracellularly generated action potential (Fig. 7E, red trace; expanded in inset).
Inhibitory input to vocal motoneurons.
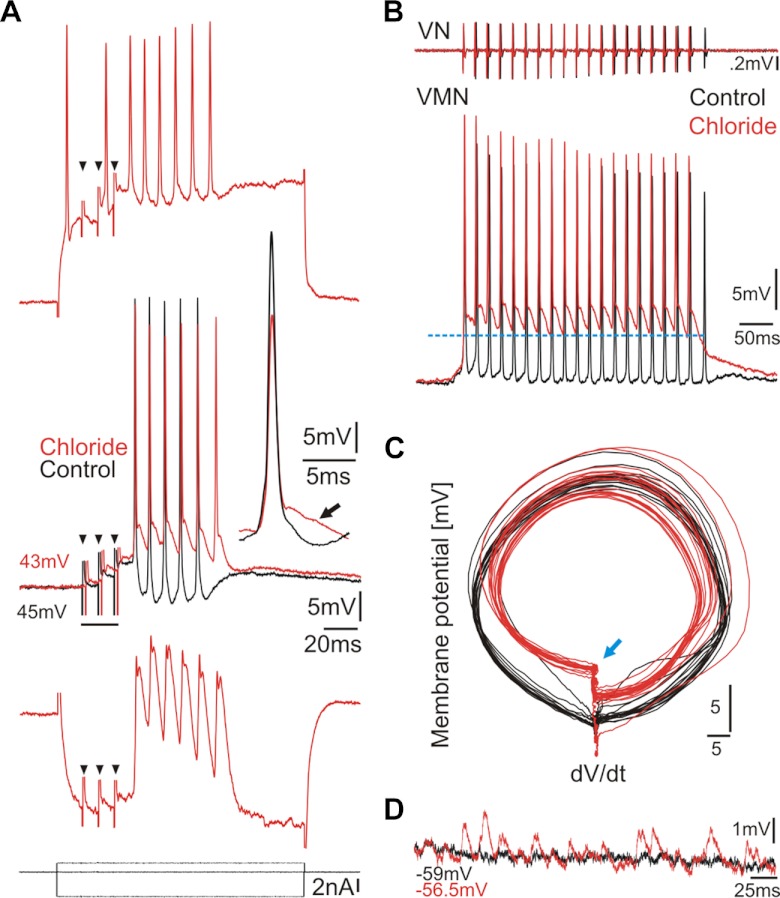
Inhibitory input contributes to simultaneous firing of neuronal populations (Gauck and Jaeger 2000; van Vreeswijk et al. 1994). To test the hypothesis that vocal motoneurons receive inhibitory input, we recorded from motoneurons using 3 M KCl-filled electrodes (n = 14). After control recordings, Cl− ions were injected intracellularly by applying negative current to the recording electrode; the resting membrane potential became slightly depolarized (2–6 mV), indicative of tonic inhibitory input. Prominent depolarizing potentials appeared after Cl− injection during either eVOCs (Fig. 8A, red middle trace; black trace is baseline; eVOCs not shown) or sVOCs (Fig. 8B, red trace; black trace is baseline) that could be inverted by positive current injection (Fig. 8A, top trace). Hyperpolarizing current injection following Cl− injections revealed double-peaked responses (Fig. 8A, bottom trace). No change in motoneuron firing frequency was detected after Cl− injections (n = 10 neurons: paired t-test: P = 0.24). A phase-plane plot revealed that motoneuron oscillatory activity remained highly stable after Cl− injection (Fig. 8C) despite the change in repolarizing levels during vocal activity (blue arrow). Prominent depolarizations, present at rest only after Cl− injection, revealed ongoing inhibitory input (Fig. 8D).
Fig. 8.
Inhibitory input to VMN during evoked and spontaneous vocal responses. A: intracellular injection of Cl− ions (middle red trace) reveals inhibitory activity compared with control (middle black trace) activity during midbrain electrically evoked response (eVOC; vocal nerve records not shown; small black arrowheads indicate stimulus artifact). Depolarizing (top) and hyperpolarizing (bottom) current injection after Cl− injection is shown. Middle inset shows single responses at baseline and after Cl− injection. Note difference in repolarization (black arrow). B: spontaneous VN and VMN activity during baseline control (black) and after Cl− injection (red). Baseline of motoneuron resting potential was subtracted in both conditions. C: phase-plane plot of motoneuron activity shown in B. Blue arrow indicates depolarization level shown by blue dashed line in B. dV/dt, change in voltage over time. D: comparison of membrane potential of neuron in B during control (black) and after Cl− injection (red) reveals membrane depolarizations not present before Cl− injection.
Inhibitory input is crucial for motoneuron activity.
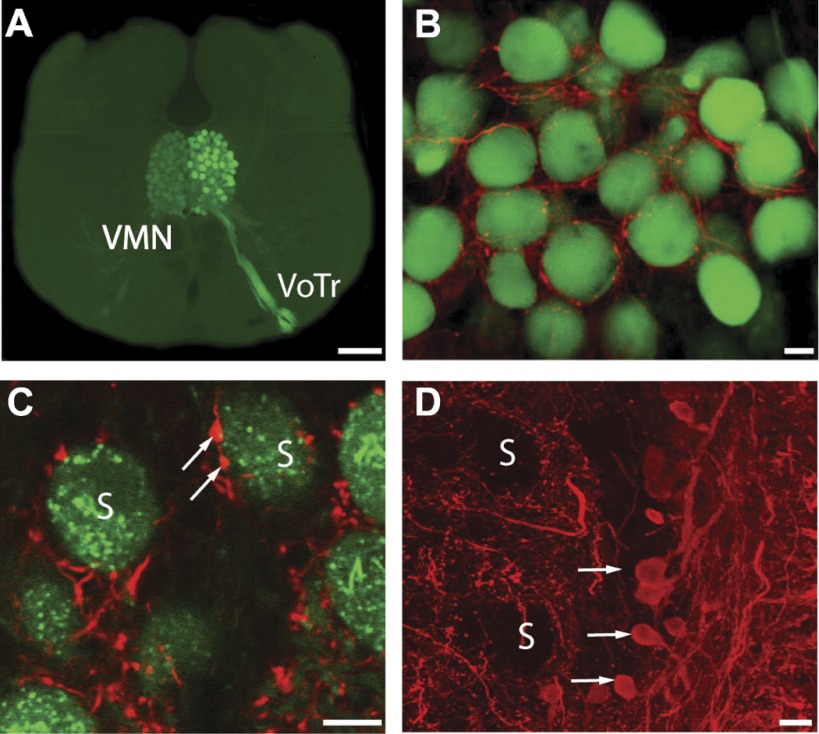
Supporting inhibitory input to VMN (see above), biocytin labeling of the motor nucleus via bulk labeling of the vocal nerve (Fig. 9A) coupled with immunocytochemistry demonstrated prominent GABAergic innervation throughout the motor nucleus (Fig. 9, B and C), likely originating from small neurons located around VMN margins (Fig. 9D).
Fig. 9.
Immunocytochemistry shows extensive GABAergic input to VMN. A: photomicrograph of transverse hindbrain section showing bilaterally labeled VMN (green) after biocytin application to VN. Vocal tract and VMN are heavily filled ipsilateral to nerve label, compared with contralateral transneuronally labeled VMN. B and C: same as A but with GABA antibody (red). White arrows in C indicate synaptic boutons apposing motoneuron somata (S). D: GABAergic neurons (white arrows) located next to VMN (unstained VMN somata indicated). Scale bars represent 200 (A) and 20 μm (B–D).
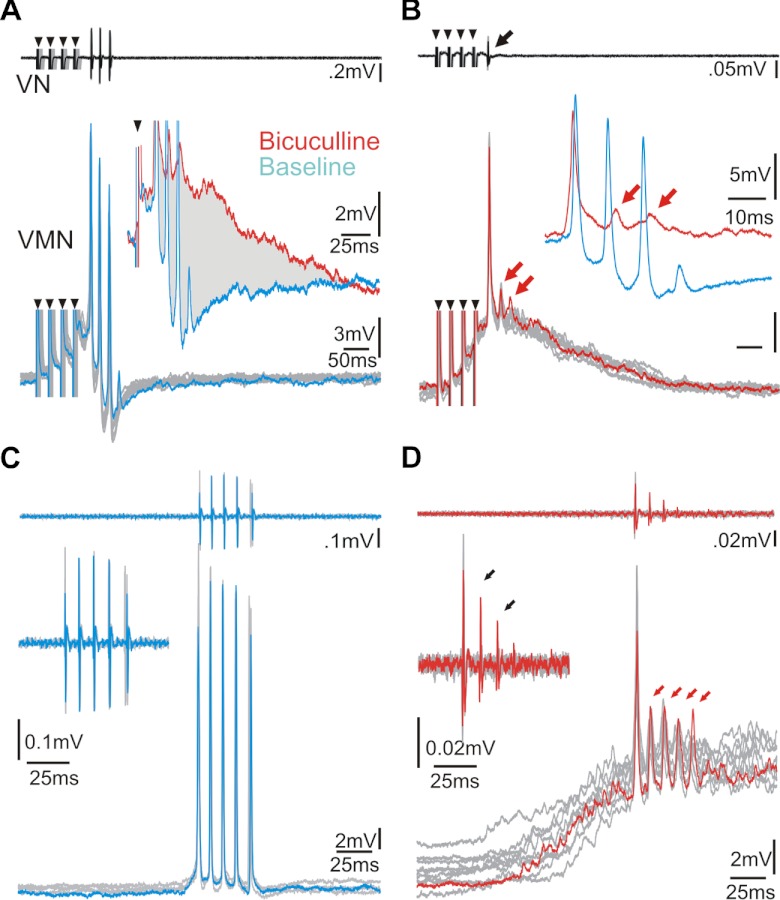
To further understand how inhibitory input contributes to motoneuron activity, we injected the GABAA receptor antagonist bicuculline in vivo at four positions along the rostrocaudal extent of VMN (see materials and methods). Baseline eVOCs were reduced to one low-amplitude spike following bicuculline injections (Fig. 10, A and B, top traces, respectively). Corresponding intracellular records (n = 5) showed equally reduced activity (Fig. 10, A and B) and a tonic depolarization with a phasic component of smaller rapid membrane potentials at the eVOC frequency (insets in Fig. 10, A and B, show superimposed baseline and postbicuculline responses on different timescales to allow better visualization of smaller potentials after bicuculline injections). Compared with baseline responses (Fig. 10C), bicuculline injections during sVOCs increased the rise time of the onset depolarization (Fig. 10D). Bicuculline did not always completely truncate sVOCs to one spike, although any additional VOC spikes had much lower amplitudes than the first (Fig. 10D, inset), likely reflecting decreased motoneuron recruitment (see below). As in eVOCs, a persistent depolarization coupled with a phasic component of smaller rapid membrane potentials at the sVOC frequency could be detected (Fig. 10D, red arrows). The sustained depolarization likely originated from feedforward vocal midbrain (e.g., see Fig. 3A) and duration-setting VPP excitation and the phasic depolarization from frequency-setting pacemaker neurons (Chagnaud et al. 2011).
Fig. 10.
GABAergic input to VMN is crucial for vocal activity. A and B: superimposed traces of VN (top) and VMN activity (bottom) during eVOC before (A; blue) and after (B; red) extracellular bicuculline injection into VMN (small black arrowheads indicate stimulus artifact). Inset in A shows higher magnification of single baseline and bicuculline injected records (responses truncated). Note the lack of repolarization after bicuculline injection highlighted by gray shading. Inset in B shows inset in A on expanded timescale but reduced amplitude scale displaying 2 EPSPs (red trace and arrows) riding on top of a membrane depolarization. C and D: same as A and B but for sVOC. Red arrows indicate membrane depolarizations at the sVOC frequency riding on top of membrane depolarization. Insets in C and D show increased resolution of VN record, and black arrows in D indicate the decreasing VOC spike amplitudes recorded from the VN.
Differential motoneuron recruitment does not affect network synchrony.
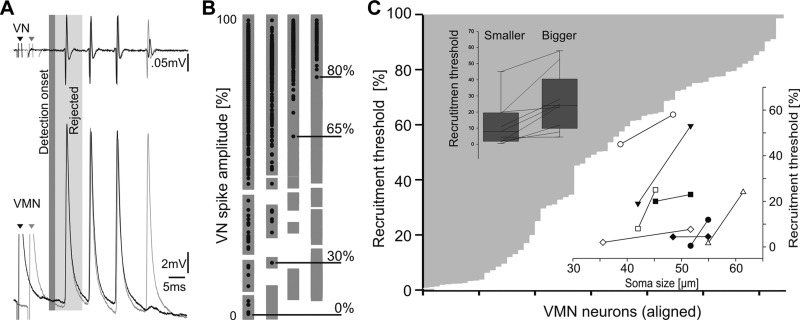
Motoneurons differ in size across the VMN (Bass et al. 1996). To test the potential effect of differential recruitment of variably sized motoneurons on the stability and periodicity of motoneuron firing, we recorded from single motoneuron axons in one of the vocal occipital nerve roots as they exit the hindbrain. Unlike intracellular recordings from motoneuron somata and dendrites, axon activity does not reflect the potentially confounding effects of the VMN network on the contribution of individual motoneurons to the VOC spike amplitude. Motoneuron recruitment threshold was operationally defined as the lowest amplitude eVOC spike coinciding with an intracellularly recorded response (Fig. 11A). Because eVOC onset is influenced by electrical activation (Fig. 6B), the first eVOC spike and motoneuron potential were not included in the analysis (Fig. 11A).
Fig. 11.
VN spike amplitude depends on differential VMN recruitment. A: schematic of analysis method shows 2 VN and corresponding intracellularly recorded VMN axonal records (matched pairs coded black and gray; small arrowheads indicate stimulus artifact). Gray shading indicates rejection of first VN spike/motoneuron potential due to possible artifacts (see results). B: examples of 4 differentially recruited motoneurons. VN spike amplitude (distance between baseline and positive peak amplitude) is normalized to maximum (100%) spike amplitude. Gray boxes indicate occurrence of VN spike; black circles represent time of occurrence of VMN spiking during VN activity. Motoneuron recruitment threshold, indicated by horizontal black line, was lowest VN spike amplitude with temporally matched motoneuron spiking. C: inverted bar graph showing distribution of recruitment threshold for all motoneurons studied (n = 64; aligned by increasing threshold). Inset at top left shows distribution of recruitment threshold categorized by size (smaller vs. bigger in 1 given pair) and corresponding pairs of motoneurons (black lines), whereas inset at bottom right shows relationship between soma size (cross-sectional diameter) and recruitment threshold for the same 8 pairs of neurons (pairs indicated by different symbols).
Although recruitment threshold varied widely across the sampled population (n = 64) (Fig. 11, B and C), each motoneuron reliably contributed to the eVOC once the eVOC spike amplitude exceeded the neuron's recruitment threshold (Fig. 11B; VOC spike amplitude normalized to 100%). Motoneurons were always recruited at the eVOC frequency with no apparent effect on the degree of synchrony (Fig. 11, A and B).
Because motoneurons continued to contribute to the VOC response once their recruitment threshold was reached, we anticipated that they were recruited in accordance with the size principle, namely, that smaller ones are recruited before larger ones (Henneman and Mendell 1981). In 12 fish, motoneuron somata were retrogradely labeled via neurobiotin injection into physiologically characterized axons. Taking advantage of the strictly ipsilateral trajectory of motoneuron axons (see Fig. 2A), we performed a single neurobiotin injection on each side of the brain, with one neuron successfully labeled on each side in eight fish. Motoneuron size was then compared with recruitment threshold for these eight pairs of neurons. Consistent with the size principle, there was a significant positive correlation between neuron size (cross-sectional diameter) and recruitment threshold, i.e., soma size increased with increasing motoneuron recruitment threshold (Pearson's correlation test: P = 0.0106, correlation coefficient: 0.831) (Fig. 11C, insets).
DISCUSSION
We have shown that a suite of premotor network and intrinsic motoneuronal properties ensures ongoing, high-fidelity transfer of afferent temporal information to an entire target population, in this case paired hindbrain motor nuclei dedicated to producing rapid modulations in acoustic behavior. Whereas pacemaker input provides a high-frequency timing signal that synchronizes electrotonic and inhibitory-dependent network level activity, intrinsic motoneuronal properties (low somatodendritic excitability, repolarizing conductance, membrane hyperpolarization) translate this temporal code into a highly synchronous, but variable amplitude, output code.
Intrinsic and network properties.
Motoneuronal membrane hyperpolarization during vocal nerve activity (VOC) revealed strong rhythmic activity likely originating from premotor vocal pacemaker neurons that densely innervate VMN with chemical and electrotonic synapses (Bass and Baker 1990; Chagnaud et al. 2011). We propose that the motoneurons studied have two essential sets of active conductances with opposite effects. In the absence of vocal network activity, a slow-reactivating depolarizing conductance would account for the observed rapid decrease in action potential amplitude upon intracellular current injection (see Fig. 7A, inset). Upon network activation, a voltage-dependent repolarizing conductance is suggested by the prominent AHP coincident with vocal output, i.e., the VOC spikes (see Fig. 3C). The slow reactivation of the depolarizing conductance would essentially render the motoneuron inexcitable to sustained input, preventing spontaneous action potentials along with misfiring during vocal activity. Hence, the bilateral VMN population only fires at a time determined by the excitatory vocal pacemaker input (Chagnaud et al. 2011). The large repolarizing conductance allows for reactivation of the depolarizing conductance, but only during network activity. Sustained motoneuron activity would then depend on the repetitive reactivation of these conductances at fixed intervals.
Several experiments support the dependency of highly stable, large-amplitude motoneuron responses during VOCs on VMN network activity. Current injection into single motoneurons led to action potentials/responses with AHPs much smaller in amplitude than those during VOCs. Responses occurring before VOCs were smaller in amplitude than those coincident with VOC spikes and did not show the characteristic AHP. Intracellular injection of the lidocaine derivative QX 314 significantly reduced the amplitude of, but could not abolish, rhythmic depolarizing activity, whereas motoneuron response amplitude directly correlated with eVOC spike amplitude. Further evidence of a VMN network component came from membrane potential modulations during variable levels of vocal output (Fig. 5). The extent of synchronous activation throughout VMN seen in the network component, measured by VOC spike amplitude, leads to predictable changes in the membrane potential of single motoneurons. Passive current spread throughout individual neurons is likely facilitated by the prominent size of motoneuron somata and dendrites (for quantitative measurements see Bass and Baker 1990; Bass et al. 1996).
Electrotonic coupling, known to increase the level of synchrony in neural networks (Velazquez and Carlen 2000), including motor circuitry (Zhang et al. 2009), could contribute to the extent of VMN network activity and, in turn, magnitude of the VMN response. Collision tests of intracellularly evoked action potentials with antidromic activation from the vocal nerve revealed large membrane depolarizations indicative of a functional motoneuronal connectivity. This unequivocal demonstration of electrotonic coupling complements the anatomic evidence of gap junctions throughout VMN (Bass and Marchaterre 1989; Bass et al. 1994).
Selective inactivation of gap junctional coupling in VMN is not feasible in the in vivo preparation we studied because of extensive electrotonic coupling within and between vocal central pattern generator (CPG) nuclei (VPP-VPN-VMN). Consequently, we did not experimentally demonstrate the functional role of electrotonic coupling in VMN. We hypothesize, however, that electrotonic spread of the VMN network component has a major role in generating extreme population-level motoneuron synchrony as displayed in the VOC. Electrotonic coupling throughout the paired motor nuclei is best illustrated physiologically by distinguishing a single motoneuron's action potential from the network component (see Fig. 4) and membrane potential modulations during variable activity of the vocal network (see Fig. 5). The extent of VMN network synchrony, measured by VOC spike amplitude, leads to predictable changes in the membrane potential of single motoneurons (Fig. 5), likely mediated by passive current spread, that is facilitated by the prominent size of motoneuron somata and dendrites. Measures of coupling coefficients between motoneurons necessitate future in vitro recordings from pairs of motoneurons.
Dense GABAergic input to VMN, putatively from small neurons surrounding VMN (see Fig. 9D), likely serves two functions. First, it synchronizes VMN population activity, a feature well established for other synchronously firing neuronal networks (Bartos et al. 2007; van Vreeswijk et al. 1994; Wang and Buzsáki 1996). Second, it contributes to rapid motoneuron repolarization (see Fig. 10) that, along with a slow-reactivating conductance, prevents tonic firing (see above) and therefore maintains population-level motoneuron activity at the pacemaker frequency. Blocking GABAA receptors in VMN with bicuculline resulted in fewer motoneuronal and VOC spikes with remaining VOC spikes having decreased amplitude. GABAergic input is therefore likely crucial to repolarization of the motoneuron's membrane potential and, thereby, maintenance of network level activity. It is not yet known whether the firing patterns of the inhibitory neurons are phasic or tonic with respect to the pacemaker frequency.
There was no apparent disruption of ongoing oscillatory frequency during either intracellular chloride or VMN bicuculline injection (Figs. 8 and 10), implying that inhibitory input does not play a role in setting firing frequency, which would then be controlled by excitatory pacemaker inputs alone (Bass and Baker 1990; Chagnaud et al. 2011). Inhibition's major role, then, is to ensure that the large synchronous pacemaker depolarization is completely shunted throughout the soma/dendritic compartment, a mechanism that appears to be essential to continued motoneuron activity.
Differential recruitment does not affect synchronous firing.
Vocal motoneuron size varies in midshipman fish (Bass et al. 1996). The size principle predicts that smaller motoneurons with higher input resistance tend to depolarize more for comparable excitatory synaptic currents, and thus fire earlier, than larger ones with lower resistance (Henneman and Mendell 1981). Individual motoneurons were differentially recruited (Fig. 11); smaller neurons reliably contributed to VOC amplitude before larger ones, leading to a net increase in the number of active neurons and VOC amplitude. Motoneuron activity remained highly synchronous and temporally stable during recruitment because of all the aforementioned intrinsic and network features.
Both the sVOC and eVOC are reliable representations of natural vocalizations in the time domain and exhibit varying degrees of amplitude modulation (AM) like that of natural calls (e.g., Fig. 1A) (Rubow and Bass 2009). Whereas intrinsic and network properties ensure a reliable encoding of pacemaker frequency by the entire VMN population, motoneuron recruitment likely plays a determinative role in natural call AM.
Rapid temporal modulation of acoustic signals.
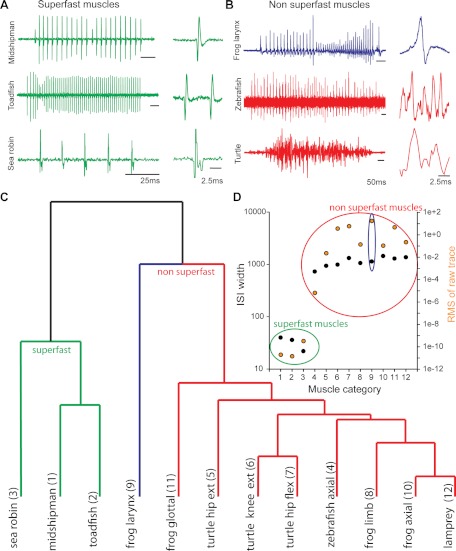
Superfast muscles, unlike other skeletal muscles used for locomotion, are adapted for speed rather than force generation (Rome 2006). For acoustic signaling, speed translates into rapid temporal modulation, whether determining the rate of amplitude modulation of a fish grunt (e.g., Fig. 1A) and songbird syllable (Elemans et al. 2008), the interpulse interval of the terminal buzz of an echolocating bat (Elemans et al. 2011), or the rattling frequency of a rattlesnake tailshaker (Schaeffer et al. 1996). Vocal fish motor volleys reflect highly stable, synchronous motoneuron output, as shown in Fig. 12A for the closely related plainfin midshipman (focus of current study), Gulf toadfish, Opsanus beta (same order, Batrachoidiformes) (Nelson 2006), and the distantly related sea robin, Prionotus carolinus (Scorpaeniformes) (Nelson 2006). Extreme motoneuronal synchrony leads to synchronous activation of muscle fibers across the entire sonic/vocal muscle (Gainer and Klancher 1965; Skoglund 1961). Unfortunately, there are no nerve records available for other known superfast muscles, namely, those of the rattlesnake tailshaker and bat larynx. However, the spike-like electromyographic records of tailshaker (Schaeffer et al. 1996) and bat laryngeal muscles (Durrant 1988) mimic the spike-like vocal nerve records of fish (although lower in frequency) and thus strongly suggest a high degree of motoneuron synchrony.
Fig. 12.
Superfast muscle motor command signals (nerve volley) differ from nonsuperfast commands. A and B: motor volley (left, representative motor volley; right, 10-ms excerpt highlighting signal waveform) of superfast vocal muscles (A; midshipman, toadfish, and sea robin) and nonsuperfast muscles (B; frog laryngeal, zebrafish, and turtle) used in the farthest point clustering analysis. C: dendrogram showing the clustering of motor signals into 2 main groups showing clear separation between command signals to superfast muscles (green) and to nonsuperfast muscles (red). The frog laryngeal motor volley (indicated in blue) groups within the nonsuperfast muscles but is distinctly separated from other muscles, reflecting its intermediate character state (also see B). D: shown are 2 of 10 factors used in the cluster analysis (see materials and methods), interspike interval (ISI) width (left y-axis; black filled circles) and root mean square (RMS) of the signal (right y-axis; orange filled circles). Green (superfast muscles) and red (nonsuperfast muscles) circles indicate the 2 classes found in the clustering analysis. Blue circle indicates the frog laryngeal muscle within the nonsuperfast class. X-axis represents the motor volleys used in the cluster analysis shown in C.
Like vocal fish, laryngeal nerve activity in Xenopus laevis, a fully aquatic anuran amphibian, exhibits a temporally stable pulsatile motor volley (Fig. 12B, top record) coupled one to one with spike-like electromyographic records and individual sound pulses (Schmidt 1976; Yamaguchi and Kelley 2000; Zornik et al. 2010). Anurans differ, however, from vocal fish and the superfast acoustic systems of bats and rattlesnakes in that motor activity is only in the beta-gamma range, and so they likely do not have superfast vocal muscles.
Nerve recordings of motor volleys to nonsuperfast muscles used in locomotion, e.g., zebrafish axial and turtle knee flexor muscles (Fig. 12B, middle and bottom records), show low temporal coincidence, reflecting the noncoincident recruitment of motor units (Berkowitz 2008; McLean et al. 2007).
A farthest point cluster analysis, displayed as a dendrogram (Fig. 12C), compares the vocal nerve volleys for both superfast and nonsuperfast systems by taking into account multiple measures of the waveform of the signal itself (see records at far right, Fig. 12, A and B) and ISIs of the motor volley (see materials and methods). Superfast vocal motor volleys fell within a category (Fig. 12C) separate from those of muscles used in either locomotion or vocal behavior (i.e., anurans) that are not known to contract at high-gamma range frequencies (nonsuperfast, Fig. 12C; also see 12B). Anuran laryngeal records occupied an intermediate position but were more closely related to nonsuperfast muscles (Fig. 12C), as further evidenced in plots of individual factors contributing to the cluster analysis (Fig. 12D).
Together, the available data suggest that motoneuron synchrony is a prerequisite for precise temporal modulation of acoustic signals in either the high-gamma (e.g., vocal fish, rattlesnakes, bats) or beta-gamma (e.g., frogs) frequency range. Premotor pacemaker neurons, like those in vocal fish (Bass and Baker 1990; Chagnaud et al. 2011), establish the high-gamma range of motoneuron firing coadapted with the rapid contractile properties of superfast sonic muscles. Motoneuronal intrinsic and network properties like those distinguished in this study for vocal fish are, however, likely typical of any motor system where there is intense selection for precise temporal modulation of behavioral events, exemplified by acoustic communication signals.
GRANTS
This research was supported by National Institutes of Health Grants DC00092 (to A. H. Bass), NS13742 (to R. Baker), and National Research Service Award 5F32 DC007792 (to M. C. Zee) and National Science Foundation Grant IOS 1120925 (to A. H. Bass).
DISCLOSURES
No conflicts of interest, financial or otherwise, are declared by the authors.
AUTHOR CONTRIBUTIONS
Author contributions: B.P.C., M.C.Z., R.B., and A.H.B. conception and design of research; B.P.C. performed experiments; B.P.C., M.C.Z., R.B., and A.H.B. analyzed data; B.P.C., R.B., and A.H.B. interpreted results of experiments; B.P.C., R.B., and A.H.B. prepared figures; B.P.C. and A.H.B. drafted manuscript; B.P.C., M.C.Z., R.B., and A.H.B. edited and revised manuscript; B.P.C., M.C.Z., R.B., and A.H.B. approved final version of manuscript.
ACKNOWLEDGMENTS
We thank B. Johnson, M. Negrello, and A. Pastor for comments on an earlier version of the manuscript, T. Jennings for help with data analysis, J. Fetcho for helpful discussions and use of the confocal microscope, G. Holstein for the GABA antibody, and R. Suthers for literature recommendations. We are grateful for the data provided by A. Berkowitz, S. Kishore, G. von Uckermann, C. Guschlbauer, and E. Zornik that appears in Fig. 12.
Present address of M. C. Zee: Program in Behavioral Neuroscience, Northeastern University, Boston, MA 02115. Financial Disclosure:
REFERENCES
- Appelt D, Shen V, Franzini-Armstrong C. Quantitation of Ca ATPase, feet and mitochondria in super fast muscle fibers from the toadfish, Opsanus tau. J Muscle Res Cell Motil 12: 543–552, 1991 [DOI] [PubMed] [Google Scholar]
- Averbeck BB, Lee D. Coding and transmission of information by neural ensembles. Trends Neurosci 27: 225–230, 2004 [DOI] [PubMed] [Google Scholar]
- Axmacher N, Mormann F, Fernández G, Elger CE, Fell J. Memory formation by neuronal synchronization. Brain Res Rev 52: 170–182, 2006 [DOI] [PubMed] [Google Scholar]
- Baker SN, Kilner JM, Pinches EM, Lemon RN. The role of synchrony and oscillations in the motor output. Exp Brain Res 128: 109–117, 1999 [DOI] [PubMed] [Google Scholar]
- Bartos M, Vida I, Jonas P. Synaptic mechanisms of synchronized gamma oscillations in inhibitory interneuron networks. Nat Rev Neurosci 8: 45–56, 2007 [DOI] [PubMed] [Google Scholar]
- Bass AH. Sonic motor pathways in teleost fishes: a comparative HRP study. Brain Behav Evol 27: 115–131, 1985 [DOI] [PubMed] [Google Scholar]
- Bass AH, Andersen K. Intra- and intersexual dimorphisms in the sound generating motor system in a vocalizing fish: motor axon number and size. Brain Behav Evol 37: 204–214, 1991 [DOI] [PubMed] [Google Scholar]
- Bass AH, Baker R. Evolution of homologous traits. Brain Behav Evol 38: 240–254, 1991 [DOI] [PubMed] [Google Scholar]
- Bass AH, Baker R. Sexual dimorphisms in the vocal control system of a teleost fish: morphology of physiologically identified neurons. J Neurobiol 21: 1155–1168, 1990 [DOI] [PubMed] [Google Scholar]
- Bass AH, Bodnar DA, Marchaterre MA. Complementary explanations for existing phenotypes in an acoustic communication system. In: Neural Mechanisms of Communication, edited by Hauser M, Konishi M. Cambridge: MIT Press, 1999, p. 493–514 [Google Scholar]
- Bass AH, Gilland EH, Baker R. Evolutionary origins for social vocalization in a vertebrate hindbrain-spinal compartment. Science 321: 417–421, 2008 [DOI] [PMC free article] [PubMed] [Google Scholar]
- Bass AH, Horvath BJ, Brothers EB. Nonsequential developmental trajectories lead to dimorphic vocal circuitry for males with alternative reproductive tactics. J Neurobiol 30: 493–504, 1996 [DOI] [PubMed] [Google Scholar]
- Bass AH, Marchaterre MA. Sound-generating (sonic) motor system in a teleost fish Porichthys notatus: sexual polymorphisms and general synaptology of sonic motor nucleus. J Comp Neurol 286: 154–169, 1989 [DOI] [PubMed] [Google Scholar]
- Bass AH, Marchaterre MA, Baker R. Vocal-acoustic pathways in a teleost fish. J Neurosci 14: 4025–4039, 1994 [DOI] [PMC free article] [PubMed] [Google Scholar]
- Bass AH, McKibben JR. Neural mechanisms and behaviors for acoustic communication in teleost fish. Prog Neurobiol 69: 1–26, 2003 [DOI] [PubMed] [Google Scholar]
- Berkowitz A. Physiology and morphology of shared and specialized spinal interneurons for locomotion and scratching. J Neurophysiol 99: 2887–2901, 2008 [DOI] [PubMed] [Google Scholar]
- Brantley RK, Bass AH. Alternative male spawning tactics and acoustic signals in the plainfin midshipman fish, Porichthys notatus (Teleostei, Batrachoididae). Ethology 96: 213–232, 1994 [Google Scholar]
- Chagnaud BP, Baker R, Bass AH. Vocalization frequency and duration are coded in separate hindbrain nuclei. Nat Commun 2: 346: 1–11, 2011 [DOI] [PMC free article] [PubMed] [Google Scholar]
- Cohen MJ, Winn HE. Electrophysiological observations on hearing and sound production in the fish, Porichthys notatus. J Exp Zool 165: 355–369, 1967 [DOI] [PubMed] [Google Scholar]
- Connors BW, Prince DA. Effects of local anesthetic QX-314 on the membrane properties of hippocampal pyramidal neurons. J Pharmacol Exp Ther 220: 476–481, 1982 [PubMed] [Google Scholar]
- Durrant GE. Laryngeal Control of the Duration and Frequency of Emitted Sonar Pulses in the Echolocating Bat, Eptesicus fucus (PhD thesis). Bloomington, IN: Indiana University, 1988 [Google Scholar]
- Elemans CPH, Mead AF, Jakobsen L, Ratcliffe JM. Superfast muscles set maximum call rate in echolocating bats. Science 333: 1885–1888, 2011 [DOI] [PubMed] [Google Scholar]
- Elemans CPH, Mead AF, Rome LC, Goller F. Superfast vocal muscles control song production in songbirds. PLoS One 3: e2581, 2008 [DOI] [PMC free article] [PubMed] [Google Scholar]
- Elemans CP, Spierts IL, Muller UK, van Leuven JL, Goller F. Bird song: superfast muscles control dove's trill. Nature 431: 146, 2004 [DOI] [PubMed] [Google Scholar]
- Fawcett DW, Revel JP. The sarcoplasmic reticulum of a fast-acting fish muscle. J Biophys Biochem Cytol 10, Suppl: 89–109, 1961 [DOI] [PMC free article] [PubMed] [Google Scholar]
- Fine M, Economos D, Radtke R, McClung J. Ontogeny and sexual dimorphism of motor nucleus in the oyster toadfish. J Comp Neurol 255: 105–110, 1984 [DOI] [PubMed] [Google Scholar]
- Fish MP, Mowbray WH. Sounds of Western North Atlantic Fishes. Baltimore, MD: Johns Hopkins University Press, 1970 [Google Scholar]
- Gainer H, Klancher JE. Neuromuscular junctions in a fast-contracting fish muscle. Comp Biochem Physiol 15: 159–165, 1965 [DOI] [PubMed] [Google Scholar]
- Gauck V, Jaeger D. The control of rate and timing of spikes in the deep cerebellar nuclei by inhibition. J Neurosci 20: 3006–3016, 2000 [DOI] [PMC free article] [PubMed] [Google Scholar]
- Goodson JL, Bass AH. Vocal-acoustic circuitry and descending vocal pathways in teleost fish: convergence with terrestrial vertebrates reveals conserved traits. J Comp Neurol 448: 298–322, 2002 [DOI] [PubMed] [Google Scholar]
- Henneman E, Mendell LM. Functional organization of motoneuron pool and its inputs. In: Handbook of Physiology. The Nervous System. Motor Control. Bethesda, MD: Am. Physiol. Soc., 1981, sect. 1, vol. II, p. 423–507 [Google Scholar]
- Holstein GR, Martinelli GP, Boyle R, Rabbitt RD, Highstein SM. Ultrastructural observations of efferent terminals in the crista ampullaris of the toadfish, Opsanus tau. Exp Brain Res 155: 265–273, 2004 [DOI] [PubMed] [Google Scholar]
- Jia X, Kohn A. Gamma rhythms in the brain. PLoS Biol 9: e1001045, 2011 [DOI] [PMC free article] [PubMed] [Google Scholar]
- Kiehn O, Tresch MC. Gap junctions and motor behavior. Trends Neurosci 25: 108–115, 2002 [DOI] [PubMed] [Google Scholar]
- Kittelberger JM, Land BR, Bass AH. Midbrain periaqueductal gray and vocal patterning in a teleost fish. J Neurophysiol 96: 71–85, 2006 [DOI] [PubMed] [Google Scholar]
- Ladich F, Collin S, Moller P, Kapoor BG. Communication in Fishes. Enfield, NH: Science, 2006 [Google Scholar]
- McLean DL, Fan J, Higashijima Si Hale ME, Fetcho JR. A topographic map of recruitment in spinal cord. Nature 446: 71–75, 2007 [DOI] [PubMed] [Google Scholar]
- Nelson JS. Fishes of the World( 4th ed.). Hoboken, NJ: John Wiley, 2006 [Google Scholar]
- Niebur E, Hsiao SS, Johnson KO. Synchrony: a neuronal mechanism for attentional selection? Curr Opin Neurobiol 12: 190–164, 2002 [DOI] [PubMed] [Google Scholar]
- Onuki A, Somiya H. Innervation of sonic muscles in teleosts: occipital vs. spinal nerves. Brain Behav Evol 69: 132–141, 2007 [DOI] [PubMed] [Google Scholar]
- Pappas G, Bennett M. Specialized junctions involved in electrical transmission between neurons. Ann NY Acad Sci 137: 495–508, 1966 [DOI] [PubMed] [Google Scholar]
- Remage-Healey L, Bass AH. Rapid, hierarchical modulation of vocal patterning by steroid hormones. J Neurosci 24: 5892–5900, 2004 [DOI] [PMC free article] [PubMed] [Google Scholar]
- Remage-Healey LH, Bass AH. From social behavior to neurons: rapid modulation of advertisement calling and vocal pattern generators by steroid hormones. Horm Behav 50: 432–441, 2006 [DOI] [PubMed] [Google Scholar]
- Rome LC. Design and function of superfast muscles: new insights into the physiology of skeletal muscle. Annu Rev Physiol 68: 193–221, 2006 [DOI] [PubMed] [Google Scholar]
- Rome LC, Syme DA, Hollingworth S, Lindstedt SL, Baylor SM. The whistle and the rattle: the design of sound producing muscles. Proc Natl Acad Sci USA 93: 8095–8100, 1996 [DOI] [PMC free article] [PubMed] [Google Scholar]
- Rubow TK, Bass AH. Reproductive and diurnal rhythms regulate vocal motor plasticity in a teleost fish. J Exp Biol 212: 3252–3262, 2009 [DOI] [PMC free article] [PubMed] [Google Scholar]
- Schaeffer PJ, Conley KE, Lindstedt SL. Structural correlates of speed and endurance in skeletal muscle: the rattlesnake tailshaker muscle. J Exp Biol 199: 351–358, 1996 [DOI] [PubMed] [Google Scholar]
- Schmidt RS. Neural correlates of frog calling—isolated brainstem. J Comp Physiol A 108: 99–113, 1976 [Google Scholar]
- Skoglund CR. Functional analysis of swim-bladder muscles engaged in sound production of the toadfish. J Biophys Biochem Cytol: 187–200, 1961 [DOI] [PMC free article] [PubMed] [Google Scholar]
- Tavolga WN. Sound production and detection. In: Fish Physiology, edited by Hoar WS, Randall DJ. New York: Elsevier, 1971, p. 135–205 [Google Scholar]
- Uhlhaas PJ, Singer W. Neural synchrony in brain disorders: relevance for cognitive dysfunctions and pathophysiology. Neuron 52: 155–168, 2006 [DOI] [PubMed] [Google Scholar]
- van Vreeswijk C, Abbott LF, Ermentrout GB. When inhibition not excitation synchronizes neural firing. J Comput Neurosci 1: 313–321, 1994 [DOI] [PubMed] [Google Scholar]
- Velazquez JL, Carlen PL. Gap junctions, synchrony and seizures. Trends Neurosci 23: 68–74, 2000 [DOI] [PubMed] [Google Scholar]
- Walsh PW, Mommsen TP, Bass AH. Biochemical and molecular aspects of singing in batrachoidid fishes. In: Biochemistry and Molecular Biology of Fishes, edited by Hochachka PW, Mommsen TP. Amsterdam: Elsevier, 1995, vol. 4, p. 279–289 [Google Scholar]
- Wang X, Buzsáki G. Gamma oscillation by synaptic inhibition in a hippocampal interneuronal network model. J Neurosci 16: 6402–6413, 1996 [DOI] [PMC free article] [PubMed] [Google Scholar]
- Weeg MS, Land BR, Bass AH. Vocal pathways modulate efferent neurons to the inner ear and lateral line. J Neurosci 25: 5967–5974, 2005 [DOI] [PMC free article] [PubMed] [Google Scholar]
- Yamaguchi A, Kelley DB. Generating sexually differentiated vocal patterns: laryngeal nerve and EMG recordings from vocalizing male and female African cawed frogs (Xenopus laevis). J Neurosci 20: 1559–1567, 2000 [DOI] [PMC free article] [PubMed] [Google Scholar]
- Zhang HY, Li WC, Heitler WJ, Sillar KT. Electrical coupling synchronises spinal motoneuron activity during swimming in hatchling Xenopus tadpoles. J Physiol 587: 4455–4466, 2009 [DOI] [PMC free article] [PubMed] [Google Scholar]
- Zornik E, Katzen AW, Rhodes HJ, Yamaguchi A. NMDAR-dependent control of call duration in Xenopus laevis. J Neurophysiol 103: 3501–3515, 2010 [DOI] [PMC free article] [PubMed] [Google Scholar]


