

Abstract
Epidemiological studies suggest that vitamin D protects against prostate cancer, although evidence is limited and inconsistent. We investigated associations of circulating total 25-hydroxyvitamin D (25(OH)D) with PSA-detected prostate cancer in a case-control study nested within the Prostate Testing for Cancer and Treatment (ProtecT) trial. Conditional logistic regression was used to estimate odds ratios (OR) and 95% confidence intervals (CI) quantifying the association between circulating total 25(OH)D and prostate cancer. In case-only analyses, we used unconditional logistic regression to quantify associations of total 25(OH)D with stage (advanced vs localized) and Gleason grade (high-grade (≥7) vs low-grade (<7)). Pre-determined categories of total 25(OH)D were defined as: high: ≥30ng/mL; adequate: 20-<30ng/mL; insufficient: 12-<20ng/mL; deficient: <12ng/mL. Fractional polynomials were used to investigate the existence of any U-shaped relationship. We included 1,447 prostate cancer cases (153 advanced, 469 high-grade) and 1,449 healthy controls. There was evidence that men deficient in vitamin D had a two-fold increased risk of advanced versus localized cancer (OR for deficient vs adequate total 25(OH)D=2.33, 95% CI: 1.26,4.28) and high-grade versus low-grade cancer (OR for deficient vs adequate total 25(OH)D=1.78, 95% CI: 1.15,2.77). There was no evidence of a linear association between total 25(OH)D and prostate cancer (p=0.44) or of an increased risk of prostate cancer with high and low vitamin D levels. Our study provides evidence that lower 25(OH)D concentrations were associated with more aggressive cancers (advanced versus localized cancers and high- versus low- Gleason grade), but there was no evidence of an association with overall prostate cancer risk.
Keywords: Prostate cancer, vitamin D, 25-hydroxyvitamn D
Introduction
Prostate cancer is the most common male cancer in industrialized countries but knowledge of modifiable risk factors is limited. Ecological studies have reported lower prostate cancer mortality at latitudes closer to the equator1, leading to speculation that 25-hydroxyvitamin D (25(OH)D), which is mainly obtained from sunlight exposure, may protect against prostate cancer2. Metabolites of vitamin D control cellular growth and differentiation3-4 and administration of vitamin D analogues inhibits the progression of prostate cancer in animal models5-6 and in phase II trials7.
In line with ecological studies and understanding of the biological actions of vitamin D, epidemiological studies have shown inverse associations of circulating total 25(OH)D with prostate cancer risk at the individual level3, 8-9. Overall, however, the evidence is inconsistent, with our recent meta-analyses finding little evidence that either increased life-course sun exposure, dietary vitamin D or circulating concentrations of total 25(OH)D or 1,25-dihydroxyvitamin D (1,25(OH)2D (the active form of the hormone) are associated with prostate cancer10-12. There has been some support for a protective role of 25(OH)D in advanced prostate cancers5-6, 13, although this is limited by few studies and small sample sizes (n=62 to 460) with some studies reporting an increased risk of advanced prostate cancer with increased total 25(OH)D10, 14-15 or a possible U-shaped association16. Few studies include exclusively PSA-detected prostate cancer, of increasing relevance in the PSA-era due to earlier detection of localized disease.
We investigated associations of circulating total 25(OH)D with PSA-detected prostate cancer, overall and stratified by stage and grade in a large UK-wide population-based case-control study17. The sample size (n=1447 cases) is twice the size of the largest previously published study of total 25(OH)D in prostate cancer (n=749). We hypothesized that lower levels of total 25(OH)D are associated with an increased risk of prostate cancer, and that the association is stronger for advanced versus localized, and high-grade versus low-grade, cancer. We also investigated the possibility of a U-shaped relationship (i.e. whether both high and low levels of total 25(OH)D are associated with an increased risk of prostate cancer).
Materials and Methods
Participants
The study is nested within the prostate cancer detection phase for a multi-centre randomized controlled trial of treatments for localized disease: the Prostate Testing for cancer and Treatment (ProtecT) study (ISRCTN20141297)17. During recruitment to the ProtecT study (between 2001 and 2009), over 100,000 men aged 50-69 years at 337 general practices in nine UK centres (Birmingham, Bristol, Cambridge, Cardiff, Edinburgh, Leeds, Leicester, Newcastle, Sheffield) were offered a PSA test at a community-based ‘prostate check clinic’, and those with raised levels (≥ 3 ng/ml) were offered diagnostic biopsy. Detected tumours were all histology-confirmed and clinically staged using the TNM system18. Cancer stages T1-T2 and NX,M0 were categorised as ‘localized’; and T3-T4, N1,M1 as ‘advanced’. ‘High grade’ tumours were defined as a Gleason score ≥ 7 and low-grade as Gleason score <7, after review of biopsy cores by a specialist uro-pathologist.
Case Control Selection
A total of 1,914 cases and 48,692 controls were potentially eligible for selection for the current study (based on men recruited between 2003 and 2008), had provided a plasma heparin sample and consented to prostate cancer research. We randomly selected 1500 cases and one stratum-matched control for each case from those men who had provided a non-fasted blood sample at the prostate check clinic. Controls were randomly selected from the same stratum - i.e. five-year age-band (age at PSA test) and GP/family practice - as cases. Prostate check clinics were held over consecutive weeks at each GP practice, and so matching cases and controls by GP also matches on time and season of blood draw. All participants in the ProtecT prostate check clinics who had no evidence of prostate cancer were eligible for selection as controls; that is, men with a PSA test <3ng/mL or a raised PSA (≥3ng/mL) combined with at least one negative biopsy and no subsequent prostate cancer diagnosis during the follow-up protocol for negative biopsies. All men provided written informed consent prior to inclusion in the study. Trent Multicentre Research Ethics Committee (MREC) approved the ProtecT study (MREC/01/4/025) and the associated ProMPT study which collected biological material (MREC/01/4/061).
Vitamin D Assay
Plasma samples drawn into heparinised tubes at the prostate check clinic were allowed to clot at room temperature, and then were centrifuged for 20 minutes within two hours of collection at 1640 relative centrifugal force. Samples were stored at −80°C, until required for use. For each man, samples were retrieved from storage, thawed and processed by a LabMan™ automated blood reformatting robot, and 500μl of plasma extracted, frozen within 36 hours and sent for 25(OH)D analysis.
The samples were assayed in 31 batches over a period of approximately three months. 25(OH)D2 and 25(OH)D3 were measured in plasma which was deproteinised using zinc sulphate and acetonitrile. A deuterated internal standard was incorporated within every sample analysis (hexadeuterium-25-hydroxyvitamin D3, Synthetica AS, Norway). Samples were measured on a Tandem MS system utilizing chromatographic separation on a Waters Sunfire C18 column (Waters, Manchester UK) using methanol, ammonium acetate and formic acid mobile phase. Detection of 25(OH)D2 and 25(OH)D3 was achieved using a Micromass Quatro Ultima Pt fitted with a Z spray ESI inlet. Excellent chromatographic resolution of the peaks of interest allows use of the primary daughter ions from water loss transitions. The assay was standardized using NIST aligned standard material obtained from Chromsystems (UK). Between batch coefficients of variation for 25(OH)D2 were 4.2% - 5.5%, and for 25(OH)D3 were 4.5%-5.7%, across the assay working range.
Circulating concentrations of 25(OH)D2 and 25(OH)D3 were measured in nanograms per millilitre (ng/mL) where 1ng/mL=2.5nmol/L (nanomoles per litre). Total 25(OH)D (ng/mL) was calculated as the summation of 25(OH)D2 and 25(OH)D3.
Other Covariates
Measures of height, weight, weekly exercise, smoking status, family history of prostate cancer, history of benign prostatic hyperplasia (BPH), diabetes, systolic and diastolic blood pressure, occupational social class, and self-reported ethnicity were collected at the time of the initial PSA test, either by questionnaire or by nurse interview19. These measures were obtained prior to knowledge of the PSA level or diagnosis in 85% of men. We calculated body mass index (BMI; kg/m2), which represents general adiposity. We calculated mean arterial pressure (MAP=(2*diastolic + systolic)/3; mmHg), which represents average arterial blood pressure during a single cardiac cycle.
Statistical Analysis
Mean (and 95% confidence interval (CI)) concentrations of age-adjusted total 25(OH)D were calculated for quantiles of age-group (50-54, 55-59, 60-64, ≥65), study centre location (North: Sheffield, Newcastle, Edinburgh, Leeds; South: Bristol, Cardiff, Birmingham, Leicester, Cambridge ) and season of blood draw (Winter: January, February, March; Spring: April, May, June; Summer: July, August, September; Autumn: October, November, December). Seasonal variation in mean total 25(OH)D per calendar week of blood collection was estimated using locally weighted polynomial regression20 which smoothes long term trends. To allow for the matched sets of cases and controls, conditional logistic regression, was used to estimate odds ratios (OR) and 95% confidence intervals (CI) quantifying the association between circulating concentrations of total 25(OH)D and all prostate cancers. The model included all case-control matching variables (5-year age band and GP surgery), as well as assay batch and exact age. Matching on GP surgery accounted for study centre (i.e. geographical location) and season of blood draw, as clinics were held over a number of consecutive weeks at each GP surgery. A case-only analysis used unconditional logistic regression, controlling for assay batch, age, GP surgery, study centre and season of blood draw, to quantify associations of circulating concentrations of total 25 (OH)D with more aggressive prostate cancer i.e. prostate cancer stage (advanced vs localized) and Gleason grade (high-grade (≥7) vs low-grade (<7)). A case-only analysis was used as all cases have undergone biopsy, therefore removing potential detection bias which could occur through misclassification of control status because of imperfect sensitivity of the PSA test. An odds ratio of greater than 1 indicates that the exposure (low total 25(OH)D) is more strongly associated with advanced cancer compared to localized cancer, or with high-grade cancer compared with low-grade cancer. The vitamin D exposure was based on pre-determined categories of total 25(OH)D , defined as: high: ≥30ng/mL; adequate: 20-<30ng/mL; insufficient: 12-<20ng/mL; deficient: <12ng/mL We also computed ORs and 95% CIs for associations of prostate cancer per standard deviation decrease in 25(OH)D.
Sensitivity analyses were carried out additionally adjusting for family history of prostate cancer, BMI, weekly exercise, diabetes and smoking status. However these variables are not thought to be strongly related to prostate cancer risk and sensitivity analyses confirmed that they did not confound observed associations.
Sensitivity analyses were carried out to assess the impact of additionally adjusting for sample storage time and using a square-root transformation of total 25(OH)D. Comparisons of fractional polynomials21 with between one and two degrees were used to investigate the existence of a U-shaped relationship between continuous total 25(OH)D and prostate cancer.
It has been suggested that complete-case analyses, based only on those men with information on all confounding variables, may produce biased effect estimates22-23. To avoid this we included all men in the analysis by multiply imputing missing covariate values (i=10) using chained equations24, assuming those values could be predicted without bias from the observed relationships between covariates and the outcome measure, and substituting imputed values for missing values. A sensitivity analysis, using complete cases only, determined whether the potential for biased estimates due to missing data was realised.
Analyses were carried out in Stata 11 (StataCorp, 2009. College Station, TX) using the -ice- for multiple imputation with chained equations24 for imputing missing data. All tests of statistical significance were two-sided.
Results
Baseline Characteristics of Study Participants
There were a total of 2,992 eligible men whose blood samples were sent to the laboratory (1,496 cases, 1,496 controls). Three were wrongly labelled so that the results could not be matched back to the patient’s details and were discarded (2 cases, 1 control). There were 93 men (47 cases, 46 controls) for whom results were unusable due to insufficient sample. We therefore included 1,447 prostate cancer cases and 1,449 controls that had a total 25(OH)D measurement available. Of the 1,447 cases, 1,289 (89.1%) were localized cancers, 153 (10.6%) were advanced cancers and 5 (0.3%) were not staged. There were 974 (67.3%) low-grade cases (Gleason grade <7), 469 (32.4%) high-grade cases (Gleason grade ≥7) and 4 (0.2%) cases with no grade.
The baseline characteristics of cases and controls are shown in Table 1. Of the 99.3% of subjects who had recorded ethnicity, 98.9% self-identified as white. The mean age in subjects was 62.5 years (range: 50.3-71.4). Men with localized/low-grade cancer were slightly younger than men with advanced/high-grade cancer. There were no substantial differences between cases and controls, except that more cases had a family history of prostate cancer versus controls and fewer cases had diabetes. Mean arterial pressure was slightly higher in cases than controls. Men with advanced/high-grade cancer had a higher age-adjusted PSA than men with localized/low-grade cancer (data not shown). There was no meaningful difference between the mean storage times of blood samples between cases and controls.
Table 1.
Baseline characteristics of cases and controls included in the study
| Cases n=1447 |
Controls n=1449 |
p for differencea |
|
|---|---|---|---|
|
| |||
| Continuous Variables | Mean (SD) | Mean (SD) | |
| Age (years) | 62.6 (5.0) | 62.4 (5.0) | 0.26 |
| PSA (ng/mL) | 9.4 (26.5) | 1.39 (1.3) | <0.001 |
| BMI (kg/m2) | 27.2 (3.6) | 27.3 (3.9) | 0.28 |
| MAP (mmHg) | 108.2 (12.4) | 107.1 (12.3) | 0.02 |
| Storage Time (years) | 4.3 (1.0) | 4.4 (1.1) | 0.05 |
| Categorical Variables | n (%) | n (%) |
p for
heterogeneity b |
|
| |||
| Age group | |||
| 50-54 | 139 (9.61) | 140 (9.66) | |
| 55-59 | 301 (20.80) | 303 (20.91) | |
| 60-64 | 475 (32.83) | 466 (32.16) | |
| >=65 | 532 (36.77) | 540 (37.27) | 0.98 |
| Centre of Recruitment | |||
| Sheffield | 213 (14.72) | 216 (14.91) | |
| Newcastle | 194 (13.41) | 193 (13.32) | |
| Bristol | 130 (8.98) | 132 (9.11) | |
| Cardiff | 147 (10.16) | 148 (10.21) | |
| Edinburgh | 130 (8.98) | 129 (8.90) | |
| Birmingham | 33 (2.28) | 32 (2.21) | |
| Leicester | 264 (18.24) | 265 (18.29) | |
| Cambridge | 162 (11.20) | 163 (11.25) | |
| Leeds | 174 (12.02) | 171 (11.80) | 1.00 |
| Centre Location | |||
| North | 711 (49.14) | 709 (48.93) | |
| South | 736 (50.86) | 740 (11.80) | 0.91 |
| Season of blood draw | |||
| Winter | 327 (22.60) | 337 (23.26) | |
| Spring | 336 (23.22) | 333 (22.98) | |
| Summer | 389 (26.88) | 375 (25.88) | |
| Autumn | 395 (27.30) | 404 (27.88) | 0.91 |
| Family History | |||
| No | 1182 (91.70) |
1234 (94.27) | |
| Yes | 107 (8.30) | 75 ( 5.73) | 0.01 |
| Social Class | |||
| Managerial/professional | 594 (42.40) | 608 (42.55) | |
| Intermediate | 219 (15.63) | 235 (16.45) | |
| Working | 588 (41.97) | 586 (41.01) | 0.80 |
| BMI | |||
| normal 18.5-25 | 335 (28.46) |
307 (28.77) | |
| overweight >=25 | 621 (52.76) |
534 (50.05) | |
| obese >=30 | 221 (18.78) |
226 (21.18) | 0.29 |
| Smoking | |||
| No | 438 (36.32) | 380 (35.02) | |
| Yes | 768 (63.68) | 705 (64.98) | 0.52 |
| Weekly exercise | |||
| None | 550 (46.65) | 481 (45.42) | |
| 1-2 times | 367 (31.13) | 355 (33.52) | |
| 3-4 times | 184 (15.61) | 159 (15.01) | |
| 5+ times | 78 ( 6.62) | 64 ( 6.04) | 0.66 |
| Diabetes | |||
| No | 1045 (94.06) | 936 (91.59) | |
| Yes | 66 ( 5.94) | 86 ( 8.41) | 0.03 |
| History of BPH | |||
| No | 1298 (91.73) |
1272 (89.70) |
|
| Possible | 63 ( 4.45) | 84 ( 5.92) | |
| Yes | 54 ( 3.82) | 62 ( 4.37) | 0.15 |
Calculated using a t-test
Calculated using a Chi-squared test (χ2)
Men in this table had an available 25(OH)D result.
SD=standard deviation; BMI=body mass index; MAP=mean arterial pressure; BPH=benign prostatic hyperplasia
Characteristics of cases and controls by 25(OH)D Concentration
In our 2,896 men, the overall unadjusted mean total 25(OH)D was 23.0ng/mL (inter-quartile range (IQR): 17.1, 28.0). There was no correlation between PSA and total 25(OH)D level (ρ=−0.03). There were no differences in total 25(OH)D between cases and controls by age-group, study centre location or season of blood draw (Table 2). As expected, men whose blood was drawn in winter had lower total 25(OH)D (Table 2 and Figure 1), but unexpected was that men from study centres in the south of the UK had lower total 25(OH)D (p=0.005).
Table 2.
Mean total 25(OH)D levels (ng/mL) by age group, season of blood draw and study centre location in cases and controls
| All Prostate Cancer Cases (n=1447) |
All Controls (n=1449) |
p for differencea |
|||||
|---|---|---|---|---|---|---|---|
| Mean 25(OH)D (ng/mL) |
SD | p-valueb | Mean 25(OH)D (ng/mL) |
SD | p-valueb | ||
|
|
|
|
|||||
| All | 23.0 | 8.7 | 22.9 | 8.4 | 0.72 | ||
|
Age
group |
|||||||
| 50-54* | 22.9 | 8.8 | 20.9 | 7.9 | 0.05 | ||
| 55-59 | 22.3 | 8.4 | 0.53 | 22.7 | 8.8 | 0.04 | 0.63 |
| 60-64 | 22.8 | 8.8 | 0.96 | 23.0 | 8.2 | 0.01 | 0.70 |
| >=65 | 23.7 | 8.8 | 0.31 | 23.5 | 8.3 | ≤0.001 | 0.71 |
| p for linear trendc | 0.06 | ≤0.001 | |||||
| Centre Location | |||||||
| North* | 23.5 | 9.1 | 23.7 | 8.4 | 0.62 | ||
| South | 22.6 | 8.3 | 0.06d | 22.2 | 8.3 | 0.005d | 0.31 |
| Season of blood draw | |||||||
| Winter* | 18.9 | 7.4 | 19.3 | 8.0 | 0.50 | ||
| Spring | 22.4 | 8.4 | <0.001 | 22.4 | 7.6 | <0.001 | 0.94 |
| Summer | 27.0 | 8.8 | <0.001 | 26.9 | 7.9 | <0.001 | 0.76 |
| Autumn | 23.1 | 8.1 | <0.001 | 22.8 | 8.1 | <0.001 | 0.61 |
Reference category
Calculated using a t-test
p-value calculated from regression models, containing total 25(OH)D level and the variable of interest.
p-value for linear trend calculated by treating categorical variable as continuous in regression model.
Regression model additionally adjusted for season of blood draw
SD=standard deviation
Figure 1.
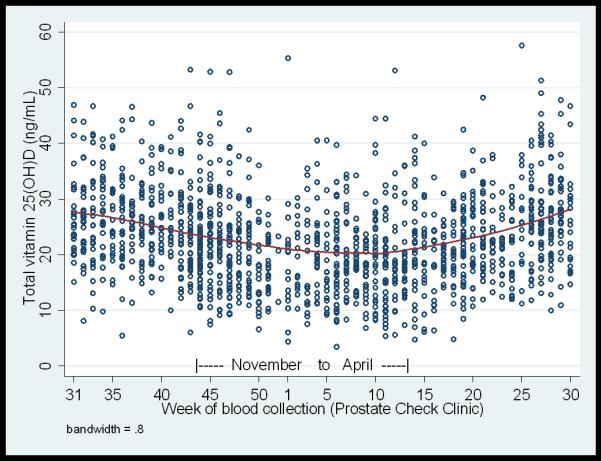
Concentrations of total 25(OH)D by calendar week of blood collection in controls (n=1449). Each circle represents an individual measurement. The smoothed line shows the mean total 25(OH)D values calculated using locally weighted polynomial regression.
Mean total 25(OH)D did not differ between all cases and controls (23.0ng/mL vs 22.9ng/mL respectively, p for difference= 0.72). However, mean total 25(OH)D was lower in men with advanced stage cancers than localized cancers (21.6 (7.9) ng/mL vs 23.2 (8.8) ng/mL, p for difference=0.03), and also in men with high-grade cancers versus low-grade cancers (22.4 (8.5) ng/mL vs 23.3 (8.8) ng/mL, p for difference=0.05).
Concentrations of Total 25(OH)D and Prostate Cancer Risk
In conditional logistic regression models, there was no evidence of an association between circulating total 25(OH)D concentration and case control status (p=0.83) (Table 3). Comparing advanced/high-grade cases with controls, but not localized/low-grade cases with controls, using conditional logistic regression models showed weak evidence of an inverse association (Table 4). However, there was stronger evidence of an association between lower total 25(OH)D and higher risk of advanced versus localized prostate cancer in case-only analyses (Table 4), which remained after adjusting for confounding variables (OR for deficient vs adequate total 25(OH)D=2.33, 95% CI: 1.26,4.28; p for difference=0.01). There was evidence of a linear trend, with increasing risk of advanced prostate cancer as total 25(OH)D levels decreased from high to deficient (OR for advanced cancer per standard deviation decrease in total 25(OH)D = 1.30, 95% CI: 1.06,1.59; p linear trend = 0.01). Similarly, there was evidence of an association between decreasing total 25(OH)D and risk of high-grade versus low-grade prostate cancer (OR of high-grade cancer for deficient vs adequate total 25(OH)D=1.78, 95% CI: 1.15,2.77; p for difference=0.01) (Table 4). The OR of high-grade cancer per standard deviation decrease in total 25(OH)D was 1.14, 95% CI: 1.00,1.29 (p=0.04). Additionally adjusting for family history, BMI, diabetes, smoking status, weekly exercise or storage time of the sample did not alter the results. Complete case analysis produced equivalent odds ratios to using the dataset with imputed missing co-variates. Results did not change if per standard deviation of 25(OH)D3 was included instead of total 25(OH)D. Fractional polynomials found no evidence of a U-shaped relationship between total 25(OH)D and prostate cancer, and there did not appear to be a U-shaped relationship for advanced prostate cancer.
Table 3.
Associations between total 25(OH)D and risk of prostate cancer
| N (%) Cases |
N (%) Controls |
Adjusted for age and assay batch | |||
|---|---|---|---|---|---|
| 25(OH)D (ng/mL) | OR | 95% CI | p-valuea | ||
| High (>=30ng/mL) | 294 (20.3) | 270 (18.6) | 1.05 | (0.84, 1.32) | 0.65 |
| Adequate (20-<30ng/ml) | 574 (39.7) | 616 (42.5) | 1 | ||
| Insufficient (12-<20ng/ml) | 453 (31.3) | 445 (30.7) | 1.14 | (0.93 1.38) | 0.21 |
| Deficient (<12ng/ml) | 126 (8.7) | 118 (8.1) | 1.08 | (0.79, 1.50) | 0.62 |
| p for linear trendb | 0.50 | ||||
| per SD decrease in 25(OH)D (standard deviation = 8.6 ng/mL) |
1449 | 1447 | 1.00 | (0.92, 1.10) | 0.92 |
| p linearity assumptionc | 0.56 | ||||
Calculated from regression models.
p-value for linear trend calculated by treating categorical 25(OH)D as continuous, and setting the reference (baseline) category as ‘High’.
p-value for a likelihood ratio test of the assumption of linearity. Small p value indicates evidence against linearity.
Model is calculated using conditional logistic regression, stratum matched on 5-year age band and GP surgery and additionally adjusted as indicated. An odds ratio of greater than 1 indicates that the exposure is associated with increased risk of prostate cancer compared to controls. An odds ratio of less than 1 indicates that the exposure is associated with decreased risk of prostate cancer compared to controls.
OR=odds ratio; CI=confidence interval; p=p-value; SD=standard deviation.
Table 4.
Associations between total 25(OH)D and prostate cancer stage and grade in cases only, and between advanced/high-grade cases versus controls and localised/low-grade cases versus controls
| N (%) | N (%) | N (%) | Case-only Analysisa Adjusted for age and assay batch |
Advanced/ High-grade cases vs controls Analysisb Adjusted for age and assay batch |
Localised/ Low-grade casesvs controls Analysisb Adjusted for age and assay batch |
|||||||
|---|---|---|---|---|---|---|---|---|---|---|---|---|
| Advanced | Localised | Controls | ||||||||||
| 25(OH)D (ng/mL) | OR | 95%CI | p-valuec | OR | 95%CI | p-valuec | OR | 95%CI | p-valuec | |||
| High (>=30ng/mL) | 26 (17.0) | 268 (20.8) | 270 (18.6) | 0.83 | (0.50, 1.40) | 0.49 | 0.92 | (0.48, 1.76) | 0.81 | 1.08 | (0.85, 1.37) | 0.39 |
| Adequate (20-<30ng/ml) | 56 (36.6) | 516 (40.0) | 118 (8.1) | 1 | 1 | 1 | ||||||
| Insufficient (12-<20ng/ml) |
50 (32.7) | 400 (31.0) | 445 (30.7) | 1.17 | (0.76, 1.80) | 0.47 | 1.43 | (0.81, 2.50) | 0.22 | 1.10 | (0.89, 1.35) | 0.39 |
| Deficient (<12ng/ml) | 21 (13.7) | 105 (8.2) | 616 (42.5) | 2.30 | (1.27, 4.19) | 0.01 | 1.44 | (0.64, 3.24) | 0.38 | 1.00 | (0.71, 1.39) | 0.98 |
| p for linear trendd | 0.01 | 0.96 | 0.57 | |||||||||
| per SD decrease in 25(OH)D (standard deviation =8.6 ng/mL) |
153 | 1289 | 1449 | 1.29 | (1.06, 1.57) | 0.01 | 1.24 | (0.96, 1.59) | 0.10 | 0.97 | (0.89, 1.07) | 0.56 |
| p linearity assumptione | 0.39 | |||||||||||
| High-grade | Low-grade | Controls | ||||||||||
| 25(OH)D (ng/mL) | OR | 95%CI | p-value c | OR | 95%CI | p-value c | OR | 95%CI | p-value c | |||
| High (>=30ng/mL) | 97 (20.7) | 195 (20.0) | 270 (18.6) | 1.21 | (0.87, 1.67) | 0.25 | 1.21 | (0.85, 1.71) | 0.29 | 1.05 | (0.80, 1.37) | 0.73 |
| Adequate (20-<30ng/ml) | 164 (35.0) | 408 (41.9) | 616 (42.5) | 1 | 1 | 1 | ||||||
| Insufficient (12-<20ng/ml) |
157 (33.5) | 296 (30.4) | 445 (30.7) | 1.35 | (1.01, 1.78) | 0.04 | 1.41 | (1.03, 1.92) | 0.03 | 1.04 | (0.83, 1.31) | 0.75 |
| Deficient (<12ng/ml) | 51 (10.9) | 75 (7.7) | 118 (8.1) | 1.82 | (1.18, 2.81) | 0.01 | 1.48 | (0.90, 2.42) | 0.12 | 0.96 | (0.66, 1.39) | 0.83 |
| p for linear trendd | 0.05 | 0.18 | 0.81 | |||||||||
| per SD decrease in 25(OH)D (standard deviation =8.6 ng/mL) |
469 | 974 | 1449 | 1.14 | (1.00, 1.29) | 0.04 | 1.11 | (0.97, 1.28) | 0.14 | 0.96 | (0.86, 1.06) | 0.39 |
| p linearity assumptione | 0.08 | |||||||||||
Case-only models are calculated using logistic regression, adj usted for season of blood draw and study centre location. Models are additionally adj usted as indi cated.
Case vs control models are calculated using condi tional logistic regression, stratum matched on 5-year age band and GP surgery. Models additionally included exact age and assay batch.
Calculated from regression models.
p-value for linear trend calculated by treating categorical 25(OH)D as continuous, and setting the reference (baseline) category as ‘High’.
p-value for a likelihood ratio test of the assumption of linearity. Small p value indicates evidence against linearity.
Advanced stage is T3-T4, localized stage is T1-T2, N0, M0. High-grade is Gleason grade ≥7, low-grade is <7.
An odds ratio of greater than 1 indicates that the exposure is associated with increased risk of advanced cancer compared to localised cancer, or high-grade cancer compared with low-grade cancer. An odds ratio of less than 1 indicates that the exposure is associated with decreased risk of advanced cancer compared to localised cancer, or high-grade cancer compared with low-grade cancer.
OR=odds ratio; CI=confidence interval ; p=p-value; SD=standard deviation.
Discussion
Summary of Findings
This study, of 1,447 prostate cancer cases and 1,449 healthy controls from the ProtecT study, investigated associations of circulating plasma total 25(OH)D with prostate cancer risk and, in cases, with stage and Gleason grade. There was evidence of a two-fold increased risk of advanced versus localized prostate cancer and high-grade versus low-grade cancer in men deficient in vitamin D. There was no evidence of an association between total 25(OH)D and overall prostate cancer incidence (p=0.50).
Our findings agree with some previous epidemiological studies. Our published systematic review and meta-analysis found no overall association between total 25(OH)D concentrations and prostate cancer (14 studies, 4353 prostate cancer cases; random-effects OR per 10ng/mL increase in total 25(OH)D=1.04, 95% CI: 0.99,1.10; p=0.12), or aggressive prostate cancer (6 studies, 871 aggressive prostate cancer cases; random-effects OR per 10ng/mL increase in total 25(OH)D=0.98, 95% CI:0.84,1.15; p=0.78)12. There was, however, weak evidence of a possible small decreased risk of aggressive prostate cancer with increasing 1,25(OH)2D (2 studies, 696 aggressive prostate cancer cases; random-effects OR per 10pg/mL increase in 1,25(OH)2D =0.86, 95% 0.72,1.02; p = 0.09). This result was based on only two studies, so confidence intervals were wide, but a potentially important protective effect of 1,25(OH)2D on advanced prostate cancer could not be excluded. ‘Aggressive’ prostate cancer was defined as advanced stage and/or high grade (as defined in individual papers) and the analysis compared cases with controls, rather than case-only analyses. Our current analysis supports others in indicating no association between total 25(OH)D and overall prostate cancer risk, but does support previous epidemiological and in vivo studies, suggesting that higher levels of vitamin D protect against more aggressive forms of prostate cancer amongst cases. A recent paper by Fang et al25 also found evidence that prostate cancer patients with lower 25(OH)D had a higher risk of developing metastatic or fatal prostate cancer.
The association between total 25 (OH)D and more aggressive prostate cancers amongst cases is consistent with experimental data showing that low total 25 (OH)D concentrations reduce differentiation, and enhance cancer invasion and angiogenesis3-4, 6. Prostate cancer cells have reduced 1-alpha-hydroxylase activity as compared to normal prostate epithelial cells, and thus have a reduced ability to locally convert 25(OH)D to 1,25(OH)2D26. Genes related to the vitamin D pathway suggest a link with advanced disease in particular, with a recent genetic association study and meta-analysis of 13 studies finding an association between three vitamin D receptor gene (VDR) polymorphisms (BsmI, ApaI, and TaqI) and prostate cancer grade27: ApaI-a and BsmIb increased the risk of a high grade, TaqI-t was protective. These polymorphisms modulate the activity of the VDR and therefore may modulate a protective effect of 1,25(OH)2D on aggressive prostate cancers.
Some studies show positive associations of both low and high total 25(OH)D14, 28-30 with prostate cancer, but a review by Yin et al16 concluded that the overall literature is inconsistent. A recent paper by Albanes et al15 found that men with higher 25(OH)D concentrations were at increased risk of developing prostate cancer over up to 20 years follow-up (40-60% increased risk in men with the highest vs lowest levels). They found no evidence of greater risk in men with low vitamin D status. Our analysis found no evidence to replicate these previous findings of an increased risk of prostate cancer with both high and low 25(OH)D levels. The range of total 25(OH)D was comparable between these studies and our data (mean total 25(OH)D ranging from 18.5ng/mL to 24.6mg/mL). Differences in total 25(OH)D across studies may relate to different methodology used to measure total 25(OH)D, or to other factors such as differing latitude or fortification practices between countries in which the studies were conducted12. Our data add to those of Yin et al in suggesting no evidence of a U-shaped relationship.
The overall level of circulating total 25(OH)D (mean=22.9ng/mL) was slightly higher than that reported by the National Diet and Nutrition Survey, designed to be representative of the UK population, which found that the median concentration of plasma 25(OH)D in men aged 50 to 64 years was 20.3ng/mL (SD=8.5; n=190)31. This may be method-related or because included men were healthier than the general population in order for them to be eligible for the ProtecT study (as men were excluded due to pre-existing co-morbidities that would rule out surgery or radical radiotherapy). Also, ProtecT includes few men who identified themselves as black or South Asian, who are likely to have lower total 25(OH)D levels32. An age-related decline in total 25(OH)D levels is expected by, on average, between 0.3 and 0.6ng/mL per year33. We found that vitamin D levels increased with age, which may be because retired men who are healthy have more opportunity for sun exposure34.
Variation of total 25(OH)D by season of blood draw, with the highest levels of total 25(OH)D occurring in the summer months and the lowest in winter, has been consistently demonstrated33, 35. We accounted for seasonal variation in our analysis by matching cases and controls on strata that included date of blood draw. In the case-only analysis, where strata-matching was not accounted for, we adjusted for season of blood draw. Increasing adiposity has consistently been associated with decreasing circulating total 25(OH)D concentrations33-37, but BMI was not strongly associated with prostate cancer in ProtecT38 and it did not confound our observed associations.
Strength and limitations of our study
All of our men were resident in the UK and 99% of our subjects self-reported their ethnicity as white so we cannot assess differences by large changes in latitude or ethnicity. It is also possible that we are studying a relatively healthy population, within which there is not enough variation in total 25(OH)D to be able to ascertain correlations with very high or very low levels. It is widely accepted that total 25(OH)D is the best indicator of short term vitamin D status39 but measuring circulating total 25(OH)D may not reflect biologically active levels in tissues, since the prostate can locally produce 1,25(OH)2D40. However, levels of 1,25(OH)2D are tightly regulated and only fluctuate during insufficiency or severe deficiency of total 25(OH)D. 25(OH)D3 has a half-life of two to three weeks33, so a single measurement of total 25(OH)D at study baseline may not reflect vitamin D status over the life-course, which may be most relevant to cancer aetiology41. Indeed, prostate cancer risk in UK South Asians is consistent with high sun exposure during young adulthood conferring life-long protection42. However, studies assessing the reliability of measurements have shown a low within-person variability over five years (14.9%, 95% CI 12.4,18.1)43 and a high agreement across time points with intra-class correlation coefficients of 0.7 between samples collected three28 and five years apart43. Serum stored for over 40 years was found to have the same predictive power as serum stored for up to two years44, indicating that even though our samples were stored for 4.4 years on average, this should not affect our results.
There is potential for residual confounding, as vitamin D status is likely to be a marker of overall health but we have adjusted for the main risk factors for prostate cancer. Since the decision to biopsy was based on PSA level, some of the controls with PSA<3ng/mL will have unidentified prostate cancer45 (misclassification bias) but this would not affect our analysis of advanced versus localized cancers (as all cancers were biopsy confirmed). Studies have suggested an inverse association between total 25(OH)D and PSA level46-47, but there was no evidence of an association between PSA level and total 25(OH)D in our data. Therefore any misclassification of cancer status is likely to be non-differential with respect to vitamin D status, at most moderately attenuating any effect-estimates. More affluent men tend to have PSA tests and thus be diagnosed with prostate cancer, and such men may have higher vitamin D exposure48 but this would not affect our study where all men had PSA tests. Since the men had prostate cancer at the time of 25(OH)D measurement, it is possible that our results are due to reverse causality (more advanced cases causing lower circulating vitamin D levels). Our case-only comparison uses 25(OH)D levels measured in men diagnosed at the time of their advanced/high-grade cancer versus men diagnosed at the time of their localized/low-grade cancer. We do not have information on 25(OH)D levels prior to disease progression, and therefore cannot rule out reverse causality.
The strengths of our study are the large sample, about which we have extensive information recorded. Circulating total 25(OH)D concentrations were measured at one laboratory, in as few batches and in as short a time frame as possible (thus attenuating any potential technical errors of measurement). The likelihood of falling into the various vitamin D exposure categories is highly dependent on the season of blood draw. However, we know the date of blood draw, and can therefore adjust analyses for season. Recall bias is unlikely since the questionnaire data were predominantly collected prior to the results of the PSA test being known (in 85% of men). The study is population-based and thus subject to little selection bias. Using total 25(OH)D as a biomarker captures vitamin D exposure from sunlight, diet and supplements.
Conclusion
Our study found evidence that lower total 25(OH)D concentrations were associated with more aggressive cancers amongst cases (advanced versus localized cancers and high- versus low-Gleason grade), but there was no evidence of an association with overall prostate cancer risk. This study adds further evidence to the Cancer Research UK SunSmart recommendations49, that the limited amount of sun exposure required to obtain adequate vitamin D levels may reduce aggressive prostate cancer. Randomised controlled trials are required to determine whether supplementation or dietary sources of vitamin D would reduce the risk of aggressive prostate cancer or prostate cancer progression.
Statements.
Our study, of 1,447 prostate cancer cases and 1,449 healthy controls from the ProtecT study, found evidence of a two-fold increased risk of advanced versus localized prostate cancer and high-grade versus low-grade cancer in men deficient in vitamin D. There was no evidence of an association between total 25(OH)D and overall prostate cancer incidence. This study adds further evidence that the modest sun exposure required to obtain adequate vitamin D levels may reduce aggressive disease in men with prostate cancer.
Acknowledgements
This analysis was funded by the World Cancer Research Fund (Grant number 2006/15). RG is recipient of a Cancer Research UK Graduate Training Fellowship (C31211/A10095). The UK Department of Health funded the ProtecT study through the NIHR Health Technology Assessment programme.
The authors would like to acknowledge the provision of additional epidemiological data by the NHS R&D Directorate supported Prodigal study and the ProMPT (Prostate Mechanisms of Progression and Treatment) collaboration which is supported by the National Cancer Research Institute (NCRI) formed by the Department of Health, the Medical Research Council and Cancer Research UK.
The authors would like to acknowledge the tremendous contribution of all members of the ProtecT study research group, and especially the following who were involved in this research (Prasad Bollina, Sue Bonnington, Lynn Bradshaw, James Catto, Debbie Cooper, Michael Davis, Liz Down, Andrew Doble, Alan Doherty, Garrett Durkan, Emma Elliott, David Gillatt, Pippa Herbert, Peter Holding, Joanne Howson, Mandy Jones, Roger Kockelbergh, Howard Kynaston, Teresa Lennon, Norma Lyons, Hing Leung, Malcolm Mason, Hilary Moody, Philip Powell, Alan Paul, Stephen Prescott, Derek Rosario, Patricia O’Sullivan, Pauline Thompson, Sarah Tidball). They would also like to thank Gemma Marsden, who processed the blood samples at the biorepository. Department of Health disclaimer: The views and opinions expressed therein are those of the authors and do not necessarily reflect those of the Department of Health.
Abbreviations
- (25(OH)D)
25-hydroxyvitamin D
- (ProtecT)
Prostate Testing for Cancer and Treatment trial
- (PSA)
prostate specific antigen
- (ng/mL)
nanograms per millilitre
- (OR)
odds ratios
- (CI)
confidence intervals
- (BMI)
body mass index
- (MAP)
mean arterial pressure
Footnotes
Conflicts of Interest: none
Reference List
- 1.Schwartz GG, Hanchette CL. UV, latitude, and spatial trends in prostate cancer mortality: all sunlight is not the same (United States) Cancer Causes and Control. 2006;17:1091–101. doi: 10.1007/s10552-006-0050-6. [DOI] [PubMed] [Google Scholar]
- 2.Holick MF. Sunlight and vitamin D for bone health and prevention of autoimmune diseases, cancers, and cardiovascular disease. American Journal of Clinical Nutrition. 2004;80:1678S–88. doi: 10.1093/ajcn/80.6.1678S. [DOI] [PubMed] [Google Scholar]
- 3.Giovannucci E. The epidemiology of vitamin D and cancer incidence and mortality: A review (United States) Cancer Causes and Control. 2005;16:83–95. doi: 10.1007/s10552-004-1661-4. [DOI] [PubMed] [Google Scholar]
- 4.Lou YR, Qiao S, Talonpoika R, Syvala H, Tuohimaa P. The role of Vitamin D3 metabolism in prostate cancer. Journal of Steroid Biochemistry and Molecular Biology. 2004;92:317–25. doi: 10.1016/j.jsbmb.2004.10.007. [DOI] [PubMed] [Google Scholar]
- 5.Willis MS, Wians FH. The role of nutrition in preventing prostate cancer: a review of the proposed mechanism of action of various dietary substances. Clinica Chimica Acta. 2003;330:57–83. doi: 10.1016/s0009-8981(03)00048-2. [DOI] [PubMed] [Google Scholar]
- 6.Lokeshwar BL, Schwartz GG, Selzer MG, Burnstein KL, Zhuang SH, Block NL, Binderup L. Inhibition of Prostate Cancer Metastasis in Vivo: A Comparison of 1,25-Dihydroxyvitamin D (Calcitriol) and EB1089. Cancer Epidemiology Biomarkers Prevention. 1999;8:241–48. [PubMed] [Google Scholar]
- 7.Stewart LV, Weigel NL. Vitamin D and Prostate Cancer. Experimental Biology and Medicine. 2004;229:277–84. doi: 10.1177/153537020422900401. [DOI] [PubMed] [Google Scholar]
- 8.Schwartz GG. Vitamin D and the epidemiology of prostate cancer. Seminars in Dialysis. 2005;18:276–89. doi: 10.1111/j.1525-139X.2005.18403.x. [DOI] [PubMed] [Google Scholar]
- 9.Polek TC, Weigel NL. Vitamin D and prostate cancer. Journal of Andrology. 2002;23:9–17. doi: 10.1002/j.1939-4640.2002.tb02596.x. [DOI] [PubMed] [Google Scholar]
- 10.Gilbert R, Metcalfe C, Oliver SE, Whiteman DC, Bain C, Ness AR, Donovan J, Hamdy F, Neal DE, Lane JA, Martin RM. Life course sun exposure and risk of prostate cancer: population-based nested case-control study and meta-analysis. International Journal of Cancer. 2009;125:1414–23. doi: 10.1002/ijc.24411. [DOI] [PMC free article] [PubMed] [Google Scholar]
- 11.World Cancer Research Fund / American Institute for Cancer R . Food, Nutrition, Physical Activity, and the Prevention of Cancer: a Global Perspectiveed. AICR; Washington DC: 2007. [Google Scholar]
- 12.Gilbert R, Martin RM, Beynon R, Harris R, Savovic J, Zuccolo L, Bekkering GE, Fraser WD, Sterne JAC, Metcalfe C. Associations of circulating and dietary vitamin D with prostate cancer risk: a systematic review and dose-response meta-analysis. Cancer Causes and Control. 2011:319–40. doi: 10.1007/s10552-010-9706-3. [DOI] [PubMed] [Google Scholar]
- 13.Ahonen MH, Tenkanen L, Teppo L, Hakama M, Tuohimaa P. Prostate cancer risk and prediagnostic serum 25-hydroxyvitamin D levels (Finland) Cancer Causes and Control. 2000;11:847–52. doi: 10.1023/a:1008923802001. [DOI] [PubMed] [Google Scholar]
- 14.Tuohimaa P, Tenkanen L, Ahonen M, Lumme S, Jellum E, Hallmans G, Stattin P, Harvei S, Hakulinen T, Luostarinen T, Dillner J, Lehtinen M, et al. Both high and low levels of blood vitamin D are associated with a higher prostate cancer risk: a longitudinal, nested case-control study in the Nordic countries. International Journal of Cancer. 2004:104–08. doi: 10.1002/ijc.11375. [DOI] [PubMed] [Google Scholar]
- 15.Albanes D, Mondul AM, Yu K, Parisi D, Horst RL, Virtamo J, Weinstein SJ. Serum 25-Hydroxy Vitamin D and Prostate Cancer Risk in a Large Nested Case–Control Study. Cancer Epidemiology Biomarkers & Prevention. 2011;20:1850–60. doi: 10.1158/1055-9965.EPI-11-0403. [DOI] [PMC free article] [PubMed] [Google Scholar]
- 16.Yin L, Raum E, Haug U, Arndt V, Brenner H. Meta-analysis of longitudinal studies: Serum vitamin D and prostate cancer risk. Cancer Epidemiology. 2009:435–45. doi: 10.1016/j.canep.2009.10.014. [DOI] [PubMed] [Google Scholar]
- 17.Lane JA, Hamdy FC, Martin RM, Turner EL, Neal DE, Donovan JL. Latest results from the UK trials evaluating prostate cancer screening and treatment: The CAP and ProtecT studies. European Journal of Cancer. 2010;46:3095–101. doi: 10.1016/j.ejca.2010.09.016. [DOI] [PubMed] [Google Scholar]
- 18.Ohori M, Wheeler TM, Scardino PT. The New American Joint Committee on Cancer and International Union Against Cancer TNM classification of prostate cancer. Clinicopathologic correlations. Cancer. 1994;74:104–14. doi: 10.1002/1097-0142(19940701)74:1<104::aid-cncr2820740119>3.0.co;2-5. [DOI] [PubMed] [Google Scholar]
- 19.Rowlands MA, Holly JM, Gunnell D, Gilbert R, Donovan J, Lane JA, Marsden G, Collin SM, Hamdy F, Neal DE, Martin RM. The relation between adiposity throughout the life course and variation in IGFs and IGFBPs: evidence from the ProtecT (Prostate testing for cancer and Treatment) study. Cancer Causes and Control. 2010;21:1829–42. doi: 10.1007/s10552-010-9610-x. [DOI] [PubMed] [Google Scholar]
- 20.Borkowf CB, Albert PS, Abnet CC. Using lowess to remove systematic trends over time in predictor variables prior to logistic regression with quantile categories. Statistics in Medicine. 2003;22:1477–93. doi: 10.1002/sim.1507. [DOI] [PubMed] [Google Scholar]
- 21.Royston P, Sauerbrei W. Multivariable Model-building: a pragmatic approach to regression analysis based on fractional polynomials for modelling continuous variablesed. Wiley; 2008. [Google Scholar]
- 22.Janssen KJM, Donders AR, Harrell, Vergouwe Y, Chen Q, Grobbee DE, Moons KGM. Missing covariate data in medical research: To impute is better than to ignore. Journal of Clinical Epidemiology. 2010;63:721–27. doi: 10.1016/j.jclinepi.2009.12.008. [DOI] [PubMed] [Google Scholar]
- 23.Wood AM, White IR, Royston P. How should variable selection be performed with multiply imputed data? Statistics in Medicine. 2008;27:3227–46. doi: 10.1002/sim.3177. [DOI] [PubMed] [Google Scholar]
- 24.Royston P. Multiple imputation of missing values: Further update of ice, with an emphasis on categorical variables. Stata Journal. 2009;9:466–77. [Google Scholar]
- 25.Fang F, Kasperzyk JL, Shui I, Hendrickson W, Hollis BW, Fall K, Ma J, Gaziano JM, Stampfer MJ, Mucci LA, Giovannucci E. Prediagnostic Plasma Vitamin D Metabolites and Mortality among Patients with Prostate Cancer. PLoS ONE [Electronic Resource] 2011;6:e18625. doi: 10.1371/journal.pone.0018625. [DOI] [PMC free article] [PubMed] [Google Scholar]
- 26.Chen TC, Wang L, Whitlatch LW, Flanagan JN, Holick MF. Prostatic 25-hydroxyvitamin D-1alpha-hydroxylase and its implication in prostate cancer. Journal of Cellular Biochemistry. 2003;88:315–22. doi: 10.1002/jcb.10342. [DOI] [PubMed] [Google Scholar]
- 27.Chen L, Davey SG, Evans DM, Cox A, Lawlor DA, Donovan J, Yuan W, Day IN, Martin RM, Lane A, Rodriguez S, Davis M, et al. Genetic variants in the vitamin d receptor are associated with advanced prostate cancer at diagnosis: findings from the prostate testing for cancer and treatment study and a systematic review. Cancer Epidemiology Biomarkers Prevention. 2009;18:2874–81. doi: 10.1158/1055-9965.EPI-09-0544. [DOI] [PubMed] [Google Scholar]
- 28.Platz EA, Leitzmann MF, Hollis BW, Willett WC, Giovannucci E. Plasma 1,25-dihydroxy- and 25-hydroxyvitamin D and subsequent risk of prostate cancer. Cancer Causes and Control. 2004;15:255–65. doi: 10.1023/B:CACO.0000024245.24880.8a. [DOI] [PubMed] [Google Scholar]
- 29.Faupel-Badger JM, Diaw L, Albanes D, Virtamo J, Woodson K, Tangrea JA. Lack of Association between Serum Levels of 25-Hydroxyvitamin D and the Subsequent Risk of Prostate Cancer in Finnish Men. Cancer Epidemiology Biomarkers Prevention. 2007;16:2784–86. doi: 10.1158/1055-9965.EPI-07-0672. [DOI] [PubMed] [Google Scholar]
- 30.Tuohimaa P, Tenkanen L, Syvala H, Lumme S, Hakulinen T, Dillner J, Hakama M. Interaction of Factors Related to the Metabolic Syndrome and Vitamin D on Risk of Prostate Cancer. Cancer Epidemiology Biomarkers Prevention. 2007;16:302–07. doi: 10.1158/1055-9965.EPI-06-0777. [DOI] [PubMed] [Google Scholar]
- 31.Ruston D, Henderson L, Gregory J, Bates CJ, Prentice A, Birch M, Swan G, Farron M. The National Diet and Nutrition Survey: adults aged 19 to 64 years. 2004;Volume 4: Nutritional Status (anthropometry and blood analytes), blood pressure and physical activity http://www.statistics.gov.uk/downloads/theme_health/NDNS_V4.pdf. [Google Scholar]
- 32.Harris SS. Vitamin D and African Americans. Journal of Nutrition. 2006;136:1126–29. doi: 10.1093/jn/136.4.1126. [DOI] [PubMed] [Google Scholar]
- 33.Iarc Working Group Reports I. Vitamin D and Cancer. 2008 http://com.iarc.fr/en/publications/pdfs-online/wrk/wrk5/Report_VitD.pdf.
- 34.Giovannucci E, Liu Y, Rimm EB, Hollis BW, Fuchs CS, Stampfer MJ, Willett WC. Prospective Study of Predictors of Vitamin D Status and Cancer Incidence and Mortality in Men. JNCI Cancer Spectrum. 2006;98:451–59. doi: 10.1093/jnci/djj101. [DOI] [PubMed] [Google Scholar]
- 35.McCullough ML, Weinstein SJ, Freedman DM, Helzlsouer K, Flanders WD, Koenig K, Kolonel L, Laden F, Le Marchand L, Purdue M, Snyder K, Stevens VL, et al. Correlates of Circulating 25-Hydroxyvitamin D: Cohort Consortium Vitamin D Pooling Project of Rarer Cancers. American Journal of Epidemiology. 2010;172:21–35. doi: 10.1093/aje/kwq113. [DOI] [PMC free article] [PubMed] [Google Scholar]
- 36.Egan KM, Signorello LB, Munro HM, Hargreaves MK, Hollis BW, Blot WJ. Vitamin D insufficiency among African-Americans in the southeastern United States: implications for cancer disparities (United States) Cancer Causes and Control. 2008;19:527–35. doi: 10.1007/s10552-008-9115-z. [DOI] [PubMed] [Google Scholar]
- 37.Tseng M, Giri V, Bruner DW, Giovannucci E. Prevalence and correlates of vitamin D status in African American men. BMC Public Health. 2009;9:191. doi: 10.1186/1471-2458-9-191. [DOI] [PMC free article] [PubMed] [Google Scholar]
- 38.Dimitropoulou P, Martin RM, Turner EL, Lane JA, Gilbert R, Davis M, Donovan JL, Hamdy FC, Neal DE. Association of obesity with prostate cancer: a case-control study within the population-based PSA testing phase of the ProtecT study. Br J Cancer. 2011;104:875–81. doi: 10.1038/sj.bjc.6606066. [DOI] [PMC free article] [PubMed] [Google Scholar]
- 39.Zerwekh JE. Blood biomarkers of vitamin D status. American Journal of Clinical Nutrition. 2008;87:1087S–11091. doi: 10.1093/ajcn/87.4.1087S. [DOI] [PubMed] [Google Scholar]
- 40.Young MV, Schwartz GG, Wang L, Jamieson DP, Whitlatch LW, Flanagan JN, Lokeshwar BL, Holick MF, Chen TC. The prostate 25-hydroxyvitamin D-1{alpha}-hydroxylase is not influenced by parathyroid hormone and calcium: implications for prostate cancer chemoprevention by vitamin D. Carcinogenesis. 2004;25:967–71. doi: 10.1093/carcin/bgh082. [DOI] [PubMed] [Google Scholar]
- 41.Millen AE, Bodnar LM. Vitamin D assessment in population-based studies: a review of the issues. American Journal of Clinical Nutrition. 2008;87:1102S–11105. doi: 10.1093/ajcn/87.4.1102S. [DOI] [PubMed] [Google Scholar]
- 42.Metcalfe C, Patel B, Evans S, Ibrahim F, Anson K, Chinegwundoh F, Corbishley C, Dorling D, Thomas B, Gillatt D, Kirby R, Muir G, et al. The risk of prostate cancer amongst South Asian men in southern England: the PROCESS cohort study. BJU International. 2008;102:1407–12. doi: 10.1111/j.1464-410X.2008.07818.x. [DOI] [PubMed] [Google Scholar]
- 43.Hofmann JN, Yu K, Horst RL, Hayes RB, Purdue MP. Long-term Variation in Serum 25-Hydroxyvitamin D Concentration among Participants in the Prostate, Lung, Colorectal, and Ovarian Cancer Screening Trial. Cancer Epidemiology Biomarkers Prevention. 2010;19:927–31. doi: 10.1158/1055-9965.EPI-09-1121. [DOI] [PMC free article] [PubMed] [Google Scholar]
- 44.Bodnar LM, Catov JM, Wisner KL, Klebanoff MA. Racial and seasonal differences in 25-hydroxyvitamin D detected in maternal sera frozen for over 40 years. British Journal of Nutrition. 2009;101:278–84. doi: 10.1017/S0007114508981460. [DOI] [PMC free article] [PubMed] [Google Scholar]
- 45.Thompson IM, Ankerst DP, Chi C, Lucia MS, Goodman PJ, Crowley JJ, Parnes HL, Coltman CA., Jr. Operating Characteristics of Prostate-Specific Antigen in Men With an Initial PSA Level of 3.0 ng/mL or Lower. JAMA: The Journal of the American Medical Association. 2005;294:66–70. doi: 10.1001/jama.294.1.66. [DOI] [PubMed] [Google Scholar]
- 46.Weinrich S, Ellison G, Weinrich M, Ross KS, Reis-Starr C. Low Sun Exposure and Elevated Serum Prostate Specific Antigen in African American and Caucasian Men. Am J Health Stud. 2002;17:148–50. [Google Scholar]
- 47.Gross C, Stamey T, Hancock S, Feldman D. Treatment of early recurrent prostate cancer with 1,25-dihydroxyvitamin D3 (calcitriol) Journal of Urology. 1998;159:2035–39. doi: 10.1016/S0022-5347(01)63236-1. [DOI] [PubMed] [Google Scholar]
- 48.Ross LE, Coates RJ, Breen N, Uhler RJ, Potosky AL, Blackman D. Prostate-specific antigen test use reported in the 2000 National Health Interview Survey. Preventive Medicine. 2004;38:732–44. doi: 10.1016/j.ypmed.2004.01.005. [DOI] [PubMed] [Google Scholar]
- 49.Cancer Research UK. SunSmart 2009 http://www.sunsmart.org.uk/